Effervescence-assisted dispersive liquid–liquid microextraction based on the solidification of a floating ionic liquid with a special collection method for the rapid determination of benzoylurea insecticides in water samples

Lu Hu, Heng Qian, Xiaoling Yang, Songqing Li, Sanbing Zhang, Runhua Lu, Wenfeng Zhou and Haixiang Gao*
Department of Applied Chemistry, China Agricultural University, Yuanmingyuan West Road 2#, Haidian District, Beijing 100194, China. E-mail: hxgao@cau.edu.cn; Tel: +86-010-62730244

Received 13th July 2016 , Accepted 23rd September 2016

First published on 23rd September 2016


Abstract

A novel and simple method for effervescence-assisted dispersive liquid–liquid microextraction based on the solidification of a floating ionic liquid using a special collection method combined with high-performance liquid chromatography is developed for the determination of four benzoylureas in water samples. In this method, the ionic liquid (IL), trihexyl(tetradecyl)phosphonium tetrafluoroborate, is used rather than organic drops, which have limitations, as the extraction solvent for the first time in dispersive liquid–liquid microextraction based on the solidification of floating organic drops (DLLME-SFO). Due to the high viscosity of the IL, it can be quickly collected in the lid of the centrifuge tube after solidification, which combines the advantages of both dispersive liquid–liquid microextraction and liquid phase microextraction based on the solidification of a floating IL. Furthermore, effervescence is used to disperse the IL, thereby avoiding the use of an organic dispersant. The influence of various experimental factors, such as the form of the effervescent material, IL quantity, base to acid ratio in the effervescent tablet, weight ratio of IL to effervescent tablet, ultrasonication time, centrifugation time, extraction temperature, sample pH, extraction time and salt addition, are optimized using a central composite design and the one-factor-at-a-time approach. Under the optimal conditions, good linearity was obtained for the four BUs from 2 to 500 μg L−1, with correlation coefficients ranging from 0.9994 to 0.9995. The recoveries were 90.2–100.2% with relative standard deviations ranging from 1.3–4.4%. The limits of detection for the analytes were between 0.77 to 1.58 μg L−1, and the enrichment factors ranged from 206 to 228. Additionally, this method was successfully applied for the determination of four BUs in real water samples.
1. Introduction

Benzoylureas (BUs) constitute a major class of insect growth regulators created by Bayer of Germany in 1978. By interfering with the normal activity of target insects' endocrine systems, BU insecticides control the development, reproduction, and metamorphosis of target insects. With the advantages of low mammalian toxicity, easy biodegradation, high biological activity and low environmental persistence, BUs are widely used to control pests.1,2 However, the extensive use of BUs presents a risk of contaminating of natural commodities and waterways due to the persistence of these compounds in the environment. To protect consumers, many countries and regions have established strict residue limits for BUs. In China, the National Food Safety Standard (GB 2763-2015) established maximum residue limits for BUs in food of 0.5–1.0 mg kg−1.3 Therefore, effective and convenient analytical methods are necessary for the efficient extraction and trace-level detection of BUs.

Preconcentration procedures are essential steps in the analysis of BUs. Several methods have been used for the determination of BUs, such as solid-phase extraction (SPE) combined with high-performance liquid chromatography-triple quadrupole mass spectrometry (HPLC-MS/MS),4 and in situ dispersive liquid–liquid microextraction (in situ DLLME) combined with HPLC.5

Liquid-phase microextraction (LPME) is the most frequently employed method for analyzing of trace-level residues.6 LPME is simple and efficient, uses less toxic reagents, has higher preconcentration factors7,8 and has been successfully applied in the determination of different types of analytes. Several LPME techniques have been successfully introduced, such as liquid-phase microextraction based on the solidification of floating organic drops (LPME-SFO),9 dispersive liquid–liquid microextraction (DLLME),10 single-drop microextraction (SDME)11 and hollow-fiber-based liquid-phase microextraction (HF-LPME).12

Among these methods, DLLME is one of the most widely used methods for the preconcentration of residues from real samples. DLLME was first introduced by Assadi and co-workers in 200613 and has since been widely used for the preconcentration of trace-level residues.14,15 LPME-SFO is also an important technique among the LPME methods. In contrast to traditional DLLME, LPME-SFO does not require a centrifugation step, and the extraction solvent can be directly obtained after solidification.16,17 However, a magnetic stirrer is used in LPME-SFO to complete the extraction procedure, which requires a long equilibration time for extraction. Subsequently, the DLLME-SFO method was developed,18,19 in which extraction equilibrium is reached quickly, as in DLLME. Importantly, the extraction solvent in this method possesses a melting point that allows it to solidify at low temperatures and facilitate easy collection and must be of low density in order to float on the water sample. However, only a few solvents meet these requirements.20–22 In a literature survey, 1-undecanol, 2-dodecanol, 1-dodecanol and hexadecane were reported for use in DLLME-SFO.23–26 However, only 1-undecanol and 1-dodecanol have been widely used successfully in this method.9,16,27–30 Moreover, these solvents all possess low polarities, thus making the extraction of some polar analytes difficult. Therefore, we developed a new method: dispersive liquid–liquid microextraction based on the solidification of floating ionic liquids (DLLME-SFIL).

The use of ILs as extraction solvents was first introduced in liquid–liquid extraction by Rogers et al. in 1998.31 Subsequently, ILs, with useful properties, such as negligible vapor pressures, variable viscosities and high thermal stabilities, have been used in place of organic reagents in numerous studies. Several types of methods have been studied,32–34 such as IL-DLLME,35 IL-SDME36 and IL-HF-LPME.37

ILs consist of organic cations and organic or inorganic anions. Since both the anion and cation can be varied, these solvents can be designed for specific end uses or to obtain a particular set of properties. This tailorability has led to ILs being referred to as “designer solvents”.38 We found that some quaternary phosphonium salt and quaternary ammonium salt ILs can be customized to possess the same properties as the organic drops that are used in LPME-SFO.39,40 In this work, a phosphonium-based IL, trihexyl(tetradecyl)phosphonium tetrafluoroborate ([P14,6,6,6]BF4), is used in the developed DLLME-SFIL method in place of organic drops. This IL has a melting point of 38.5 °C, which allows it to solidify at low temperatures, and a low density of 0.93 g cm−3, which allows it to float on the surface of the sample after centrifugation.41 The IL was ground with an effervescent material and then pressed into a tablet using a tablet machine. When the tablet was placed in a water sample, the produced carbon dioxide dispersed the IL, forming fine droplets in the water.

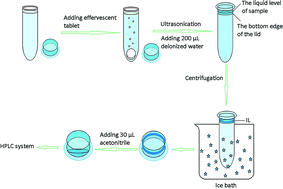
A disadvantage of DLLME-SFO is that the extract cannot be quickly collected as in LPME-SFO because it often sticks to the wall of the device. Some of the extraction solvent cannot be collected, which significantly influences the method's accuracy and repeatability. To avoid this problem and collect the IL quickly, we made the fullest use of the lid of the centrifuge tube (Fig. 1). After extraction, a little deionized water was added to ensure that the bottom edge was immersed more than 2 mm. After centrifugation, the extract is stuck to the lid, and can then be directly collected into the lid quickly after the solidification procedure, which makes the method more convenient and combines the advantages of DLLME-SFO and LPME-SFO. This collection technique can also be used in traditional DLLME-SFO and certain LDS-DLLME methods utilizing a high viscosity extraction solvent.


image file: c6ra17889h-f1.tif
Fig. 1 Schematic procedure for DLLME-SFIL.

In most LPME analyses, the efficiency and performance of the method can be significantly affected by different parameters. The traditional one-factor-at-a-time optimization method is simple and effective, but it cannot examine the interactions between variables. Thus, central composite design (CCD) was used in this study to examine the interaction between three important factors. A combination of the one-factor-at-a-time optimization method and CCD was used to determine the optimal condition.

In this study, a novel and efficient method named DLLME-SFIL is developed and combined with HPLC to determine four BUs in water samples. In this method, an IL is used rather than organic drops as the extraction solvent, effervescence is adopted to disperse the IL, and the extraction solvent is quickly collected in the lid of the centrifuge tube. The effects of certain experimental parameters, such as the form of the effervescent material, base to acid ratio in the effervescent tablet, weight ratio of IL to effervescent tablet, ultrasonication time, centrifugation time, extraction temperature, sample pH, extraction time and salt addition, are optimized using a CCD and one-factor-at-a-time approach. Finally, the optimized conditions are used to determine BUs in real samples.

2. Experimental

2.1. Reagents and materials

All benzoylurea insecticide standards (triflumuron, hexaflumuron, flufenoxuron, and chlorfluazuron) and sodium tetrafluoroborate (KBF4) were purchased from Aladdin Reagent Corporation (Shanghai, China). Trihexyl(tetradecyl)phosphonium tetrafluoroborate ([P14,6,6,6]BF4) was obtained from J & K Chemical Technology Co., Ltd (Beijing, China). HPLC-grade methanol was supplied by Dikma Limited (Beijing, China). Purified deionized water was obtained from a Milli-QSP reagent water system (Millipore, Bedford, MA, USA). Sodium dihydrogen phosphate (analytical grade) and sodium bicarbonate (analytical grade) were supplied by the Beijing Chemical Reagent Company.

A mixed standard solution of 100 mg L−1 of each BU was prepared in acetonitrile and the solutions were stored in the dark at 4 °C. The working standard aqueous solutions were prepared daily by diluting an appropriate amount of the mixed standard solution to various concentrations using acetonitrile.

Three river water samples, Qujiang (Quzhou, Zhejiang Province), Tongli (Suzhou, Jiangsu Province), and Fuhe (Huangshi, Hubei Province), were used for method validation. The environmental water samples were filtered through a 0.22 μm mixed cellulose membrane and stored in the dark at 4 °C prior to use.

2.2. Instrumentation

Separation of the four BUs was performed using an Agilent 1200 HPLC system (CA, USA) equipped with a diode array detector (DAD) and an automated sample injector. A Spursil C18 column (5 μm, 4.6 mm × 250 mm, Dikma) with Spursil C18 guard cartridges (5 μm, 2.1 mm × 10 mm, Dikma) was used for the separations.

The mobile phase consisted of a methanol/water mixture, with gradient elution under the following conditions: 0–15 min, 80–95% methanol; 15–18 min, 95–80% methanol; and 18–22 min, 80% methanol. The mobile phase was delivered at a flow rate of 1 mL min−1, and the column temperature was 25 °C. The detection wavelength was 254 nm. A Baiyang 52A centrifuge from the Baiyang Centrifuge Factory (Xin'an, China) and an ultrasonic cleaner (KQ3200DE, Kunshan, China) were used for sample treatment.

2.3. Preparation of the effervescent tablet

Citric acid and sodium bicarbonate were used to produce carbon dioxide because of their good stability and reasonable effervescence time.42,43 However, in this method, because of the high viscosity of the IL, fine drops easily gather if the tablet disperses quickly and cannot obtain good dispersion results. Thus, sodium dihydrogenphosphate and sodium bicarbonate were adopted as the effervescent precursors. Sodium dihydrogenphosphate and sodium bicarbonate were dried in an oven at 80 °C overnight, ground into a powder, and then stored in desiccators prior to mixing. Sodium dihydrogenphosphate (7.2 g) and sodium bicarbonate (2.12 g) were mixed, and then 7 g of the mixture was place in a glass mortar, followed by 1 g of [P14,6,6,6]BF4. The material was ground to achieve homogeneous mixing. Finally, a tablet press machine was used to compress 0.4 g of the mixture (containing 50 mg of the IL) to form an effervescent tablet.

2.4. DLLME-SFIL procedure

Ten milliliters of water sample was spiked with four BUs in a 10 mL centrifuge tube. Under an optimum temperature of 30 °C, one effervescent tablet was placed into the water, and many bubbles were produced from the bottom due to effervescence. The centrifuge tube was then ultrasonicated for 3 min to increase the extraction efficiency, and then 200 μL deionized water was added to ensure that the bottom edge was immersed more than 2 mm. The extraction phase adhered to the lid of the centrifuge tube after centrifugation at 4000 rpm for 12 min. The tube was then carefully placed in an ice bath, and after the IL solidified, the lid was removed and 30 μL of acetonitrile was added to dilute the IL phase. Finally, 5 μL of the collected extraction solvent was directly injected into the HPLC system for analysis. This procedure is schematically shown in Fig. 1.

2.5. Data handling and processing

The Minitab software, version 16 (Minitab Inc., USA) was used to analyze the experimental design matrices and experimental data.

2.6. Calculation of enrichment factors (EFs) and extraction recoveries (ER%)

The EFs and ER% were used to evaluate the extraction efficiency of the developed method, and were calculated using the following equations:
image file: c6ra17889h-t1.tif

image file: c6ra17889h-t2.tif
where, CIL, VIL, Cwater and Vwater are the concentration of the analytes in the sediment phase, the volume of the sediment phase, the initial concentration of the analytes in the water sample and the volume of the water sample, respectively.

3. Results and discussion

3.1. Optimization design

3.1.1. CCD design. In this study, the quantity of the IL directly influences the extraction efficiency, thus a sufficient amount of extraction solvent can ensure complete extraction of the analytes. The ratio of base to acid in the effervescent tablet and the weight ratio of IL to effervescent tablet affect the formation of bubbles and thus the dispersion of the extraction solvent. Therefore, these three important factors (quantity of IL, ratio of base to acid in the effervescent tablet and weight ratio of IL to effervescent tablet) were optimized using CCD to obtain the best response.

With these responses, a second-order polynomial model was constructed through a polynomial fit in CCD. The model was expressed as the following equation:

y = β0 + β1A + β2B + β3C + β12AB + β13AC + β23BC + β11A2 + β22B2 + β33C2
where, y is the response; β0 is the intercept; A, B and C are the independent factors, and β1 through β33 are the coefficients of the polynomial equation.

This design contains a 2k factorial design augmented with 2k additional star points and a central point (C). The variable k is the number of factors to be optimized, and the star points are located ±α (α = ∜2k) from the center of the experimental domain to establish the ratability condition of the CCD. According to the equation n = 2k + 2k + C, the design requires 20 tests, which contain three independent variables and six central points. By using the Minitab software, the mathematical model was obtained through the multivariate regression analysis of the collected chromatographic data for each design point.

Due to the similarity of the four BUs, hexaflumuron was selected as a representative analyte. The results are shown in Table 1, which presents the regression coefficients for each term in the model, Student's t distribution, and the corresponding p values. The coefficient of determination (R2) indicates that the model explains 95.8% of the recovery variability. The adjusted R2 is an adjustment for the number of terms in the respective model. In this work, the adjusted R2 is 90.7%. Higher adjusted R2 values indicate better agreement between the experimental data and the fitted model.

Table 1 Estimated regression coefficients and analysis of variance of the predicted model for analytes recoveries
Terms Coefficients t value p
Constant 77.84 40.68 0.000
A 13.97 10.97 0.000
B −2.022 −1.252 0.246
C 2.633 2.067 0.073
A2 −4.884 −3.680 0.006
B2 6.672 −3.848 0.005
C2 −4.201 −3.166 0.013
AB 1.287 0.782 0.456
AC −1.319 −0.802 0.446
BC 6.326 3.847 0.005


Table 1 indicates that the quantity of IL (A) had the most significant effect on the recovery, with a p-value of less than 0.05. Although the effects of the base to acid ratio in the effervescent tablet (B) and the weight ratio of IL to effervescent tablet (C) were minimal, the interaction effects between B and C were significant at the 95% confidence level, as was the quadratic term of all three factors.

Fig. 2 presents the response surface plots of the three factors, which were obtained by considering the ER (%) as the response. Based on the plots presented in Fig. 2(1), when C was held constant at 5.5, the recovery significantly increased as the amount of [P14,6,6,6]BF4 increased, since analytes can only be completely extracted using a sufficient amount of extraction solvent. However, the increase in the ratio of base to acid in the effervescent tablet induced a decrease in the recovery, which reached a minimum at a ratio of approximately 2, after which the recovery increased again. The ratio of base to acid in the effervescent tablet influences the experimental results in two ways: a low ratio produces smaller droplets, which benefit the dispersal of the extraction solvent, but also result in a lower rate of bubble formation, which hinders dispersal of the extraction solvent. Thus, at a low ratio of base to acid, the smaller droplets will have more significant effects than the rapid rate of bubble formation, and this influence is opposite when the ratio of base to acid is greater than 2.


image file: c6ra17889h-f2.tif
Fig. 2 Response surfaces for benzoylureas using the central composite design obtained by plotting (A) quantity of IL vs. the ratio of base to acid in the effervescent tablet, (B) quantity of IL vs. the weight ratio of IL to effervescent tablet, and (C) the ratio of base to acid in the effervescent tablet vs. the ratio of base to acid in the effervescent tablet.

As shown in Fig. 2(2), the extraction efficiency slightly increased as the weight ratio of IL to effervescent tablet increased. A greater amount of effervescent tablet can result in good dispersion of the extraction solvent. Fig. 2(3) shows the noticeable interaction between B and C, which indicates that the ratio of base to acid has an obvious effect on the weight ratio of IL to effervescent tablet. At a low ratio of base to acid, the lower weight ratio of IL to effervescent tablet easily obtained a good extraction efficiency. In contrast, at a high ratio of base to acid, good recovery can be acquired using a higher weight ratio of IL to effervescent tablet. This result indicates that smaller droplets combined with less effervescent tablet or that bubbles produced more quickly combined with more effervescent tablet can obtain a good extraction efficiency.

According to the CCD experimental results, the optimum DLLME-SFIL conditions are as follows: 50 mg of IL, the ratio of base to acid in the effervescent tablet of 2.5, and the weight ratio of IL to effervescent tablet of 7.

3.1.2. Effect of the ultrasonication time. Ultrasonication plays a vital role in this method, since it can accelerate the formation of a fine dispersive mixture and improve the extraction efficiency. Ultrasonication times in the range of 0 to 7 min were evaluated. Fig. 3 shows the recoveries of the four BUs versus ultrasonication time. The efficiency increased significantly from 0 to 3 min, and then slightly increased after 3 min. Hence, 3 min was used in subsequent experiments.
image file: c6ra17889h-f3.tif
Fig. 3 Effect of ultrasonication time on the recoveries of the BUs (extraction conditions: quantity of IL, 50 mg; ratio of base to acid in the effervescent tablet, 2.5; weight ratio of IL to effervescent tablet, 7; effervescent type, powder; extraction temperature, 30 °C; centrifugation time, 10 min; sample pH, 5–9; extraction time, 0 s; and salt addition, 0%).
3.1.3. Effect of the type of effervescent. The form of the effervescent material greatly influences the dispersive effects, which consequently affects the extraction efficiency. Therefore, two forms, tablet and powder, were evaluated in this method. As shown in Fig. 4, the tablet form obtained a higher extraction efficiency than the powder form. The tablet form required a long time to release all the IL, however it yielded consistent extraction results. In contrast, the powder dispersed quickly, but it resulted in a large relative standard deviation (RSD) compared with the effervescent tablet. Therefore, effervescent tablets were used in the following experiment.
image file: c6ra17889h-f4.tif
Fig. 4 Effect of the form of effervescent on the recoveries of the BUs (extraction conditions: quantity of IL, 50 mg; ratio of base to acid in the effervescent tablet, 2.5; weight ratio of IL to effervescent tablet, 7; ultrasonication time, 3 min; extraction temperature, 30 °C; centrifugation time, 10 min; sample pH, 5–9; extraction time, 0 s; and salt addition, 0%).
3.1.4. Effect of extraction temperature. In this study, the temperature influences the extraction efficiency in three main ways: the extraction solvent has different states at different temperatures, which lead to different extraction abilities; the mass transfer rate varies according to the different temperatures; and the temperature affects the rate of bubble production. Therefore, temperatures from 25 to 45 °C were evaluated. As shown in Fig. 5, the recovery of the four BUs increased as the temperature increased from 25 to 30 °C, which may have been because of a higher mass transfer rate and because the IL was converted to a liquid state. However, the recoveries decreased when the temperatures were higher, which can be explained by the rapid generation of bubbles, which potentially caused the fine drops to gather, thus decreasing the extraction efficiency. Consequently, 30 °C was used in subsequent experiments.
image file: c6ra17889h-f5.tif
Fig. 5 Effect of extraction temperature on the recoveries of the BUs (extraction conditions: quantity of IL, 50 mg; ratio of base to acid in the effervescent tablet, 2.5; weight ratio of IL to effervescent tablet, 7; ultrasonication time, 3 min; effervescent type, tablet; centrifugation time, 10 min; sample pH, 5–9; extraction time, 0 s; and salt addition, 0%).
3.1.5. Effect of centrifugation time. Centrifugation is necessary in the separation procedure. The samples contained in the centrifuge tubes were cloudy after ultrasonication and needed to be rapidly centrifuged to separate the extractant droplets from the samples. Therefore, to investigate the effects of the centrifugation time, centrifugation times of 4 to 20 min at 4000 rpm were evaluated. As shown in Fig. 6, when the centrifugation time was increased from 4 to 12 min, the recovery of the BUs dramatically increased. However, the extraction efficiency only slightly increased after 12 min. Therefore, 12 min was selected as the centrifugation time for this method.
image file: c6ra17889h-f6.tif
Fig. 6 Effect of centrifugation time on the recoveries of the BUs (extraction conditions: quantity of IL, 50 mg; ratio of base to acid in the effervescent tablet, 2.5; weight ratio of IL to effervescent tablet, 7; ultrasonication time, 3 min; effervescent type, powder; extraction temperature, 30 °C; sample pH, 5–9; extraction time, 0 s; and salt addition, 0%).
3.1.6. Effect of sample pH. The pH determines the acid/base form of the analytes in the sample solution, which can influence the analytes' solubility or distribution coefficient in the extractant. In this study, the sample pH was adjusted between 3 and 11 (at 2-unit intervals) using HCl and NaOH. As shown in Fig. 7, the ER did not differ greatly, and almost all recoveries were higher than 90%, but slightly decreased in strong acid and alkali samples (pH = 3 and 11). These results can be explained by the strong extraction ability of the IL for the analytes in different acid/base forms, because the effervescence, excess sodium dihydrogen phosphate and produced sodium hydrogen phosphate formed a buffer solution, which reduced the effects of weak acid and base and then results in a slight increase in recovery. Therefore, the pH of samples was adjusted in the range of 5 to 9.
image file: c6ra17889h-f7.tif
Fig. 7 Effect of sample pH on the recoveries of the BUs (extraction conditions: quantity of IL, 50 mg; ratio of base to acid in the effervescent tablet, 2.5; weight ratio of IL to effervescent tablet, 7; ultrasonication time, 3 min; effervescent type, powder; extraction temperature, 30 °C; centrifugation time, 10 min; extraction time, 0 s; and salt addition, 0%).
3.1.7. Effect of the extraction time and salt addition. The extraction process involves the distribution of analytes from the sample solution phase to the extraction solvent. Thus, the efficiency of mass transfer is greatly affected by the extraction time. The effect of extraction time was evaluated from 0 to 20 min, and no significant effects were observed on the extraction efficiency. The transition of analytes from the sample solution phase to the IL is rapid, and the long ultrasonication time was sufficient for mass transfer. Thus, ultrasonication was quickly followed by centrifugation in subsequent experiments.

The effect of salt addition on the extraction efficiency of BUs was evaluated by adding different amounts of sodium chloride (0–8%) to the sample solution. No significant effects were observed when a small amount salt was added, however a slight decrease in the extraction efficiency was observed when more than 4% sodium chloride was added (Fig. 8). High salt concentrations made the analytes insoluble in the sample solutions and increased the sample solution viscosity, which restricted the transport of analytes to the extractant. Therefore, no salt was added in subsequent experiments.


image file: c6ra17889h-f8.tif
Fig. 8 Effect of sample pH on the recoveries of the BUs (extraction conditions: quantity of IL, 50 mg; ratio of base to acid in the effervescent tablet, 2.5; weight ratio of IL to effervescent tablet, 7; ultrasonication time, 3 min; effervescent type, powder; extraction temperature, 30 °C; centrifugation time, 10 min; sample pH, 5–9; and extraction time, 0 s).

3.2. Method validation

Using the optimal experimental conditions, a calibration study was performed to evaluate the accuracy of the DLLME-SFIL method for the detection of BUs at trace levels, and the results are summarized in Table 2. The regression equations, R2, EFs, RSDs and limits of detection (LODs) of the method were calculated by studying water samples with analytes concentrations of 2–500 μg L−1. Three replicate extractions were performed at each concentration level. The R2 values of the regression equation for the four BUs ranged from 0.9994 to 0.9997, thus showing good linearity. Additionally, good repeatability was obtained, with RSD ranging from 1.3 to 4.4%. The ER of the four BUs were in the range of 90.2 to 100.2%, with EF in the range of 206 to 228. The LODs for the four BUs, calculated at S/N = 3, ranged from 0.77 to 1.58 μg L−1. Considering all of these results, DLLME-SFIL is an efficient and facile method for the detection of BUs in spiked water samples.
Table 2 The performance characteristics of the DLLME-SFIL method combined with HPLC-UV analysis
Analytes Linearity equation Linearity (μg L−1) R2 RSD (%) Enrichment factor LOD (μg L−1) Recovery (%)
Triflumuron Y = 114.9X − 173.2 2–500 0.9994 1.3 228 1.09 100.2
Hexaflumuron Y = 106.4X − 206.8 2–500 0.9995 4.4 216 1.18 94.9
Flufenoxuron Y = 95.32X + 7.9 2–500 0.9997 2.4 206 1.58 90.2
Chlorfluazuron Y = 92.50X − 203.0 2–500 0.9994 2.8 210 0.77 92.3


3.3. Analysis of spiked real water samples

Three river water samples from different locations in China, Qujiang (Quzhou, Zhejiang Province), Tongli (SuZhou, Jiangsu Province), and Fuhe (Huangshi, Hubei Province), were analyzed for the four BUs to investigate the applicability of the DLLME-SFIL method. No significant matrix effects were observed in the results, and the four BU residues were below the detection limit (as shown in Fig. 9(a)). Subsequently, samples spiked with the four BUs at 50 μg L−1 and 100 μg L−1 were used to evaluate the matrix effects, and the typical chromatograms are shown in Fig. 9(b) and (c). The resulting experimental data containing the recoveries and RSDs are summarized in Table 3. For these four BUs, the recoveries ranged from 87.5% to 100.7% and from 85.4% to 97.7% for samples spiked with 50 μg L−1 and 100 μg L−1, respectively, with RSDs ranging from 0.9 to 5.5% and 0.6 to 4.8%, respectively.
image file: c6ra17889h-f9.tif
Fig. 9 HPLC chromatograms of BUs in the spiked and blank environmental water samples: (1) triflumuron; (2) hexaflumuron; (3) flufenoxuron; and (4) chlorfluazuron. In chromatograms a, b and c, the spiked levels were 0, 50 and 100 μg L−1, respectively.
Table 3 Spiked recoveries (%) of three river water from different placesa
Analytes Spiked level (μg L−1) Qujiang Tongli Fuhe
ER (%) RSD ER (%) RSD ER (%) RSD
a ER: extraction recovery (%), RSD: relative standard deviation (%).
Triflumuron 50 100.7 4.0 97.3 3.4 98.3 2.5
100 97.1 3.5 97.7 4.3 96.6 0.8
Hexaflumuron 50 97.1 1.9 93.4 4.6 94.1 2.3
100 93.6 4.7 94.9 4.4 91.0 0.6
Flufenoxuron 50 88.3 5.5 87.5 0.9 90.5 1.0
100 85.6 2.2 86.3 1.8 85.4 1.4
Chlorfluazuron 50 96.9 4.9 92.0 5.3 95.7 4.8
100 92.0 2.4 96.5 4.8 92.9 3.6


3.4. Comparison of DLLME-SFIL with other analytical methodologies

Comparisons between the proposed DLLME-SFIL method and other similar analytical methodologies1–5,44 for the analysis of BUs are presented in Table 4. The proposed method possesses several advantages. Using an IL as the extraction solvent, good recoveries and higher EFs were obtained. Furthermore, the use of an effervescent tablet to disperse the IL, obviates the need for toxic dispersive solvents and less organic solvent is therefore used in the proposed method. Finally, the use of the centrifuge tube lid in this method makes collection of the extraction solvent easier, thus avoiding the necessary transfer procedure in traditional DLLME-SFO, and thereby simplifying the experimental operation. This collection method can also be used in traditional DLLME-SFO or some LDS-DLLME procedures utilizing high viscosity extraction solvents. In conclusion, DLLME-SFIL is demonstrated to be a simple, fast, effective and environmentally friendly technique.
Table 4 Comparison of the proposed DLLME-SFIL method with other methods for the determination of benzoylurea insecticidesa
Method Organic solvent in process Real samples Linearity (μg L−1) Enrichment factors LOD (μg L−1) Recovery (%) Ref.
a VALLME: vortex-assisted liquid–liquid microextraction.
DLLME-HPLC-UV 750 μL ethanol + 200 μL methanol Water 1–70 <50 0.24–0.82 74.0–111.5 1
SPE-HPLC-UV 5.16 mL methanol Water 0.2–40 0.1–0.21 82.0–100.0 2
DSPE-HPLC-UV 3.0 mL dichloromethane + 100 μL methanol Water 1–100 0.1–0.23 91.7–107.9 3
SPE-HPLC-MS/MS-ESI 3.0 mL acetonitrile/toluene + 1.0 mL methanol Oolong tea 5–50 110 0.03–1.0 90.3–102.0 4
In situ DLLME-HPLC-UV 200 μL acetonitrile Water 2–500 <50 0.16–0.45 80.0–89.0 5
VALLME-HPLC-UV 90 μL acetonitrile Water 5–500 140–144 0.73–5.0 97.0–100.9 45
DLLME-SFIL-HPLC 30 μL acetonitrile Water 2–500 206–228 0.77–1.58 90.2–100.2 This work


3.5. Comparison of IL with organic drops as the extraction solvent in DLLME-SFO

In this method, [P14,6,6,6]BF4 was used rather than organic drops as the extraction solvent in DLLME-SFO for the first time. The use of this IL as an extraction solvent is superior to the use of organic drops in the following ways. (i) The IL has negligible vapor pressures and is inflammable, thus making it safer than toxic organic drops. (ii) The IL can be designed to possess special properties,35 meaning that additional ILs can be synthesized with similar properties as the organic drops used in DLLME-SFO, which has the limitations of the extraction solvent. (iii) Compared with the most commonly used extraction solvents, 1-undecanol and 1-dodecanol, ILs have broader applications in sample pretreatment.15,45 (iv) Compared with the organic drops used in DLLME-SFO, ILs have higher viscosities and can adhere to the wall of the tube. When combined with the collection technique used in this method, ILs can be used in low density IL-DLLME, which avoids the solidification procedure. However, a disadvantage of ILs is that they require more time to solidify than organic drops, however this may be overcome by solidifying at a temperature lower than that of an ice bath. In conclusion, ILs broaden the applications of the solidification method and make these methods simpler and more efficient.

4. Conclusions

In the present study, a new preparation methodology, DLLME-SFIL, combined with HPLC-UV was successfully developed for the determination of four BUs in environmental water samples. Several factors in this experiment were optimized using a CCD and the one-factor-at-a-time approach. The IL used in this method, [P14,6,6,6]BF4, has similar properties as the extraction solvent used in DLLME-SFO. This work demonstrates that more ILs can be customized for use in LPME based on IL solidification, which broadens the application of solidification methods. An effervescent tablet was used to disperse the extraction solvent, which avoided the use of organic solvents for dispersion. Moreover, the IL adhered to the lid after centrifugation and could be collected quickly after solidification. This novel collection method could be used in traditional DLLME-SFO or some LDS-DLLME methods utilizing high viscosity extraction solvents. Good linearity and repeatability and high recoveries and EFs were obtained under the optimized conditions. The proposed DLLME-SFIL method is demonstrated to be a rapid, simple, green and efficient method for the determination of BUs in environmental water samples.

Acknowledgements

This work was supported by the fund of the National Natural Science Foundation of China (Project no. 21507159, 21277172 and 21377163) and Chinese Universities Scientific Fund (Project no. 2016QC082).

References

  1. Q. Zhou, G. Wang and G. Xie, J. Sep. Sci., 2013, 36, 2323–2329 CrossRef CAS PubMed.
  2. Y. Huang, Q. Zhou, G. Xie, H. Liu and H. Lin, Microchim. Acta, 2010, 172, 109–115 CrossRef.
  3. X. Liu, C. Wang, Z. Wang, Q. Wu and Z. Wang, Microchim. Acta, 2015, 182, 1903–1910 CrossRef CAS.
  4. L. Chen, J. Chen, Y. Guo, J. Li, Y. Yang, L. Xu and F. Fu, Food Chem., 2014, 143, 405–410 CrossRef CAS PubMed.
  5. S. Li, L. Hu, K. Chen and H. Gao, Anal. Chim. Acta, 2015, 872, 46–54 CrossRef CAS PubMed.
  6. S. Dadfarnia and A. M. Haji Shabani, Anal. Chim. Acta, 2010, 658, 107–119 CrossRef CAS PubMed.
  7. I. Al-Zahrani, C. Basheer and T. Htun, J. Chromatogr. A, 2014, 1330, 97–102 CrossRef CAS PubMed.
  8. C. Mahugo-Santana, Z. Sosa-Ferrera, M. E. Torres-Padrón and J. J. Santana-Rodríguez, TrAC, Trends Anal. Chem., 2011, 30, 731–748 CrossRef CAS.
  9. M. Asadi, S. Dadfarnia, A. M. Haji Shabani and B. Abbasi, J. Sep. Sci., 2015, 38, 2510–2516 CrossRef CAS PubMed.
  10. M. A. Farajzadeh, M. R. Mogaddam and H. Ghorbanpour, J. Chromatogr. A, 2014, 1347, 8–16 CrossRef CAS PubMed.
  11. C. Ruiz-Palomero, M. L. Soriano and M. Valcarcel, Talanta, 2014, 125, 72–77 CrossRef CAS PubMed.
  12. S. Yu, Q. Xiao, B. Zhu, X. Zhong, Y. Xu, G. Su and M. Chen, J. Chromatogr. A, 2014, 1329, 45–51 CrossRef CAS PubMed.
  13. M. Rezaee, Y. Assadi, M. R. Milani Hosseini, E. Aghaee, F. Ahmadi and S. Berijani, J. Chromatogr. A, 2006, 1116, 1–9 CrossRef CAS PubMed.
  14. M. Rezaee, Y. Yamini and M. Faraji, J. Chromatogr. A, 2010, 1217, 2342–2357 CrossRef CAS PubMed.
  15. H. Yan and H. Wang, J. Chromatogr. A, 2013, 1295, 1–15 CrossRef CAS PubMed.
  16. F. O. Pelit and C. Yengin, J. Chromatogr. B, 2014, 949–950, 109–114 CrossRef CAS PubMed.
  17. M. R. Khalili Zanjani, Y. Yamini, S. Shariati and J. A. Jonsson, Anal. Chim. Acta, 2007, 585, 286–293 CrossRef CAS PubMed.
  18. S. Wen and X. Zhu, Talanta, 2013, 115, 814–818 CrossRef CAS PubMed.
  19. S. Zaruba, A. B. Vishnikin and V. Andruch, Microchem. J., 2015, 122, 10–15 CrossRef CAS.
  20. P. Viñas, N. Campillo and V. Andruch, TrAC, Trends Anal. Chem., 2015, 68, 48–77 CrossRef.
  21. M. I. Leong, M. R. Fuh and S. D. Huang, J. Chromatogr. A, 2014, 1335, 2–14 CrossRef CAS PubMed.
  22. M. Dehghani Mohammad Abadi, N. Ashraf, M. Chamsaz and F. Shemirani, Talanta, 2012, 99, 1–12 CrossRef PubMed.
  23. T. Asadollahi, S. Dadfarnia and A. M. Shabani, Talanta, 2010, 82, 208–212 CrossRef CAS PubMed.
  24. M. I. Leong and S. D. Huang, J. Chromatogr. A, 2009, 1216, 7645–7650 CrossRef CAS PubMed.
  25. M. I. Leong and S. D. Huang, J. Chromatogr. A, 2008, 1211, 8–12 CrossRef CAS PubMed.
  26. M. Safdarian, P. Hashemi and M. Naderlou, J. Chromatogr. A, 2012, 1244, 14–19 CrossRef CAS PubMed.
  27. S. Chen, S. Zhu and D. Lu, Food Chem., 2015, 169, 156–161 CrossRef CAS PubMed.
  28. H. Fazelirad and M. A. Taher, Talanta, 2013, 103, 375–383 CrossRef CAS PubMed.
  29. Y. Li, G. Peng, Q. He, H. Zhu and S. M. Al-Hamadani, Spectrochim. Acta, Part A, 2015, 140, 156–161 CrossRef CAS PubMed.
  30. L. E. Vera-Avila, T. Rojo-Portillo, R. Covarrubias-Herrera and A. Pena-Alvarez, Anal. Chim. Acta, 2013, 805, 60–69 CrossRef CAS PubMed.
  31. J. G. Huddleston, H. D. Willauer, R. P. Swatloski, A. E. Visser and R. D. Rogers, Chem. Commun., 1998, 1765–1766 RSC.
  32. L. B. Escudero, A. Castro Grijalba, E. M. Martinis and R. G. Wuilloud, Anal. Bioanal. Chem., 2013, 405, 7597–7613 CrossRef CAS PubMed.
  33. A. R. Hajipour and F. Rafiee, Org. Prep. Proced. Int., 2015, 47, 249–308 CrossRef CAS.
  34. T. D. Ho, A. J. Canestraro and J. L. Anderson, Anal. Chim. Acta, 2011, 695, 18–43 CrossRef CAS PubMed.
  35. Y. Wang, Y. Sun, B. Xu, X. Li, R. Jin, H. Zhang and D. Song, J. Chromatogr. A, 2014, 1373, 9–16 CrossRef CAS PubMed.
  36. L. Vallecillos, E. Pocurull and F. Borrull, Talanta, 2012, 99, 824–832 CrossRef CAS PubMed.
  37. W. Liu, Z. Wei, Q. Zhang, F. Wu, Z. Lin, Q. Lu, F. Lin, G. Chen and L. Zhang, Talanta, 2012, 88, 43–49 CrossRef CAS PubMed.
  38. M. J. Earle and K. R. Seddon, in Clean Solvents, 2002, vol. 819, ch. 2, pp. 10–25 Search PubMed.
  39. S. Anja, K. Daniel, F. Lisa, H. Stephan, G. Markus, G. Michael, K. Regina and B. K. Keppler, Aust. J. Chem., 2010, 63, 511–524 CrossRef.
  40. K. J. Fraser and D. R. MacFarlane, Aust. J. Chem., 2009, 62, 309–321 CrossRef CAS.
  41. K. I. Park and M. Xanthos, Polym. Degrad. Stab., 2009, 94, 834–844 CrossRef CAS.
  42. X. Liu, Z. Shen, P. Wang, C. Liu, Z. Zhou and D. Liu, J. Chromatogr. A, 2014, 1371, 58–64 CrossRef CAS PubMed.
  43. G. Lasarte-Aragones, R. Lucena, S. Cardenas and M. Valcarcel, J. Chromatogr. A, 2011, 1218, 9128–9134 CrossRef CAS PubMed.
  44. L. Hu, S. Li, P. Zhang, X. Yang, M. Yang, R. Lu and H. Gao, J. Sep. Sci., 2014, 37, 2545–2551 CrossRef CAS PubMed.
  45. A. Mehdinia, S. Shegefti and F. Shemirani, Talanta, 2015, 144, 1266–1272 CrossRef CAS PubMed.

This journal is © The Royal Society of Chemistry 2016
Click here to see how this site uses Cookies. View our privacy policy here.