DOI:
10.1039/C6RA19613F
(Paper)
RSC Adv., 2016,
6, 81950-81957
A novel facile and fast hydrothermal-assisted method to synthesize sulfur/carbon composites for high-performance lithium–sulfur batteries†
Received
3rd August 2016
, Accepted 24th August 2016
First published on 25th August 2016
Abstract
Hydrothermal-assisted sulfur impregnation method was first proposed to prepare sulfur/carbon (S/C) composites for lithium–sulfur (Li–S) battery applications. Comparing with the currently existing sulfur impregnation method, this facile one-pot method is proved to be energy-saving and time-saving, to have a sulfur content that is exactly controllable and to be environment-friendly. In the hydrothermal environment, sulfur would selectively diffuse into the pores of carbon hosts due to its high mobility, homogeneous dispersibility, hydrophobicity and carbon affinity. As a result, the S/C composite obtained from hydrothermal-assisted method under a low temperature of 120 °C and a short time of 2 hours exhibits a comparable battery performance to that obtained from the traditional melting method under 155 °C for 20 hours, which reached 1239 mA h g−1 at 0.2C and 796 mA h g−1 at even 1C between 1.85–2.8 V, being rather suitable for large-scale manufacture and commercial development.
Introduction
Lithium–sulfur (Li–S) batteries with a high theoretical capacity (∼1675 mA h g−1) and energy density (∼2500 W h kg−1) are widely considered as one of the most promising candidates for next-generation rechargeable batteries.1–4 Additionally, choosing sulfur as the active material benefits from the advantages of its high natural abundance, nontoxicity and low cost as well.5 However, the commercialization of Li–S batteries has been seriously hindered by several issues, such as rapid capacity fading, low coulombic efficiency and low active material utilization. These problems are mainly attributed to (i) poor electrical conductivity of sulfur and the discharge product of lithium sulfide; (ii) the “shuttle effect” caused by polysulfides (Li2Sn, 4 ≤ n ≤ 8) dissolved in ether-based electrolyte; (iii) large volumetric expansion (∼80%) of cyclo-S8 upon lithiation.2,6
In order to solve these issues, considerable efforts have been made with carbon materials due to its superior electronic conductivity and structural diversity, such as mesoporous carbon,7–10 microporous carbon,11,12 graphene,13–15 carbon nanofibers,16–19 and carbon nanotubes.20–24 Pursuing for superior electrochemical performance, sulfur should be dispersed uniformly on the surface of porous carbon hosts, with sulfur particles as small as possible. The currently existing sulfur impregnation methods can be classified into two main categories: heat treatment and chemical in situ syntheses. The heat treatment can be further divided into two types: sulfur melting diffusion method (under inert atmosphere or in vacuum)9,19,25,26 and sulfur vaporizing method.6,11 In this process, the molten or vaporized sulfur can diffuse into the pores and form homogenous distribution, assuring sulfur contacts well with the carbon hosts, which results in high active material utilization and capacity output. However, a high energy-consumption and long-period process of heating the mixture at 155 °C (the melting sulfur has lowest viscosity) for 10–24 h is inevitable. Not only that, due to the volatility of sulfur and the fluidity of carrier-gas, a small amount of sulfur would escape from the carbon hosts, leading to the difficulty of exactly controlling the S/C ratio. The chemical in situ synthesis method starts from mixing the carbon matrix with a sulfur-based solution (e.g. Na2S and Na2SO3 solution) and then precipitates sulfur into carbon substrate through the chemical reaction.27–30 Rao et al. used Na2S solution method to precipitate sulfur into porous carbon host according to the following reaction:
Sx2− + 2H+ → (x − 1)S↓ + H2S↑ |
which can obtain high sulfur utilization of above 70 wt% but unfortunately produce a plenty of toxic byproduct H
2S.
29 The Na
2SO
3 solution method proposed by Su
et al. can be much safer without H
2S released:
Na2S2O3 + 2HCl → 2NaCl + SO2↑ + H2O + S↓ |
However, generated SO2 is one of the main pollutants in the atmosphere and consume 50% sulfur of reactant, further causing environment pollution and waste of material.31 Therefore, developing an energy-saving, time-saving, sulfur content exactly controllable and environment-friendly sulfur impregnation method is of great importance, especially for meeting the demand of large-scale commercial application.
As well known in the mining industry, the sulfur stored in the earth's crust could be extracted via well-drilling and thermo-melting technology.32 After injecting pressurized hot water and compressed air into ground, the sulfur would melt and be lifted up, as shown in Fig. 1a. Given this, an interesting idea comes out: is it possible to impregnate sulfur into carbon hosts with a similar pressure and hot water circumstance? If possible, the S/C composite preparation process would be effectively accelerated, ascribed to the following advantages: (i) higher vapor pressure is beneficial to attain molten sulfur with low viscosity at lower temperature; (ii) hydrophobic sulfur is prone to diffuse into the hydrophobic pores of carbon hosts in aqueous environment. These advantages promote sulfur to diffuse into the pores of carbon hosts rapidly and selectively, realizing an energy-saving and time-saving process to prepare the high-performance S/C composite. Besides that, the sulfur content in S/C composite could be exactly controlled due to no sulfur loss from the airtight autoclave.
 |
| Fig. 1 Principle of the (a) sulfur mining by thermo-melting technology and (b) sulfur impregnation by hydrothermal-assisted method. | |
In this manuscript, the as proposed S/C composite preparation process (named as hydrothermal-assisted method) is comparatively studied with both traditional melting-impregnation method and grinding method. Given the large scale commercial application, Ketjen Black 600 (KB for short) with high specific surface and large pore volume was chosen as the host for sulfur impregnation. As expected, even at the condition of such low temperature (120 °C) and short time (2 hours), the S/C composite prepared via this method show the comparable electrochemical performance and much less sulfur loss to melting method (155 °C for 20 hours). It demonstrated that the hydrothermal-assisted method is a valid and feasible strategy to achieve efficient sulfur impregnation for high-performance lithium–sulfur battery, with advantages of low energy consumption, short period and exact sulfur content control.
Experimental
Materials preparation
Grinding method. 0.7 g commercial sulfur (Aldrich) and 0.3 g KB was poured in the agate mortar to fully grind and the mixture was named as G-S@C.
Melting method. Transfer 1 g G-S@C composites into a combustion boat, then heated at 155 °C for 20 hours under argon atmosphere. The obtained product was named as M-S@C.
Hydrothermal-assisted method. Disperse 1 g G-S@C composites in 50 mL of deionized (DI) water under stirring. After the composite was fully infiltrated, transfer the suspension into a 100 mL Teflon autoclave and heated at 120 °C for 2 hours. As the reactor was cooled down to room temperature, the product was removed, washed with DI water and dried at 70 °C, which was labeled as H-S@C. Different conditions of sulfur content (60 wt%, 80 wt%), reaction temperature (140 °C, 160 °C, 180 °C) and reaction time (1 h, 4 h, 12 h, 24 h) were also investigated to obtain the optimal performance.
Materials characterization
The morphology and elements (carbon, oxygen and sulfur) distribution of materials was characterized by scanning electron microscope (SEM, JSM-7800F) and scanning transmission electron microscope (STEM, TECNAI G2 (TF20)) equipped with an Energy Dispersive X-ray Spectroscopy (EDS). Brunauer–Emmett–Teller surface area analyzer (BET, ASPS 2020) were employed for detail pore structure studies. X-ray diffraction (XRD, DX-2700) operated at 40 kV and 30 mA with Cu-Kα radiation (λ = 0.154 nm) and the XRD dates were collected from 10° to 70° in 2θ at a scanning rate of 1.2° min−1. The sulfur content of S/C composites was determined by thermal gravimetric analysis (TGA, Pyris diamond TG/DSC) in nitrogen atmosphere at a scan rate of 5 °C min−1 from 50 °C to 500 °C.
Electrochemical characterization
The cathode for Li–S batteries was prepared by mixing 80 wt% as-synthesized S/C composites, 10 wt% carbon black (Super P), and 10 wt% polyvinylidene difluoride (PVDF) dissolved in N-methyl-2-pyrrolidone (NMP) to form a slurry, and then pasted it on aluminium foil and dried at 60 °C for 12 hours under vacuum. The sulfur mass loading was about 1.0 mg cm−2. The cathode and the anode (lithium foil) is separated by a celgard 2325 membrane and 1 M bis(trifluoromethylsulfonyl)imide (LiTFSI) in 1,2-dimethoxymethane (DME)/1,3-dioxolane (DOL) (1
:
1 v/v) with 5 wt% LiNO3 was used as electrolyte. The coin cells 2016 (CR2016) were assembled in an argon-filled glove box for further electrochemical measurement. The galvanostatic charge–discharge test was carried out using a LAND CT-2001A system with voltages arrange from 1.85 V to 2.8 V at 25 °C. Cyclic voltammetry measurements also were carried out on the coin cell at a scan rate of 0.1 mV s−1 by using a CHI611E electrochemical workstation. The electrochemical impedance spectroscopy (EIS) measurement was conducted using a Solartron Impedance Analyzer (SI 1260 + SI 1287) from 3 MHz to 0.1 Hz with amplitude of 10 mV at the open-circuit voltage of the cells. All capacity values were calculated on the basis of sulfur mass. The voltage mentioned in this article was respected to Li+/Li (vs. Li+/Li).
Results and discussion
Properties of S/C composites
In the process of the H-S@C composite preparation, mixture of KB and sulfur was dispersed in DI water and then heated at 120 °C for 2 hours within a Teflon autoclave. The schematic illustration was shown in Fig. S1.† After that, sulfur would melt and disperse in water to form S/H2O emulsion. Due to the low viscosity of emulsion and the high affinity between hydrophobic carbon and hydrophobic sulfur, the sulfur could be impregnated quickly into pores of KB, presenting similar process with thermo-melting sulfur mining technology, as shown in Fig. 1. Judging from the SEM images, there is no obvious bulk particles on the H-S@C (Fig. 2c) and M-S@C composite (Fig. 2b) when compared to G-S@C composite (Fig. 2a), which illustrates sulfur has uniformly dispersed on the KB host after hydrothermal or melting treatment. The TEM and STEM images of the H-S@C composite (Fig. 2d and e) strongly verify its accumulated spherical morphology, which is consistent with the SEM images. In order to further investigate the sulfur distribution on the KB host for H-S@C composite, the EDX spectrogram and corresponding elemental mappings of carbon, sulfur, and oxygen is displayed in Fig. 2f and g, respectively. It is clear that uniform sulfur distribution is exhibited on the carbon matrix and the oxygen is derived from the oxygen-containing functional groups of KB.
 |
| Fig. 2 SEM images of (a) G-S@C, (b) M-S@C and (c) H-S@C composite. (d) TEM images, (e) STEM images and (f) EDX of the H-S@C composite. (g) Elemental mapping of carbon, sulfur and oxygen. | |
The specific surface area and pore structure of KB, M-S@C and H-S@C was analyzed via Brunauer–Emmett–Teller (BET) method. As shown in Fig. 3a, the absorption–desorption isotherm of KB shows a significant hysteresis loop at medium relatively pressure range of 0.5–0.9, indicating the existence of abundant meso-pores on KB host. The hysteresis loop at high relatively pressure more than 0.9 illustrates the existence of macro-pores, which mainly attributed to the stacking of KB particles.30 The detail of pore distribution based on Barrett–Joyner–Halenda (BJH) method is exhibited in Fig. 3b. The pore size distribution of porous KB is mainly focus on the range between 2 to 20 nm. Moreover, the high specific surface (1350 m2 g−1) and large pore volume (2.61 cm3 g−1) of KB endow its ability to accommodate more than 70 wt% sulfur (detailed calculation process was shown in ESI†). After sulfur impregnation, the specific surface area of M-S@C and H-S@C composite sharply decrease to 53 m2 g−1 and 48 m2 g−1, and the total pore volume of these samples also significantly reduce to 0.59 cm3 g−1 and 0.51 cm3 g−1 (Table 1). Besides, nearly all of the meso-pores vanish and only partial macro-pores are remained for accommodating volume expansion and electrolyte infiltration, demonstrating that sulfur can be successfully impregnated into the meso-pores of the carbon host.
 |
| Fig. 3 (a) Nitrogen adsorption–desorption isotherms and (b) pore size distribution curves of KB, M-S@C and H-S@C composites. (c) TGA curves of the M-S@C and H-S@C composites. (d) XRD patterns of pristine S, G-S@C, M-S@C and H-S@C composites. | |
Table 1 Physical characteristics of KB, M-S@C and H-S@C composites
Parameters |
Sample |
KB |
M-S@C |
H-S@C |
BET surface area (m2 g−1) |
1350 |
53 |
48 |
Total pore volume (cm3 g−1) |
2.61 |
0.59 |
0.51 |
Pore volume, 2–20 nm (cm3 g−1) |
1.38 |
0.04 |
0.03 |
Pore volume, >20 nm (cm3 g−1) |
1.23 |
0.55 |
0.48 |
While investigating the sulfur content differences of S/C composites between melting and hydrothermal treatment, it can be seen from Fig. 3c that much higher sulfur content of H-S@C composite (70 wt%) is obtained than that of M-S@C composite (66 wt%), which attributed to the airtight environment and no chemical reaction between sulfur and KB. Higher sulfur content can lead to higher pore-filling ratio, so lower specific surface area and total pore volume of H-S@C composite are obtained than that of M-S@C composite, as mentioned before. Almost no sulfur loss existed in hydrothermal-assisted sulfur impregnating process, which is beneficial to exactly control the sulfur content of S/C composite and save material for commercial application. As zero emission of harmful product has been achieved, this method exhibits tremendous advantage with respect to environmental protection.
X-ray diffraction (XRD) patterns of pristine bulk sulfur powder, G-S@C, M-S@C, and H-S@C composite are presented in Fig. 3d. For the G-S@C composite, the XRD pattern exhibits strong characteristic peaks of sulfur before heating treatment, demonstrating plenty of bulk crystalline sulfur was exposed on the surface of KB. After sulfur impregnation by melting or hydrothermal-assisted method, the characteristic peaks of sulfur were nearly disappeared, illustrating that most of sulfur was impregnated into porous carbon matrix. Extremely weak sulfur peaks of H-S@C composite in the XRD pattern indicated that trace amount sulfur were exposed outside of carbon pores due to the higher sulfur content. However, combined with SEM image and elemental mappings, we can deduce that the superficial sulfur was dispersed uniformly on surface of carbon.
Electrochemical performance of S/C composites
The electrochemical performance of as-prepared G-S@C, M-S@C and H-S@C electrodes were investigated by assembled CR2016 coin cells and lithium foil as counter electrode. Fig. 4a presents the cyclic voltammetry curves of the electrodes in the voltage range of 1.85–2.8 V at a sweep rate of 0.1 mV s−1. During the cathodic scan, the cell assembled with H-S@C electrode showed two reduction peaks at around 2.25 and 1.95 V (vs. Li+/Li), corresponding to the reduction of elemental S to lithium polysulfide (Li2Sn, 4 ≤ n < 8) and further to Li2S2/Li2S, respectively. The anodic peaks around 2.35 and 2.45 V (vs. Li+/Li) are assigned to reverse oxidation of Li2S2/Li2S to final product sulfur.33 It is not hard to see that the peak potential difference of the cell assembled with H-S@C electrode is slightly larger than M-S@C electrode but much smaller than that of G-S@C electrode, presenting a significantly improvement of reversibility after hydrothermal treatment, which can be owed to the uniformity of sulfur distribution in porous KB. In addition, the peak current of M-S@C electrode and H-S@C electrode is also much larger than G-S@C electrode, suggesting high sulfur utilization, which is beneficial to capacity output during charge–discharge process. The CV results reveal that the S/C composite shows serious polarization and difficult electrochemical reaction without heat treatment, which can be effectively suppressed by hydrothermal-assisted method and melting method.
 |
| Fig. 4 (a) Cyclic voltammograms of the G-S@C, M-S@C and H-S@C electrodes between 1.85 and 2.8 V at a potential sweep rate of 0.1 mV s−1. (b) EIS plots of the G-S@C, M-S@C and H-S@C electrodes before cycling. Inset is the used equivalent circuit. | |
To further study the polarization of different sulfur cathodes, the EIS measurement was used to obtain the resistance of the cells assembled with G-S@C, M-S@C and H-S@C electrodes. As shown in Fig. 4b, the Nyquist plots for all of three samples consisted of a semicircle in the high-frequency region, which mainly influenced by the charge-transfer resistance (Rct), and a short line in the low-frequency region, representing Warburg impedance. An equivalent circuit model (insert of Fig. 4b) was chosen to quantitatively analyze the impedance and the detailed information was displayed in Table 2 (the corresponding fitted curves were shown in Fig. S2†).
Table 2 Impedance values of the G-S@C, M-S@C and H-S@C electrodes
Parameters |
Sample |
G-S@C |
M-S@C |
H-S@C |
Re (Ω cm−2) |
2.95 |
1.86 |
2.75 |
Rct (Ω cm−2) |
43.76 |
33.82 |
33.19 |
The Rct can reflect the resistance of the electrochemical reaction at the boundary of electrode–electrolyte, and the data of Li–S cell assembled with H-S@C electrode is 33.19 Ω cm−2, which was closed to that of M-S@C (33.82 Ω cm−2) but much smaller than G-S@C (43.76 Ω cm−2). Compared with G-S@C sample, the lower Rct of H-S@C represents higher electrochemical reaction rate and lower polarization, which can be attributed to the uniform distribution of sulfur and large contact area between sulfur and the host, leading to higher utilization of active material.
Battery performance of lithium–sulfur cells
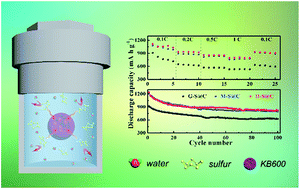
The cycling performance of the lithium–sulfur cells assembled with these three kinds of S/C composites was further test by galvanostatic charge–discharge at 0.2C. The initial discharge capacity of H–S@C battery was 1239 mA h g−1, which was comparable to M-S@C battery (1229 mA h g−1) and much higher than G-S@C battery (918 mA h g−1), as shown in Fig. 5a. The sulfur utilization of H-S@C, M-S@C and G-S@C samples were 74, 73 and 55% (calculated based on the theoretical specific capacity of 1675 mA h g−1), respectively. With respect to H-S@C electrode, the high electrochemical activity can be owed to the uniform distribution of sulfur in porous KB and good contact between active materials and carbon. In contrast, for G-S@C electrode, the larger particle size and heterogeneous distribution of sulfur will retard the electron transport between activity material and conductive matrix, further leading to low electrochemical activity. In that way, unlike such low capacity of 625 mA h g−1 was reserved for G-S@C composite after 100 cycles, the discharge capacity of H-S@C electrode can be stable at 825 mA h g−1, exhibiting comparable cyclic stability to M-S@C electrode, which has already achieved the state-of-the-art performance of Li–S batteries (Table S1†). The C-rate performance of these three electrodes was also investigated with various C-rates from 0.1C to 1C, as displayed in Fig. 5b. The polarization of electrochemical reaction on the electrode could be aggravated with the increasing C-rate, leading to the gradually decreased trend of capacity output. When the C-rate was increased to 1C, a reversible capacity of 796 mA h g−1 was still achieved for H-S@C electrode, which is similar to that of M-S@C electrode, but much higher than G-S@C electrode.
 |
| Fig. 5 Cell performance of the G-S@C, M-S@C and H-S@C electrodes at the voltage range of 1.85–2.8 V. (a) Cycling performance at 0.2C. (b) C-rate performance at various C-rate from 0.1C to 1C. | |
The above results demonstrated that good cyclic stability and C-rate performance can be acquired with H-S@C electrode, and then various operating conditions of hydrothermal-assisted method were sequentially explored, such as sulfur content, temperature and time. The cyclic performance of the H-S@C electrodes with different sulfur content (e.g. 60 wt%, 70 wt% and 80 wt%) was shown in Fig. 6a. The hydrothermal treatment was operated at temperature of 180 °C for 24 hours to make sure that the sulfur can diffuse into pores of KB completely. After 100 cycles of galvanostatic charge–discharge at 0.2C, the cells assembled with H-S@C electrodes of 60 wt% and 70 wt% sulfur content exhibited lower capacity degradation than that of 80 wt%. Based on the previous calculation of theoretical sulfur content (73.6 wt%), we can deduce that the pore volume of KB is not large enough to accommodate 80 wt% sulfur. During charge/discharge process, the volumetric expansion of overloaded activity material will lead to the collapse of KB's pore structure and fail to immobilize polysulfides, resulting in irreversible capacity decay and poor cycling stability. To meet the high-energy-density requirement of Li–S battery, the higher sulfur content of 70 wt% was selected as an optimal proportion of S/C composite.
 |
| Fig. 6 Cyclic performance of the H-S@C electrodes at 0.2C and the voltage range of 1.85–2.8 V with different (a) sulfur content, (b) reaction temperature and (c) reaction time (d) 1st-cycle discharge curves corresponding to (c). | |
Taking the critical condition and safety of hydrothermal process into consideration, the operating temperature was controlled in the range of 120–180 °C to investigate the influence of temperature on cycling stability. Optimized 70 wt% sulfur content was applied and reaction time was 24 hours. As shown in Fig. 6b, during 100 cycles at 0.2C, no significant differences on active materials utilization or cyclic stability was appeared among the H-S@C electrodes with hydrothermal temperature of 120 °C, 140 °C, 160 °C and 180 °C, respectively. Hence, we can deduce that sulfur has already been successfully impregnated into pores of KB at 120 °C and higher temperature wasn't essential for this hydrothermal assisted process. Negligible effect of operating temperature on the battery performance makes hydrothermal-assisted more suitable for large-scale manufacture of S/C composite.
Fig. 6c displayed the cyclic performance of H-S@C electrodes with reaction time of 1, 2, 4, 12 and 24 hours. During hydrothermal process, Optimized 70 wt% sulfur content was applied and reaction temperature was 120 °C. After 100 cycles at 0.2C, negligible difference was shown on cyclic stability when hydrothermal treatment time was more than 2 hours, however relatively lower capacity was remained when hydrothermal treatment operated for only 1 hour.
Combined with the corresponding first-cycle discharge curve shown in Fig. 6d, the H-S@C electrodes with 1 hour hydrothermal treatment presented a lower discharge capacity at high-voltage platform and seriously polarization at low-voltage platform. The lower utilization of active material can be attributed to the poor electrochemical reaction activity of sulfur for its uneven distribution or incomplete penetration into pores of KB.
All in all, the hydrothermal-assisted method not only ensured a uniform sulfur distribution, but also possessed fast e−/Li+ transfer, inducing good cycling stability and rate capability. Optimal cyclic performance was obtained under the conditions of 70 wt% sulfur content, temperature at 120 °C and time for 2 hours. Besides that, for many kind of carbon materials can be synthesized by hydrothermal method,34,35 this kind of sulfur impregnation method can be used to achieve one-pot synthesis and modification of S/C composite.
Conclusions
Here, we have reported a new hydrothermal-assisted method, which was energy-saving, time-saving and S content exactly controllable, to synthesis S/C composite for large-scale manufacture and commercial development of Li–S batteries. Beneficial from the airtight high-pressure environment and high affinity between hydrophobic carbon and hydrophobic sulfur, the H-S@C composite can achieve the uniform sulfur distribution and good sulfur confinement in KB's pores, leading to significantly improvement on cell performance. Even treating with such lower temperature (120 °C) for shorter time (2 h), the as-synthesized H-S@C electrode can expected to exhibit comparable cyclic performance to M-S@C electrode (155 °C for 20 h). The initial discharge capacity of the H-S@C electrode was 1239 mA h g−1 at 0.2C, with 825 mA h g−1 remained after 100 cycles. What's more, the capacity also can reach to 796 mA h g−1 when the C-rate increased to 1C. This research work is believed to put forward the development of Li–S batteries, especially for promoting its commercialization process.
Acknowledgements
The authors acknowledge financial support from National Natural Science Foundation of China (No. 51403209, 21406221, 51177156/E0712), Youth Innovation Promotion Association (2015148), 100 Talents Program of Dalian Institute of Chemical Physics, Natural Sciences Foundation of Liaoning Province of China (2013020126), Hubei Province-Chinese Academy of Sciences Cooperative Project.
Notes and references
- S. Xin, L. Gu, N. H. Zhao, Y. X. Yin, L. J. Zhou, Y. G. Guo and L. J. Wan, J. Am. Chem. Soc., 2012, 134, 18510–18513 CrossRef CAS PubMed.
- J. Jiang, J. Zhu, W. Ai, X. Wang, Y. Wang, C. Zou, W. Huang and T. Yu, Nat. Commun., 2015, 6, 8622–8630 CrossRef CAS PubMed.
- M. Armand and J.-M. Tarascon, Nature, 2008, 451, 652–657 CrossRef CAS PubMed.
- P. G. Bruce, S. A. Freunberger, L. J. Hardwick and J. M. Tarascon, Nat. Mater., 2012, 11, 19–29 CrossRef CAS PubMed.
- R. Elazari, G. Salitra, A. Garsuch, A. Panchenko and D. Aurbach, Adv. Mater., 2011, 23, 5641–5644 CrossRef CAS PubMed.
- N. Jayaprakash, J. Shen, S. S. Moganty, A. Corona and L. A. Archer, Angew. Chem., Int. Ed., 2011, 50, 5904–5908 CrossRef CAS PubMed.
- Z. Gong, Q. Wu, F. Wang, X. Li, X. Fan, H. Yang and Z. Luo, RSC Adv., 2016, 6, 37443–37451 RSC.
- D. Li, F. Han, S. Wang, F. Cheng, Q. Sun and W. C. Li, ACS Appl. Mater. Interfaces, 2013, 5, 2208–2213 CAS.
- X. Li, Y. Cao, W. Qi, L. V. Saraf, J. Xiao, Z. Nie, J. Mietek, J.-G. Zhang, B. Schwenzer and J. Liu, J. Mater. Chem., 2011, 21, 16603–16610 RSC.
- X. Liang, Z. Wen, Y. Liu, H. Zhang, L. Huang and J. Jin, J. Power Sources, 2011, 196, 3655–3658 CrossRef CAS.
- N.-W. Li, Y.-X. Yin and Y.-G. Guo, RSC Adv., 2016, 6, 617–622 RSC.
- B. Zhang, X. Qin, G. R. Li and X. P. Gao, Energy Environ. Sci., 2010, 3, 1531–1537 CAS.
- H. Wang, Y. Yang, Y. Liang, J. T. Robinson, Y. Li, A. Jackson, Y. Cui and H. Dai, Nano Lett., 2011, 11, 2644–2647 CrossRef CAS PubMed.
- J.-Z. Wang, L. Lu, M. Choucair, J. A. Stride, X. Xu and H.-K. Liu, J. Power Sources, 2011, 196, 7030–7034 CrossRef CAS.
- J. Zhang, N. Yang, X. Yang, S. Li, J. Yao and Y. Cai, J. Alloys Compd., 2015, 650, 604–609 CrossRef CAS.
- X. Yang, W. Zhu, G. Cao and X. Zhao, RSC Adv., 2016, 6, 7159–7171 RSC.
- S. Lu, Y. Cheng, X. Wu and J. Liu, Nano Lett., 2013, 13, 2485–2489 CrossRef CAS PubMed.
- L. Zeng, Y. Jiang, J. Xu, M. Wang, W. Li and Y. Yu, Nanoscale, 2015, 7, 10940–10949 RSC.
- G. Zheng, Y. Yang, J. J. Cha, S. S. Hong and Y. Cui, Nano Lett., 2011, 11, 4462–4467 CrossRef CAS PubMed.
- J. H. Kim, K. Fu, J. Choi, S. Sun, J. Kim, L. Hu and U. Paik, Chem. Commun., 2015, 51, 13682–13685 RSC.
- W. Kong, L. Sun, Y. Wu, K. Jiang, Q. Li, J. Wang and S. Fan, Carbon, 2016, 96, 1053–1059 CrossRef CAS.
- S. Niu, W. Lv, C. Zhang, Y. Shi, J. Zhao, B. Li, Q.-H. Yang and F. Kang, J. Power Sources, 2015, 295, 182–189 CrossRef CAS.
- Y. S. Su and A. Manthiram, Chem. Commun., 2012, 48, 8817–8819 RSC.
- Y. Zhao, W. Wu, J. Li, Z. Xu and L. Guan, Adv. Mater., 2014, 26, 5113–5118 CrossRef CAS PubMed.
- X. Ji, K. T. Lee and L. F. Nazar, Nat. Mater., 2009, 8, 500–506 CrossRef CAS PubMed.
- L. Ji, M. Rao, H. Zheng, L. Zhang, Y. Li, W. Duan, J. Guo, E. J. Cairns and Y. Zhang, J. Am. Chem. Soc., 2011, 133, 18522–18525 CrossRef CAS PubMed.
- C. Wang, J.-J. Chen, Y.-N. Shi, M.-S. Zheng and Q.-F. Dong, Electrochim. Acta, 2010, 55, 7010–7015 CrossRef CAS.
- S.-H. Chung and A. Manthiram, J. Mater. Chem. A, 2013, 1, 9590–9596 CAS.
- M. Rao, X. Song and E. J. Cairns, J. Power Sources, 2012, 205, 474–478 CrossRef CAS.
- L. Ji, M. Rao, S. Aloni, L. Wang, E. J. Cairns and Y. Zhang, Energy Environ. Sci., 2011, 4, 5053–5059 CAS.
- Y.-S. Su and A. Manthiram, Electrochim. Acta, 2012, 77, 272–278 CrossRef CAS.
- S. Luo, Explor. Eng., 1985, 2, 6–8 Search PubMed.
- J. Ma, Z. Fang, Y. Yan, Z. Yang, L. Gu, Y.-S. Hu, H. Li, Z. Wang and X. Huang, Adv. Energy Mater., 2015, 5(16) DOI:10.1002/aenm.201500046.
- L. Yu, N. Brun, K. Sakaushi, J. Eckert and M. M. Titirici, Carbon, 2013, 61, 245–253 CrossRef CAS.
- N. Brun, K. Sakaushi, L. Yu, L. Giebeler, J. Eckert and M. M. Titirici, Phys. Chem. Chem. Phys., 2013, 15, 6080–6087 RSC.
Footnote |
† Electronic supplementary information (ESI) available. See DOI: 10.1039/c6ra19613f |
|
This journal is © The Royal Society of Chemistry 2016 |
Click here to see how this site uses Cookies. View our privacy policy here.