Application of a tandem air-agitated liquid–liquid microextraction technique based on solidification of floating organic droplets as an efficient extraction method for determination of cholesterol-lowering drugs in complicated matrices

Somayeh Arghavani-Beydokhti, Alireza Asghari*, Mohammad Bazregar and Maryam Rajabi
Department of Chemistry, Semnan University, Semnan 2333383-193, Iran. E-mail: aasghari@semnan.ac.ir; Fax: +98-231-33654110; Tel: +98-23-33383193

Received 1st August 2016 , Accepted 10th September 2016

First published on 12th September 2016


Abstract

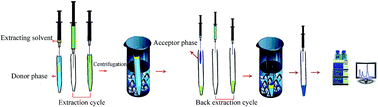
A simple and sensitive extraction method termed tandem air-agitated liquid–liquid microextraction based on solidification of floating organic droplets (TAALLME-SFO) is introduced. Based on this method, the three cholesterol-lowering drugs rosuvastatin, atorvastatin, and gemfibrozil, as the model analytes, were first extracted from a relatively large volume (10 mL) of an acidic donor phase into a small volume (105 μL) of an intermediate phase (a solidifiable organic solvent), and were then simply back-extracted into a smaller volume of a basic acceptor phase (55 μL) by micro-air-agitated liquid–liquid microextraction based on solidification of floating organic droplets (μ-AALLME-SFO). By performing this convenient extraction method, a high sample clean-up was obtained. The response surface methodology (RSM) combined with the desirability function (DF) was applied to the optimization of the effective parameters involved to reach the maximum extraction efficiency of the drugs. The pH values of the donor and acceptor phases and the volumes of the organic solvent (μL) and acceptor phase (μL) were obtained to be 3.0, 12, 105, and 55, respectively. Under the optimal experimental conditions, the TAALLME-SFO-HPLC-UV method provided good linearity for all the target analytes in the range of 2–3000 ng mL−1 with coefficients of determination (R2) ≥ 0.995, and the intra-day and inter-day precisions varied in the ranges of 4.2–5.3 and 5.7–6.6, respectively. The limits of detection (LODs) were in the range of 0.5–1.0 ng mL−1. Consequently, this new microextraction technique was demonstrated to be suitable for the extraction and determination of the studied drugs in human plasma and wastewater samples.


1 Introduction

In the last few years, miniaturized, efficient, and environmentally friendly liquid extraction techniques used in sample preparation have witnessed incessant growth.1,2 Liquid-phase microextraction (LPME),3,4 as a novel miniaturized sample pretreatment method, can be accomplished by a membrane-protected solvent (including a hollow-fiber-protected two-phase microextraction and a hollow-fiber-protected three-phase microextraction)5 and an exposed solvent (including the single-drop microextraction (SDME)4 and dispersive liquid–liquid microextraction (DLLME)6 modes). Despite the advantages of the HF-LPME and SDME methods, the serious problems of HF-LPME are that the extraction process in this method is time-consuming, and the preparation of the hollow-fiber in it is expensive.7 The disadvantages of the SDME method are the instability of the micro-drop and easy falling of the drop from the micro-syringe needle during the stirring process.8 Dispersive liquid–liquid microextraction (DLLME) is an attractive liquid-phase microextraction method.9,10 It is a commonplace sample pretreatment technique that is regarded as consilient with the current trends of modern analytical chemistry.11–14 In the last few years, special attention has been paid to the DLLME method due to its advantages such as high rapidity, simplicity of operation, requirement of a low volume of the organic solvent, and high enrichment factor.13,15–17 Nevertheless, a criticism to this technique comes from the use of chlorinated solvents, which are toxic and dangerous to the environment and human health.17 Application of solvents lighter than water solves the above problem. However, the main disadvantage of this approach is the difficulty to collect the small microdrops floating on the sample solution.18 In order to overcome these disadvantages, a novel DLLME method based on the solidification of floating organic droplets (DLLME-SFO) has been introduced by Khalili-Zanjani et al.19,20 The main properties of the extraction solvent used in this method include its low density and its melting point being near the room temperature (in the range of 10–30 °C), which facilitate the formation of a solid layer on top of the aqueous sample at moderate temperatures, and subsequently, leads to its easy collection after centrifugation.1 On the other hand, one of the most important problems with the DLLME method is its low sample clean-up, which comes from co-extraction of the interferences concurrent with extraction of the target analytes due to the high surface area created within formation of a cloudy solution. Recently, our group has resolved the problem of lack of sample clean-up by a simple idea through presenting an efficient sample preparation method, namely tandem dispersive liquid–liquid microextraction.21,22 Thus by using a simple back-extraction step, the conditions for increasing the sample clean-up is provided. However, a disadvantage of this work is the use of chlorinated solvents.

For solving this problem, in this work, tandem air-agitated liquid–liquid microextraction based on solidification of floating organic droplets was presented as an efficient method with advantages such as lower solvent toxicity, higher sample clean-up, and easier operation for the extraction of the some cholesterol-lowering drugs from the human plasma and wastewater samples.

Rosuvastatin and atorvastatin belong to the statin class of drugs. Statins cause reduction in the low-density lipoproteins, cholesterol, and triglycerides. These drugs are also used to treat hypercholesterolemia in patients suffering from cardiovascular or atherosclerosis diseases.23,24 Gemfibrozil is a benzene derivative of valeric acid, and belongs to a drug group known as fibrates used for the treatment of hyperlipidemia, reduction of serum triglycerides and cholesterol, and lowering the incidence of coronary heart disease in humans.14,25 The characteristics of these drugs are listed in ESI material Table S1. Due to the serious side-effects for these drugs, great attention was paid to the development of sample preparation methods for the efficient determination of these cholesterol-lowering drugs.

2 Experimental

2.1 Reagents and standards

Rosuvastatin, atorvastatin, and gemfibrozil were obtained from Arasto Drug Company (Tehran, Iran). HPLC-grade methanol, acetonitrile, and water were purchased from Ameretat Shimi (Tehran, Iran). 1-Octanol, 1-hexanol, toluene, n-heptane, n-hexane, 1-undecanol, and 1-dodecanol with the highest analytical reagent grade were supplied from Merck (Darmstadt, Germany, http://www.merck.de). Sodium hydroxide (>99.0%), concentrated hydrochloric acid (37%) and phosphoric acid (85%) were supplied from Merck. Individual stock standard solutions of atorvastatin, rosuvastatin, and gemfibrozil at a concentration of 1000 mg L−1 were prepared by dissolving a proper amount of each drug in HPLC-grade methanol, and stored at 4 °C in a refrigerator under light protection until analysis. The working standard mixture solutions were prepared daily by appropriate dilutions of the stock solutions with deionized water. All the glassware used in this work were kept at least overnight in 10% (v/v) nitric acid solution, and subsequently, rinsed with deionized water before use. All the other reagents used were of analytical reagent grade, and were obtained from Merck.

2.2 Instrumentation and conditions

A Knauer HPLC instrument (Berlin, Germany) consisting of a K-1001 HPLC pump for mobile-phase delivery, a K-2600 UV detector set at 230 nm, a D-14163 degasser, and a Rheodyne 7725i injector (IDEX Corporation, Rohnert Park, CA, USA) fitted with a 20 μL injection loop was used for the analysis and separation. The separation was performed on an ODS III column (250 × 4.6 mm i.d., 5 μm particle diameter), obtained from MZ Analysen technik (Mainz, Germany). Chromate HPLC software, version 3.3, was used for data acquisition and processing. An isocratic elution system consisting of acetonitrile (61%, v/v) and 0.05 M phosphate buffer (pH 3) (39%, v/v) was used as the mobile phase. The total run time was within 14.0 min. The chromatographies were carried out at a flow rate of 1.0 mL min−1. In the present work, the absorption measurements were performed at 230 nm, a wavelength very close to the absorption maximum of the three drugs. The pH value for the sample solution was adjusted using a PHS-3BW model pH-meter (Bell, Italy) supplied with a combined glass electrode. A Shimadzu UV-1650 PC spectrophotometer (Kyoto, Japan) was used for the absorbance measurements. A Hettich centrifuge, model EBA20 (Tuttlingen, Germany) with a rotor radius of 50 mm was used for accelerating phase separation in the TAALLME-SFO process. The experimental design and data analysis steps were performed using the Stat-Ease Design-Expert trial, version 7.0.3, software.

2.3 Initial sample pretreatment

Drug-free human plasma was obtained from Iranian Blood Transfusion Organization (Semnan, Iran). It was poured into polypropylene micro-tubes, which were stored in a freezer at −20 °C. Before use, it was thawed at room temperature, and then filtered to eliminate the impurities. The spiked plasma samples were prepared as follow. 0.5 mL of the plasma was spiked by mixed standard solutions of the target analytes. Then in order to remove the protein binding of the drug and minimize the matrix effects in plasma, 1.5 mL of acetonitrile was added, followed by hand-shaking. The mixed solution was centrifuged for 10 min at 5000 rpm. The supernatant solution was filtrated through a 0.45 μm filter paper, transferred into a 10 mL volumetric flask, and diluted to the mark with deionized water. The pH value for the final solution was adjusted to 3, and the solution was used according to the proposed extraction procedure under the optimized experimental conditions.

The wastewater sample was collected from a pharmaceutical manufacturing factory in polyethylene bottles, and applied without further dilution. This sample was then centrifuged for 5 min at 5000 rpm to settle the solid and insoluble contaminants. The solution pH was then adjusted to 3, and then 10 mL of it was applied for the proposed extraction procedure under the optimized experimental conditions.

2.4 Sample preparation procedure

The extraction procedure was performed in two separate steps. In the first step, 10 mL of the sample solution was adjusted to pH 3.0 using a phosphate buffer (0.05 M), transferred into a 15.0 mL glass centrifuge tube, and subsequently, 105 μL of the organic solvent 1-undecanol was added to the sample solution using a 100 μL syringe. Then the mixture was repeatedly sucked from the tube and injected into it using a 10 mL glass syringe for 10 times. A cloudy solution consisting of the very fine droplets of 1-undecanol dispersed in the water sample was created, which caused to accelerate the transfer of analytes into fine droplets. After centrifuging for 3 min at 5000 rpm, the organic solvent floating on top of the test tube was solidified by cooling in an ice bath for 3 min. Then the solid layer floating on the solution surface was carefully collected using a spatula, transferred into another glass centrifuge tube, and melted immediately at room temperature. 55 μL of the aqueous extracting solution (pH 12) was added to the intermediate phase obtained from the previous step, and then the emulsification process was carried out through a pre-determined number of suction/injection cycles (ten times) using a 100 μL Hamilton syringe. Then the glass tube was transferred into a beaker containing ice pieces (for 1 min). Finally, 20 μL of the bottom aqueous phase was carefully withdrawn using a micro-syringe, and directly injected into the injection port of HPLC.

3 Results and discussion

In order to reach the optimal values for the method, the central composite design (CCD) was applied for modeling and subsequent optimization of the four variables affecting TAALLME-SFO of the target analytes. The effective variables accompanied by expansion of their values in five levels are presented in Table 1. A five-level CCD was chosen to investigate the simultaneous effects of the four significant factors affecting the extraction efficiency of the method: pH value for the donor phase (X1), volume of the organic solvent (X2), pH value for the acceptor phase (X3), and volume of the acceptor phase (X4).
Table 1 Experimental ranges and levels of four independent variables in CCD
Factors Level Star point α
Low Central High α +α
pH of donor phase (X1) 2.75 3.5 4.25 2 5
Volume of organic solvent (μL) (X2) 90 100 110 80 120
pH of acceptor phase (X3) 10.75 11.5 12.25 10 13
Volume of acceptor phase (μL) (X4) 37.5 50 62.5 25 75


A separate investigation on the type of organic solvent used can give the optimal organic extracting solvent as well as the simplicity of the experimental design method. Therefore, this parameter was separately optimized at first. The results obtained showed that 1-undecanol provided the best efficiency as the organic extracting solvent (Fig. 1). Furthermore, the initial experiments showed that by increasing the number of air-agitation cycles, the analytical signals increased up to 10 and then remained constant. Also these experiments confirmed that salt addition had a negative effect on the extraction efficiencies. Therefore, this factor was not taken into account in the experimental design.


image file: c6ra19414a-f1.tif
Fig. 1 Effect of organic solvent on extraction efficiency. Conditions: sample solution, 10.0 mL of 100 ng mL−1 of the three cholesterol-lowering drugs in deionized water (pH 3.0); acceptor volume, 50 μL (pH 13.0); volume of each organic solvent, 100 μL. Error bars were obtained based on three replicates.

3.1 Central composite design

The central composite design (CCD) consists of a two-level full-factorial or factorial design accompanied with a set of star experimental points located at a distance, α, from its center and several experimental center points. This design is mainly rotatable and orthogonal. Rotatability and orthogonality depend on the accurate determination of the α value and the number of center points in order to fit effective quadratic polynomials. CCD graphically illustrates the relationships between the parameters and responses by fitting an empirical second-order polynomial equation using the least squares method, which can be expressed as follows:
image file: c6ra19414a-t1.tif
where Y is the predicted response, Xi and Xj represent the studied factors in the coded forms of the input variables, β0 is the value of the fitted response at the center point of design, and βi and βij are the linear and quadratic interaction terms, respectively. The total number of experiments in CCD can be calculated via this expression: N = 2f + 2f + C, where 2f and 2f are related to the factorial and axial points, respectively; f is the number of independent variables; and C refers to the replicate measurement at the center point to get a good estimation of the experimental error. In order to estimate the best conditions for the extraction with four variables affecting this method, 30 experiments (24 + 2 × 4 + 6) were designed. The peak areas obtained for rosuvastatin (R1), atorvastatin (R2), and gemfibrozil (R3) after their preconcentration and determination through the TAALLME-SFO-HPLC-UV method are summarized in ESI material Table S2. Based on the data analysis, three quadratic models for peak areas of acidic drugs were represented as the experimental response in terms of coded format of the studied factors by the following equations:

Rosuvastatin:

Y = −18[thin space (1/6-em)]792[thin space (1/6-em)]543.4 + 73[thin space (1/6-em)]955.9X1 + 74[thin space (1/6-em)]195.2X2 + 2[thin space (1/6-em)]437[thin space (1/6-em)]269.07X3 + 30[thin space (1/6-em)]635.26X4 + 1707.85X1X2 + 23[thin space (1/6-em)]055.9X1X3 − 1106.34X1X4 − 748.09X2X3 − 144.98X2X4 − 730.38X3X4 − 66[thin space (1/6-em)]080.037X12 − 309.72X22 − 99[thin space (1/6-em)]818.9X32 − 56.72X42.

Atorvastatin:

Y = −12[thin space (1/6-em)]865[thin space (1/6-em)]150.47 + 1108.48X1 + 124[thin space (1/6-em)]651X2 + 1[thin space (1/6-em)]110[thin space (1/6-em)]819.8X3 + 21[thin space (1/6-em)]997.02X4 − 2426.94X1X2 + 72[thin space (1/6-em)]463.4X1X3 − 378.8X1X4 + 1114.59X2X3 + 67.53X2X4 + 496.76X3X4 − 92[thin space (1/6-em)]574.98X12 − 672.98X22 − 62[thin space (1/6-em)]020.09X32 − 322.06X42.

Gemfibrozil:

Y = −7[thin space (1/6-em)]127[thin space (1/6-em)]993.35 + 1[thin space (1/6-em)]301[thin space (1/6-em)]284.5X1 + 59[thin space (1/6-em)]252.7X2 + 385[thin space (1/6-em)]871.7X3 − 26[thin space (1/6-em)]252.04X4 + 2177.19X1X2 − 56[thin space (1/6-em)]692.1X1X3 + 1981.04X1X4 + 1577.4X2X3 + 133.38X2X4 + 2966.55X3X4 − 141[thin space (1/6-em)]824.79X12 − 449.5X22 − 16[thin space (1/6-em)]641.68X32 − 270.6X42.

In order to determine the significance and adequacy of these fitted models, the analysis of variance (ANOVA) was performed. The basis of this analysis is Ftest that is expressed as the proportion of the model variance to the residual variance, and the P-value that indicates the statistical significance of the factors involved and their interactions. A P-value less than 0.05 in the ANOVA table indicates the statistical significance of an effect at the 95% confidence level. The lack-of-fit P-value should be higher than 0.05 and insignificant. This means that the quadratic models obtained are statistically satisfactory. According to Table S3 (ESI material), the P-value for the model and the lack-of-fit were found to be lower than 0.05 and higher than 0.05, respectively. The quality of the fitted polynomial models was studied by the determination coefficients R2 and adjusted R2. According to Table S3, the R2 (adjusted R2) values for the three analytes were 0.99 (0.98), 0.99 (0.98), and 0.98 (0.97), respectively. A high R2 coefficient value, and close to the adjusted R2 value ensures a satisfactory adjustment of the quadratic models to the experimental data. These results completely match with Fig. S1 (ESI material). In other words, the location of the points on the line with a 45 degree angle indicates a negligible difference between the experimental and predicted responses, re-confirming the high reliability of the obtained models.

3.2 Interaction effects through response surface curves

The response surface plots depicted the effects of the variables involved, and their double interactions on the analyte extraction efficiencies as the other independent variables were held constant at their center points. Fig. 2(a)–(f) demonstrate the quality of the relation between the extraction efficiency and the experimental levels of the two significant factors involved in the concurrent preconcentration of the three cholesterol-lowering drugs via the TAALLME-SFO procedure. The semi-curvatures of these plots indicate the interactions between the factors involved. With respect to the P-values related to the double interactions, the sets of effects (AB, AC, AD, BC, BD, and CD), (AB, AC, BC, and BD), and (AB, AC, AD, BC, BD, and CD) were significant in the simultaneous extraction of rosuvastatin, atorvastatin, and gemfibrozil, respectively. Fig. 2(a) and (b) show the interaction effect of the organic solvent volume × the pH value for the acceptor phase (BC) and the pH value for the acceptor phase × the acceptor phase volume (CD) on the extraction of rosuvastatin, respectively. As shown in Fig. 2(a), at first, by the concurrent increment of the values for the organic solvent volume and the pH value for the acceptor phase, extraction of the target analytes was improved, then this positive increasing trend was lowered, and finally, it turned approximately constant.
image file: c6ra19414a-f2.tif
Fig. 2 3D surface plots of peak areas for rosuvastatin, atorvastatin, and gemfibrozil vs. pH value for donor or acceptor phase with volume of organic phase or acceptor phase.

The volume of the extraction solvent (intermediate phase) has a crucial effect on both steps of the TAALLME-SFO method. It affects the equilibrium and transfer rate of the analytes between the phases. Increasing the volume of the extraction solvent increases the amount of the extracted analyte for all chemicals, although it must be noted that by increasing the amount of the extracted analyte, the volume of the acceptor phase is increased as well, and the enrichment factor (EF) is decreased. For the effective extraction of acidic compounds, the acceptor phase medium must be alkaline, so as to shift the acid–base equilibrium toward the formation of the ionic forms of the drugs; this promotes their back-extraction from the organic phase to the acceptor phase. With respect to Fig. 2(a), it can be found that the variation in the pH value for the acceptor phase is more effective toward the volume of the extraction organic solvent in the promotion of the drug extraction efficiencies. As one may note in Fig. 2(b), the increase in the pH value for the acceptor phase has a more serious effect than the increment of the volume of the acceptor phase in the extraction of rosuvastatin. The influence of the pH value for the acceptor phase was fully discussed in the previous part. Also an increase in the volume of the acceptor phase has a positive effect on the extraction efficiencies. Fig. 2(c) and (d) are related to the interaction effect of the donor phase pH × the organic solvent volume (AB) and the donor phase pH × the acceptor phase pH (AC) onto the extraction of atorvastatin drug, respectively. As shown in Fig. 2(c), at first, by reducing and increasing the pH values for the donor phase and organic solvent volume, respectively, the extraction efficiency of atorvastatin increases but in higher values of the above variables, the extraction efficiency of the target drug reduces significantly. The effect of the organic solvent volume was mentioned in the passage above. The pH gradient of the donor phase, as a major driving force, plays an important role in the accomplishment of the extraction efficiencies of the drugs. For an effective extraction of acidic compounds, the pH value for the donor phase should be sufficiently acidified (pH < pKa) to decrease the solubility of the analytes in the donor phase, and consequently, accelerate their transformations (as molecular forms) into the organic phase. The individual influence of the factors involved was mentioned previously. In Fig. 2(d), the maximum extraction efficiency of atorvastatin is shown in higher and lower pH values for the acceptor and donor phases, respectively. Fig. 2(e) and (f) show the interaction effect of the donor phase pH × the acceptor phase volume (AD) and the organic solvent volume × the acceptor phase volume (BD) in the extraction of gemfibrozil, respectively. The effects of these factors and their interactions was discussed earlier.

3.3 Optimization of CCD using DF

Desirability function (DF) is a common and established technique for the concurrent determination of the input variables that can give the optimum performance levels for one or more responses. According to the Design-Expert 7.0.0 software, the optimum values for the four effective factors in the developed TAALLME-SFO method were found to be: initial pH 3.0 for the donor phase, 105 μL of the organic solvent, pH 12 for the acceptor phase, and 55 μL of the acceptor phase; they lead to maximum peak areas for the drugs (520[thin space (1/6-em)]524, 512[thin space (1/6-em)]118, and 424[thin space (1/6-em)]004 for rosuvastatin, atorvastatin, and gemfibrozil, respectively) with the reasonable DF of 0.993. The low difference among the average peak areas for the drugs and the predicted responses implies a precise and accurate determination of the optimum values for the input variables.

4 Method performance

To evaluate the analytical performance of the proposed method, the figures of merit including linear dynamic range (LDR), determination coefficient (R2), repeatability, limit of detection (LOD), and limit of quantification (LOQ) were investigated by utilizing the standard solutions of the target analytes in deionized water under the above-mentioned optimized conditions. As summarized in Table 2, the calibration curves had linear responses in the range of 2–3000 ng mL−1 with the determination coefficient (R2) > 0.995. The limits of detection (LODs, based on S/N = 3) and limits of quantification (LOQs, based on S/N = 10) for this method were found to be within 0.5–1.0 and 2.0–3.0 ng mL−1, respectively. The repeatabilities of the method, expressed as the relative standard deviations (RSDs), were evaluated by analyzing five replicates of the deionized water spiked at a concentration of 25 ng mL−1 in the same day and five different days. As shown in Table 2, the RSDs for all the analytes were between 4.2 and 5.3 for the intra-day precisions and between 5.7 and 6.6 for the inter-day precisions, respectively.
Table 2 Analytical characteristics of TAALLME-SFO method by utilizing standard solutions of target analytes in deionized water spiked at optimum experimental conditions
Analyte LODa LDRb R2c Inter-day (intra-day) precisions RSD% (n = 5)d ERe (%) EFf
a Limit of detection (S/N = 3), (ng mL−1).b Linear dynamic range (ng mL−1).c Coefficient of determinations.d Relative standard deviation (n = 5, C = 25 ng mL−1).e Extraction recovery.f Enrichment factor (C = 25 ng mL−1).
Rosuvastatin 0.5 2–2500 0.996 6.6 (5.3) 71.4 134.2
Atorvastatin 0.8 2.5–3000 0.995 6.1 (4.7) 55.9 105.1
Gemfibrozil 1.0 3–3000 0.997 5.7 (4.2) 63.2 118.8


In separate investigations, the analytical performance of the method was evaluated in the wastewater and plasma samples. The results obtained for the extraction of the analytes from the wastewater samples showed that the figures of merit for the method were close to the results obtained for the deionized water samples. The limits of detection were found to be within 0.5–1.0, RSDs were below 7.2% (n = 5), and EFs were in the range of 106–129. However, the results obtained for the extraction of the analytes from the plasma samples showed that the figures of merit for the method had a significant difference with those obtained for the deionized water samples. In the plasma samples, the limits of detection were found to be within 28–45 ng mL, RSDs were below 11.7% (n = 5), and EFs were in the range of 2.4–3.7.

5 Application of TAALLME-SFO to real samples

In order to demonstrate the accuracy and reliability of the proposed TAALLME-SFO method for the real samples, it was successfully applied to the human plasma and wastewater samples under the optimum experimental conditions. The samples were pretreated, as described in Section 2.3, extracted using the TAALLME-SFO method, and determined by the HPLC-UV method. The results obtained showed that no target analyte contaminants were left in the human plasma and wastewater samples (below the limit of detection). To ensure the absence of matrix effects, the samples were spiked with proper concentrations of the analytes, and the extractions were performed (n = 3) under the optimized experimental conditions. The results obtained demonstrated that the different matrices applied for the wastewater sample had a little effect on TAALLME-SFO followed by HPLC-UV for the extraction and determination of the examined cholesterol-lowering drugs, respectively, while the different matrices applied for the human plasma sample had significant effects on them. All measurements were performed by the standard addition method, and the results obtained were tabulated in Table 3. The satisfactory agreement between the added and measured amounts of the analytes indicated the capability of the method for determination of the model analytes in different samples. Fig. 3 shows the typical HPLC-UV chromatograms for the human plasma sample obtained by extraction of the blank and the solution spiked with the drugs by the proposed method. What was most interesting was the observed cleanliness of the chromatograms, which revealed a good purification capacity provided by the proposed TAALLME-SFO technique.
Table 3 Analysis of real samples under optimal conditions
Sample Rosuvastatin Atorvastatin Gemfibrozil
a Concentration of analytes (ng mL−1).b Not detected.c Spiked concentration (ng mL−1).d Concentration of analytes (ng mL−1) in sample after spiking target analytes.e Relative recovery.
Plasma 1 (plasma 2) Initiala NDb ND ND
Addedc 50.0 (50.0) 50.0 (50.0) 50.0 (50.0)
Foundd 47.2 (48.8) 51.9 (49.2) 50.1 (47.0)
RR%e 94 (98) 104 (98) 100 (94)
RSD% (n = 3) 7.1 (7.8) 5.8 (4.7) 4.4 (8.3)
Wastewater Initial ND ND ND
Added 50.0 50.0 50.0
Found 47.1 51.8 45.1
RR% 94 104 90
RSD% (n = 3) 8.8 6.3 5.5


image file: c6ra19414a-f3.tif
Fig. 3 HPLC chromatogram obtained for (1) non-spiked human plasma sample (2) 250.0 ng mL−1 spiked human plasma sample. (A) Rosuvastatin (B) atorvastatin (C) gemfibrozil.

6 Comparison of TAALLME-SFO with other microextraction techniques

The methods that can be compared with TAALLME-SFO include DLLME and new versions of it, and also the methods that are based upon the combination of DLLME and other methods used for improvement of the sample clean-up. On the other hand, since for the TAALLME-SFO method the three cholesterol-lowering drugs rosuvastatin, atorvastatin, and gemfibrozil were investigated as the model analytes, the methods used for the extraction of these analytes could also be compared with the proposed method. A comparative study of the analytical performance of the proposed methodology and the published analytical methods in terms of limit of detection, relative standard deviation, linear range, enrichment factor, and extraction time for the extraction and determination of the three cholesterol-lowering drugs in real samples was carried out, and the results obtained were tabulated in Table 4. The methods based on the combination of DLLME and other methods such as EME, SFE, SPE, and MIP could be used to develop the sample clean-up. However, these methods are complicated, tedious, and time-consuming. In front of these approaches, in the TAALLME method, a high sample clean-up was achieved by the addition of a back-extraction step to DLLME, and in this method, the acceptor solution was an aqueous solution. This high speed of the sample clean-up step is a valuable advantage of the proposed extraction method. Furthermore, compared with the conventional DLLME methods, the developed TAALLME-SFO method uses low-toxic solvents, and there is no need for an organic dispersive solvent. In terms of the figures of merit including LDR, LOD, EF, and RSD, the proposed method is comparable with the previous works.
Table 4 Comparison of TAALLME-SFO method with other published procedures for determination of rosuvastatin, atorvastatin, and gemfibrozil
Analytical methoda Analyte LOD (ng mL−1) LDR (ng mL−1) ER% EF RSD Time (min) Reference
a Liquid–liquid–liquid microextraction (LLLME), high performance liquid chromatography (HPLC), solidification of floating organic droplets (SFO), magnetic solid phase extraction (MSPE), reversed-phase high performance liquid chromatographic/ultraviolet (RP-HPLC/UV), liquid chromatography-tandem mass spectrometric (LC-MS-MS).b Not reported.
LLLME-HPLC-UV Atorvastatin 0.4 1–500 22.9 187 4.4–7.7 b 26
DLLME-SFO-HPLC Atorvastatin 0.07 0.2–6000 8.4 27
HPLC Gemfibrozil 50 500–75[thin space (1/6-em)]400 80–90 <10 28
MSPE-spectrofluorometry Gemfibrozil 0.003 0.01–5 100 <3 10 14
LLE-RP-HPLC-UV Atorvastatin 1 3–384 0.24–0.35 23
Rosuvastatin 0.6 2–256 0.15–0.43
LC-MS-MS Rosuvastatin 0.52–51.77 79.53 29
TAALLME-SFO-HPLC-UV Rosuvastatin 0.8 2.0–2500 55.9 105.1 4.7 <10 This work
Atorvastatin 0.5 2.5–3000 71.4 134.2 5.3
Gemfibrozil 1.0 3.0–3000 63.2 118.8 4.2


7 Conclusion

In the current work, to overcome the problem of limited selectivity and capability of the DLLME to deal with complex matrices, for the first time, a rapid, efficient, and environmentally-friendly method termed as TAALLME-SFO was introduced. The most interesting aspect of this developed method is the very effective sample clean-up in a short time (less than 10 min), especially in analyzing samples in complex matrices. Also since the proposed extraction method is aqueous-based, it is suitable for the direct injection of the sample in HPLC, which leads to eliminate the need for the evaporation or reconstitution of the extracts into a proper solvent and enhance the lifetime of the chromatographic column. This simple and rapid microextraction method exhibited a unique performance in the sensitive and accurate determination of the three cholesterol-lowering drugs rosuvastatin, atorvastatin, and gemfibrozil with high extraction efficiencies. The results obtained confirmed that by the addition of a simple back-extraction step, an improvement could be obtained in the DLLME applicability in complex matrices, and, for this purpose, there is no need to combine this distinguished method with other complicated and tedious methods. With the proposed extraction method, good linearity, low limits of detection and quantification, satisfactory repeatability, high enrichment factor, and finally, reasonable accuracy were obtained in applying complex matrixes.

Acknowledgements

The authors gratefully acknowledge the financial support of Semnan University.

References

  1. X. You, S. Wang, F. Liu and K. Shi, J. Chromatogr. A, 2013, 1300, 64–69 CrossRef CAS PubMed.
  2. N. B. Lana, P. Berton, A. Covaci, A. G. Atencio, N. F. Ciocco and J. C. Altamirano, J. Chromatogr. A, 2013, 1285, 15–21 CrossRef CAS PubMed.
  3. H. Liu and P. K. Dasgupta, Anal. Chem., 1996, 68, 1817–1821 CrossRef CAS PubMed.
  4. M. A. Jeannot and F. F. Cantwell, Anal. Chem., 1996, 68, 2236–2240 CrossRef CAS PubMed.
  5. S. Pedersen-Bjergaard and K. E. Rasmussen, Anal. Chem., 1999, 71, 2650–2656 CrossRef CAS PubMed.
  6. M. Rezaee, Y. Assadi, M.-R. M. Hosseini, E. Aghaee, F. Ahmadi and S. Berijani, J. Chromatogr. A, 2006, 1116, 1–9 CrossRef CAS PubMed.
  7. K. E. Rasmussen and S. Pedersen-Bjergaard, Trends Anal. Chem., 2004, 23, 1–10 CrossRef CAS.
  8. X. Hou, X. Zheng, C. Zhang, X. Ma, Q. Ling and L. Zhao, J. Chromatogr. B: Anal. Technol. Biomed. Life Sci., 2014, 969, 123–127 CrossRef CAS PubMed.
  9. A. Barfi, H. Nazem, I. Saeidi, M. Peyrovi, M. Afsharzadeh, B. Barfi and H. Salavati, J. Pharm. Biomed. Anal., 2016, 121, 123–134 CrossRef CAS PubMed.
  10. Z. Taherimaslak, M. Amoli-Diva, M. Allahyari, K. Pourghazi and M. H. Manafi, RSC Adv., 2015, 5, 12747–12754 RSC.
  11. H. Yan and H. Wang, J. Chromatogr. A, 2013, 1295, 1–15 CrossRef CAS PubMed.
  12. M. Rajabi, M. Bazregar, A. Daneshfar and A. Asghari, J. Sep. Sci., 2015, 38, 2496–2502 CrossRef CAS PubMed.
  13. F. Aydin, E. Yilmaz and M. Soylak, RSC Adv., 2015, 5, 40422–40428 RSC.
  14. N. Ullah, M. Tuzen and T. G. Kazi, RSC Adv., 2016, 6, 28767–28773 RSC.
  15. J. Martín, J. L. Santos, I. Aparicio and E. Alonso, Talanta, 2015, 143, 335–343 CrossRef PubMed.
  16. P. Fernández, V. Taboada, M. Regenjo, L. Morales, I. Alvarez, A. Carro and R. Lorenzo, J. Pharm. Biomed. Anal., 2016, 124, 189–197 CrossRef PubMed.
  17. L. E. Vera-Avila, T. Rojo-Portillo, R. Covarrubias-Herrera and A. Peña-Alvarez, Anal. Chim. Acta, 2013, 805, 60–69 CrossRef CAS PubMed.
  18. T. Ahmadi-Jouibari, N. Fattahi and M. Shamsipur, J. Pharm. Biomed. Anal., 2014, 94, 145–151 CrossRef CAS PubMed.
  19. M. R. Khalili-Zanjani, Y. Yamini, N. Yazdanfar and S. Shariati, Anal. Chim. Acta, 2008, 606, 202–208 CrossRef CAS PubMed.
  20. M. R. K. Zanjani, Y. Yamini, S. Shariati and J. Å. Jönsson, Anal. Chim. Acta, 2007, 585, 286–293 CrossRef PubMed.
  21. M. Bazregar, M. Rajabi, Y. Yamini, Z. Saffarzadeh and A. Asghari, J. Chromatogr. A, 2016, 1429, 13–21 CrossRef CAS PubMed.
  22. M. Bazregar, M. Rajabi, Y. Yamini, A. Asghari and M. Hemmati, Anal. Chim. Acta, 2016, 917, 44–52 CrossRef CAS PubMed.
  23. Y. Shah, Z. Iqbal, L. Ahmad, A. Khan, M. I. Khan, S. Nazir and F. Nasir, J. Chromatogr. B: Anal. Technol. Biomed. Life Sci., 2011, 879, 557–563 CrossRef CAS PubMed.
  24. L. Novakova, D. Šatínský and P. Solich, Trends Anal. Chem., 2008, 27, 352–367 CrossRef CAS.
  25. J. A. Ardila, G. G. Oliveira, R. A. Medeiros and O. Fatibello-Filho, J. Electroanal. Chem., 2013, 690, 32–37 CrossRef CAS.
  26. H. Farahani, P. Norouzi, A. Beheshti, H. R. Sobhi, R. Dinarvand and M. R. Ganjali, Talanta, 2009, 80, 1001–1006 CrossRef CAS PubMed.
  27. S. Taheri, F. Jalali, N. Fattahi and G. Bahrami, J. Sep. Sci., 2015, 38, 309–315 CrossRef CAS PubMed.
  28. X. Kang, F. Wang, Z. Xie and H. Li, J. Chromatogr. B: Anal. Technol. Biomed. Life Sci., 2009, 877, 645–648 CrossRef CAS PubMed.
  29. A. Narapusetti, S. S. Bethanabhatla, A. Sockalingam, N. Repaka and V. Saritha, J. Adv. Res., 2015, 6, 931–940 CrossRef CAS PubMed.

Footnote

Electronic supplementary information (ESI) available. See DOI: 10.1039/c6ra19414a

This journal is © The Royal Society of Chemistry 2016
Click here to see how this site uses Cookies. View our privacy policy here.