 Open Access Article
Creative Commons Attribution 3.0 Unported Licence
The oleanolic acid derivative, 3-O-succinyl-28-O-benzyl oleanolate, induces apoptosis in B16–F10 melanoma cells via the mitochondrial apoptotic pathway
Fernando J.
Reyes-Zurita
*a,
Marta
Medina-O'Donnell
b,
Rosa M.
Ferrer-Martin
c,
Eva E.
Rufino-Palomares
a,
Samuel
Martin-Fonseca
b,
Francisco
Rivas
b,
Antonio
Martínez
b,
Andrés
García-Granados
b,
Amalia
Pérez-Jiménez
a,
Leticia
García-Salguero
a,
Juan
Peragón
d,
Khalida
Mokhtari
ae,
Pedro P.
Medina
af,
Andrés
Parra
*b and
José A.
Lupiáñez
*a
aDepartment of Biochemistry and Molecular Biology I, Faculty of Science, University of Granada, 18071 Granada, Spain. E-mail: ferjes@ugr.es; jlcara@ugr.es; Fax: +34 958 249945; Tel: +34 958 243252 Tel: +34 958 243089
bDepartment of Organic Chemistry, Faculty of Science, University of Granada, 18071 Granada, Spain. E-mail: aparra@ugr.es; Fax: +34 958 240480; Tel: +34 958 240480
cDepartment of Cellular Biology, Faculty of Science, University of Granada, 18071 Granada, Spain
dDepartment of Experimental Biology, Biochemistry and Molecular Biology Section, University of Jaen, 23071 Jaen, Spain
eDepartment of Biology, Faculty of Sciences, Mohammed I University, BP 717 60000 Oujda, Morocco
fCentre of Genomic and Oncologic Investigation (GENyO), Pfizer Pharmaceutical-University of Granada-Government of Andalusia, Technological Park of Health Sciences, 18016 Granada, Spain
First published on 19th September 2016
Abstract
Oleanolic acid (1) is a pentacyclic triterpene present in olive pomace, which is known to induce apoptosis and to have anti-tumor properties; however, high concentrations of this product are necessary to produce cytotoxic effects. The 3-O-succinyl-28-O-benzyl oleanolate derivative (4) presents greater cytotoxicity and apoptosis effects than its natural precursor, oleanolic acid, or its benzyl derivative (2). This study examines the response of B16–F10 melanoma cells to treatment with compound 4, in comparison to 1 and 3. Our studies show that treatment with 4 results in a significant inhibition of cell proliferation in a dose-dependent manner and causes apoptotic cell death. At concentrations inhibiting cell growth by 50% and 80%, compound 4 induces strong G0/G1 cell-cycle arrest, around 72–95% apoptosis, and mitochondrial disturbances confirmed by FACS analysis, which probably involve the activation of the intrinsic apoptotic route. Morphological changes including cell shrinkage, chromatin condensation, and loss of nuclear architecture were also observed. In this report, we demonstrated for the first time that in melanoma cancer cells, compound 4 exerts a significant anti-proliferation effect by inducing the apoptotic process with mitochondrial depolarization. These findings support the role of compound 4 as a new, potential therapeutic tool against aberrant cell proliferation in melanoma.
1. Introduction
Triterpenoid compounds are present in a wide range of plants that are used in traditional medicine, and are known to have anti-tumor properties.1–8 They are also involved in metabolic regulation,5,9–14 metabolic syndrome treatment15 and growth processes.16–22 All these compounds belong to a broad family of compounds obtained by cyclic reactions of 2,3-oxidosqualene.23 Triterpenoids in plants, are secondary metabolites that are not essential for growth or development, but might contribute to their survival (e.g. phytoalexin), and are involved in the protection of plants against pathogens or pests.24 Currently, about one-fourth of all medications contain an active ingredient derived from plants. The most important triterpenoid structures are oleanane, ursane, lupane and dammarane.25Oleanolic acid (1), an oleanane-type triterpenoid, is a natural compound that belongs to the pentacyclic triterpene family and is widely distributed in the plant kingdom. Oleanolic compounds for the current study were isolated in high amounts from the olive-pressing residues. Oleanolic acid (1) possesses many biological properties, including anti-inflammatory, anti-HIV and cytotoxic activities.26 This compound (1) has also been described as an inhibitor of skin tumor progression.26 This natural compound (1) provides a very useful scaffold for obtaining derivatives with improved biological properties.27–29 Our research group has performed a series of systematic chemical modifications of 1 to improve its biological activities.30,31
Most pentacyclic triterpenes are not sufficiently water soluble, which hampers biological tests, and results in their low bioavailability.32–34 One option to improve the solubility of these triterpene compounds is to semi-synthesize derivatives by attaching diverse functional groups to the hydroxyl groups of the A ring and/or to the carboxyl group at C-28. Our group has demonstrated that acyl oleanolic acid derivatives with a polar dicarboxylic fragment as the acyl group on C-3 present major cytotoxic and apoptotic effects, compared to their precursor (1).30,31,35 Chemical modifications of natural triterpenoid compounds have resulted in products that have improved biological activities, compared to their natural precursors. Our group has shown that several triterpene derivatives, with mono- or di-peptidyl groups at C-28, and acyl groups at C-2 or C-2/C-3 of the triterpene skeleton, exhibit cytotoxic properties on B16–F10, HT29, or Hep G2 cancer cell lines.30
Apoptosis, or programmed cell death, is defined as an active physiological process of cell self-destruction. Agents that suppress the proliferation of malignant cells by inducing apoptosis may be useful in both the chemoprevention and chemotherapy of cancer. Two major pathways have been described during apoptotic activation: the mitochondrial or intrinsic pathway, and the death-receptor or extrinsic pathway.
The intrinsic pathway involves mitochondrial disruption and a decrease in the mitochondrial membrane potential.35,36 This apoptotic route involves the mitochondria-dependent activation of initiator caspases, which in turn activate downstream executive caspases, such as caspase-3. Our research group has demonstrated that the oleanane-type triterpenoid, maslinic acid, selectively induces anti-tumor and pro-apoptotic effects in HT29 colon cancer cells.1 The activation of the intrinsic apoptotic pathway is mediated by mitochondrial Bax activation and Bcl-2 inhibition, resulting in the mitochondrial membrane disruption, increase of ROS, activation of caspase-9, caspase-3 and caspase-7.2,3 Maslinic acid induces differentiation in this cell line before the activation of the apoptotic process.1,2
The extrinsic death-receptor pathway is triggered by the death ligand through the formation of the death-inducing signaling complex that results in caspase-8 and caspase-10 activation, which initiates the downstream apoptotic signaling.32,37,38 Maslinic acid also produces the direct activation of apoptosis through an extrinsic apoptotic pathway in Caco-2 colon cancer cells, involving caspase-8 activation, bid cleavage, caspase-9 and caspase-3 activation, with a lower cell-cycle arrest;5 caspase-9 and ROS generation were not observed.8
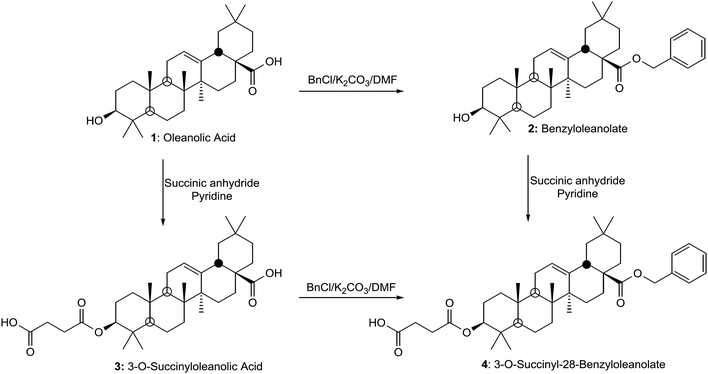
The evaluation of mitochondrial potential at the cytotoxic and apoptotic concentrations can help to determine the possible molecular mechanism involved in the apoptotic response.31 We describe here the anti-cancer effects of three oleanolic acid derivatives. In order to increase the apoptotic activity of these products, compound 1 was benzylated to obtain the 28-benzyl derivative (2) and the 3-succinyl-28-benzyl derivative (4) (Fig. 1).
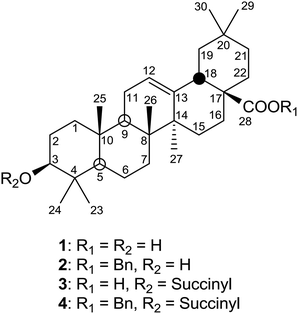 | ||
| Fig. 1 Structures of the triterpene skeleton of oleanolic acid (1) and its derivatives: 28-O-benzyl oleanolate (2), 3-O-succinyl oleanolic acid (3), and 3-O-succinyl-28-O-benzyl oleanolic acid (4). | ||
Following treatment with 4, a potent apoptotic and anti-proliferation effect in melanoma B16–F10 cancer cells, including cell-cycle arrest in the G0 phase with the disappearance of S phase, was observed. The compound 4 also produced over 90% of apoptosis induction through mitochondrial disturbances, with clear morphological changes in the nucleus and the cytoplasm. On the other hand, compound 2 produced 40% of apoptosis induction, similar to the natural triterpene, without affecting the mitochondrial membrane potential.
Agents that suppress the proliferation of malignant cells by inducing apoptosis could be useful in cancer therapy. Consequently, compound 4 may provide a useful new therapeutic strategy for skin melanoma.
2. Experimental section
2.1. Apparatus and materials
The purity of the compounds was determined by a Waters Acquity UPLC system (ultra-performance liquid chromatography) coupled with a Waters Synapt G2 HRMS spectrometer (high-resolution mass spectra) with ESI (electrospray ionization). The purities of all compounds were confirmed to be ≥95%. Measurements of NMR spectra (300.13 MHz 1H and 75.47 MHz 13C) were made in CDCl3 (which also provided the lock signal) using a VARIAN Inova unity (300 MHz 1H NMR). The 13C chemical shifts were assigned with the aid of distortionless enhancement by polarization transfer (DEPT) using a flip angle of 135°. IR spectra were recorded on a MATTSON SATELLITE FTIR spectrometer. Optical rotations were measured on a Perkin-Elmer 241 polarimeter at 25 °C. Melting points (mp) were determined using a Kofler (Reichter) apparatus and were uncorrected.All reaction solvents and chromatography solvents were distilled prior to use. Commercially available reagents were used without further purification. Merck silica-gel 60 aluminium sheets (ref. 1.16835) were used for TLC, and spots were rendered visible by spraying with H2SO4–AcOH, followed by heating to 120 °C, and were also visualized under UV at 254 nm. Merck silica-gel 60 (0.040–0.063 mm, ref. 1.09385) was used for flash chromatography. CH2Cl2 (Fisher, ref. D/1852/17), CHCl3 (Fisher, ref. C/4960/17), or n-hexane (Merck, ref. 1.04374), with increasing amounts of acetone (Fisher, ref. A/0600/17), MeOH (Fisher, ref. M/4000/17), or EtOAc (Fisher, ref. E/0900/17), were used as eluents (all the solvents were of analytical reagent-grade purity).
The plant material, a specimen of the plant of Olea europaea (order Lamiales, family Oleaceae) was collected in Almegíjar, Granada, Spain in May 2001. This plant was identified by Laura Baena from the herbarium of the University of Granada. A voucher specimen (53489-1-1) was deposited at the University of Granada Herbarium, Granada, Spain.
2.2. Synthesis and characterization of 3-O-succinyl-28-O-benzyl oleanolate and its intermediates (1–4)
![[thin space (1/6-em)]](https://www.rsc.org/images/entities/char_2009.gif) :
:![[thin space (1/6-em)]](https://www.rsc.org/images/entities/char_2009.gif) 1 ratio to a solution of 1 (912 mg, 2 mmol) in DMF (8 mL) with K2CO3 (0.61 g). The reaction was stirred for 4 h at 55 °C. The mixture was diluted with water and extracted with CH2Cl2, and the organic layer was dried with anhydrous Na2SO4. The solvent was removed under reduced pressure, and the residue was purified by column chromatography using CH2Cl2/acetone (10
1 ratio to a solution of 1 (912 mg, 2 mmol) in DMF (8 mL) with K2CO3 (0.61 g). The reaction was stirred for 4 h at 55 °C. The mixture was diluted with water and extracted with CH2Cl2, and the organic layer was dried with anhydrous Na2SO4. The solvent was removed under reduced pressure, and the residue was purified by column chromatography using CH2Cl2/acetone (10![[thin space (1/6-em)]](https://www.rsc.org/images/entities/char_2009.gif) :
:![[thin space (1/6-em)]](https://www.rsc.org/images/entities/char_2009.gif) 1) to give 2 as a white solid (710 mg, 83%) (Scheme 1),41 with mp 221–223 °C; [α]D +64 (c 1, CHCl3
1) to give 2 as a white solid (710 mg, 83%) (Scheme 1),41 with mp 221–223 °C; [α]D +64 (c 1, CHCl3![[thin space (1/6-em)]](https://www.rsc.org/images/entities/char_2009.gif) :
:![[thin space (1/6-em)]](https://www.rsc.org/images/entities/char_2009.gif) MeOH, 2
MeOH, 2![[thin space (1/6-em)]](https://www.rsc.org/images/entities/char_2009.gif) :
:![[thin space (1/6-em)]](https://www.rsc.org/images/entities/char_2009.gif) 1); IR νmax (KBr)/cm−1: 3371, 2940, 2891, 1668. This compound has a molecular mass of 561 amu and in its 1H NMR spectrum, in addition to the above mentioned signals, at 7.48 ppm (m, 5H) it presents the signal of the aromatic protons and at 5.00 ppm (2H, AB system, J = 12.0 Hz) it presents the signal of the methylene benzyl group. Moreover, the more significant signals of compound 2 in its 13C NMR spectrum are shown at 177.6 ppm (C-28, this signal is shielded from 184.5 ppm for OA as a consequence of the benzyl ester formation), 136.7 ppm (a quaternary carbon of the benzyl group), around 128.0 ppm (five methane carbons of the benzyl group) and 66.1 ppm (methylene group of the benzyl group).
1); IR νmax (KBr)/cm−1: 3371, 2940, 2891, 1668. This compound has a molecular mass of 561 amu and in its 1H NMR spectrum, in addition to the above mentioned signals, at 7.48 ppm (m, 5H) it presents the signal of the aromatic protons and at 5.00 ppm (2H, AB system, J = 12.0 Hz) it presents the signal of the methylene benzyl group. Moreover, the more significant signals of compound 2 in its 13C NMR spectrum are shown at 177.6 ppm (C-28, this signal is shielded from 184.5 ppm for OA as a consequence of the benzyl ester formation), 136.7 ppm (a quaternary carbon of the benzyl group), around 128.0 ppm (five methane carbons of the benzyl group) and 66.1 ppm (methylene group of the benzyl group).
![[thin space (1/6-em)]](https://www.rsc.org/images/entities/char_2009.gif) :
:![[thin space (1/6-em)]](https://www.rsc.org/images/entities/char_2009.gif) 1) to give 3 as a white solid (90%) (Scheme 1),42 with mp 190–192 °C; [α]D +49 (c 1 in CHCl3
1) to give 3 as a white solid (90%) (Scheme 1),42 with mp 190–192 °C; [α]D +49 (c 1 in CHCl3![[thin space (1/6-em)]](https://www.rsc.org/images/entities/char_2009.gif) :
:![[thin space (1/6-em)]](https://www.rsc.org/images/entities/char_2009.gif) MeOH, 2
MeOH, 2![[thin space (1/6-em)]](https://www.rsc.org/images/entities/char_2009.gif) :
:![[thin space (1/6-em)]](https://www.rsc.org/images/entities/char_2009.gif) 1); IR νmax (KBr)/cm−1: 3394, 3018, 2854 and 1712. This compound has a molecular mass of 565 amu. The main spectroscopic difference between the succinylated compound (3) and the corresponding substrate (1) was the deshielding of the signal of the H-3 geminal proton because of the presence of the succinyl group on C-3; in this sense, this signal was situated at δH 3.19 for (1) and δH 4.51 for (3). Moreover, in the 13C NMR spectrum of 3, the four signals of the four carbons of the succinyl group appear at δH 178.6 and 171.8, due to free carboxylic group and carboxylate group, and δH 29.6 and 29.4, corresponding to the two methylene groups. The other signals in this spectrum of this compound remain practically unaltered.
1); IR νmax (KBr)/cm−1: 3394, 3018, 2854 and 1712. This compound has a molecular mass of 565 amu. The main spectroscopic difference between the succinylated compound (3) and the corresponding substrate (1) was the deshielding of the signal of the H-3 geminal proton because of the presence of the succinyl group on C-3; in this sense, this signal was situated at δH 3.19 for (1) and δH 4.51 for (3). Moreover, in the 13C NMR spectrum of 3, the four signals of the four carbons of the succinyl group appear at δH 178.6 and 171.8, due to free carboxylic group and carboxylate group, and δH 29.6 and 29.4, corresponding to the two methylene groups. The other signals in this spectrum of this compound remain practically unaltered.
![[thin space (1/6-em)]](https://www.rsc.org/images/entities/char_2009.gif) :
:![[thin space (1/6-em)]](https://www.rsc.org/images/entities/char_2009.gif) 1 ratio to a solution of 3-O-succinyl oleanolic acid (3, 556 mg, 1 mmol) in DMF (4 mL) with K2CO3 (0.30 g). The reaction was stirred for 4 h at 55 °C. The mixture was diluted with water and extracted with CH2Cl2, and the organic layer was dried with anhydrous Na2SO4. The solvent was removed under reduced pressure, and the residue was purified by column chromatography, using CH2Cl2/acetone (10
1 ratio to a solution of 3-O-succinyl oleanolic acid (3, 556 mg, 1 mmol) in DMF (4 mL) with K2CO3 (0.30 g). The reaction was stirred for 4 h at 55 °C. The mixture was diluted with water and extracted with CH2Cl2, and the organic layer was dried with anhydrous Na2SO4. The solvent was removed under reduced pressure, and the residue was purified by column chromatography, using CH2Cl2/acetone (10![[thin space (1/6-em)]](https://www.rsc.org/images/entities/char_2009.gif) :
:![[thin space (1/6-em)]](https://www.rsc.org/images/entities/char_2009.gif) 1) to give 4 (Scheme 1) as a colourless oil, [α]D +38 (c 1 in CHCl3
1) to give 4 (Scheme 1) as a colourless oil, [α]D +38 (c 1 in CHCl3![[thin space (1/6-em)]](https://www.rsc.org/images/entities/char_2009.gif) :
:![[thin space (1/6-em)]](https://www.rsc.org/images/entities/char_2009.gif) MeOH, 2
MeOH, 2![[thin space (1/6-em)]](https://www.rsc.org/images/entities/char_2009.gif) :
:![[thin space (1/6-em)]](https://www.rsc.org/images/entities/char_2009.gif) 1); IR νmax (film)/cm−1: 3377, 3020, 2859 and 1720. This compound (4) has a molecular mass of 670 amu and presented the above mentioned NMR spectroscopic characteristics when both functional groups of the molecule were modified as a succinyl derivative at C-3 (deshielding of H-3 from 3.19 ppm to 4.48 ppm, due to the esterification the hydroxyl group at this position) and as a benzyl ester at C-28 (appearance of the methylene group signal at 5.05 ppm and a multiplet signal at 7.31 ppm). On the other hand, all the carbons of the two new functional groups at C-3 and C-28 appear adequately in its 13C NMR spectrum. This bifunctional compound (4) was also obtained by succinylation of 28-benzyl oleanolate (2). Succinic anhydride (73 mg, 0.732 mmol) was slowly added to a solution of 2 (100 mg, 0.183 mmol) in pyridine (2 mL). The mixture was treated as described above for the succinylation of 1 and thus, compound 4 was again formed.31
1); IR νmax (film)/cm−1: 3377, 3020, 2859 and 1720. This compound (4) has a molecular mass of 670 amu and presented the above mentioned NMR spectroscopic characteristics when both functional groups of the molecule were modified as a succinyl derivative at C-3 (deshielding of H-3 from 3.19 ppm to 4.48 ppm, due to the esterification the hydroxyl group at this position) and as a benzyl ester at C-28 (appearance of the methylene group signal at 5.05 ppm and a multiplet signal at 7.31 ppm). On the other hand, all the carbons of the two new functional groups at C-3 and C-28 appear adequately in its 13C NMR spectrum. This bifunctional compound (4) was also obtained by succinylation of 28-benzyl oleanolate (2). Succinic anhydride (73 mg, 0.732 mmol) was slowly added to a solution of 2 (100 mg, 0.183 mmol) in pyridine (2 mL). The mixture was treated as described above for the succinylation of 1 and thus, compound 4 was again formed.31
2.3. Anti-cancer test on skin melanoma cancer cells
The different compounds used in cell treatment (1, 2, 3, and 4) (Fig. 1) were dissolved before use at 10 mg mL−1 in 50% DMSO and 50% PBS. The stock solution was frozen and stored at −20 °C. Prior to the experiments, this solution was diluted with cell-culture medium. Apoptosis, cell-cycle, mitochondrial-membrane potential and Hoescht-staining were measured at the IC50 and IC80 concentrations (concentrations causing 50% and 80% reduction in growth). All the experiments were compared to the controls after 72 h of treatment.![[thin space (1/6-em)]](https://www.rsc.org/images/entities/char_2009.gif) 000 units per mL of penicillin and 10 mg mL−1 of streptomycin, and incubated at 37 °C in an atmosphere of 5% CO2, and 95% humidity. Sub-confluent monolayer cells were used in all experiments.
000 units per mL of penicillin and 10 mg mL−1 of streptomycin, and incubated at 37 °C in an atmosphere of 5% CO2, and 95% humidity. Sub-confluent monolayer cells were used in all experiments.
The cell line was provided by the cell bank of the University of Granada, Spain. B16–F10 cells were derived from a melanoma from the skin of a C57BL/6 strain mouse, and are adherent cells with fibroblast-like appearance, capable of producing melanin, and forming metastatic tumor nodules in the lung upon injecting mice.43 The clone F10 of B16 cells are susceptible to lysis mediated by syngeneic lymphocytes.44
The effect of the treatment with products 1, 2, 3, and 4 on the proliferation of B16–F10 melanoma cells was measured using the MTT assay (Sigma, MO, USA), which is based on the ability of live cells to cleave the tetrazolium ring, thus producing formazan, which absorbs at 570 nm. Cell viability was determined by measuring the absorbance of the MTT dye staining of living cells. For this assay, 11 × 103 B16–F10 cells were grown in a 96-well plate and incubated with the different derivatives (0–80 μg mL−1). After 72 h, 100 mL of MTT solution (0.5 mg mL−1) were added to each well. After 2 h of incubation, the cells were washed twice with PBS, and formazan was resuspended in 100 μL DMSO.
Relative cell viability, with respect to untreated control cells, was measured based on the absorbance at 550 nm on an ELISA plate reader (Tecan Sunrise MR20-301, TECAN, Austria). Derivatives that showed high cytotoxicity were used to perform apoptosis, cell-cycle, mitochondrial-membrane potential analysis and studies on morphological changes with Hoescht-staining.
Cells were washed twice with PBS and harvested by trypsinization, resuspended in TBS 1× (10 mM Tris, 150 mM NaCl) and subsequently, Vindelov buffer (100 mM Tris, 100 mM NaCl, 10 mg mL−1 RNase, 1 mg mL−1 propidium iodide [PI], pH 8) were added. Just before measurements, the total DNA content was stained with 1 mg mL−1 PI. The cell-cycle was analyzed using Multicycle software. The data were analyzed to determine the percentage of cells at each phase of the cell-cycle (G0/G1, S and G2/M). Approximately 10 × 103 cells were analyzed in each experiment. All experiments were performed three times with two replicates per experiment.
Similar to the apoptosis assays, 11 × 104 B16–F10 cells were plated in 12-well plates and treated with the different compounds (1, 2, and 4) at their IC50 and IC80 concentrations. Following the treatment, the medium was removed and fresh medium with DHR at a final concentration of 5 μg mL−1 was added. After 30 min of incubation, the medium was removed and the cells were washed and resuspended in PBS with 5 μg mL−1 of PI.
2.4. Statistical analysis
Statistical analyses were performed with the GraphPad Prism 5.0 software. All quantitative data are summarized as the mean ± standard deviation (SD) or mean standard error (SEM). For each assay, Student's t test was used for statistical comparison with the untreated control cells. A limit of p ≤ 0.05 was considered to be statistically significant. Key: p < 0.05 (*), p ≤ 0.01 (**) and p ≤ 0.001 (***). All data shown here are representative of at least three independent experiments performed in duplicate.3. Results and discussion
3.1. Chemistry synthesis
![[thin space (1/6-em)]](https://www.rsc.org/images/entities/char_2009.gif) :
:![[thin space (1/6-em)]](https://www.rsc.org/images/entities/char_2009.gif) 1 ratio) in pyridine for 24 h at RT; 3-O-succinyl oleanolic acid (3) was obtained in high yield. Finally, 28-O-benzyl oleanolate (2) was succinylated following similar conditions to those indicated above for 1 and thus, the bifunctional derivative 3-O-succinyl-28-O-benzyloleanolate (4) was obtained in high yield. This bifunctional derivative (4) of 1 was also obtained by succinylation of 28-benzyloleanolate (2) in similar conditions, as previously indicated. After the target compound was successfully prepared, the structural characteristics of the compound were examined by UV, MS and NMR spectroscopy.
1 ratio) in pyridine for 24 h at RT; 3-O-succinyl oleanolic acid (3) was obtained in high yield. Finally, 28-O-benzyl oleanolate (2) was succinylated following similar conditions to those indicated above for 1 and thus, the bifunctional derivative 3-O-succinyl-28-O-benzyloleanolate (4) was obtained in high yield. This bifunctional derivative (4) of 1 was also obtained by succinylation of 28-benzyloleanolate (2) in similar conditions, as previously indicated. After the target compound was successfully prepared, the structural characteristics of the compound were examined by UV, MS and NMR spectroscopy.
3.2. Anti-cancer activities
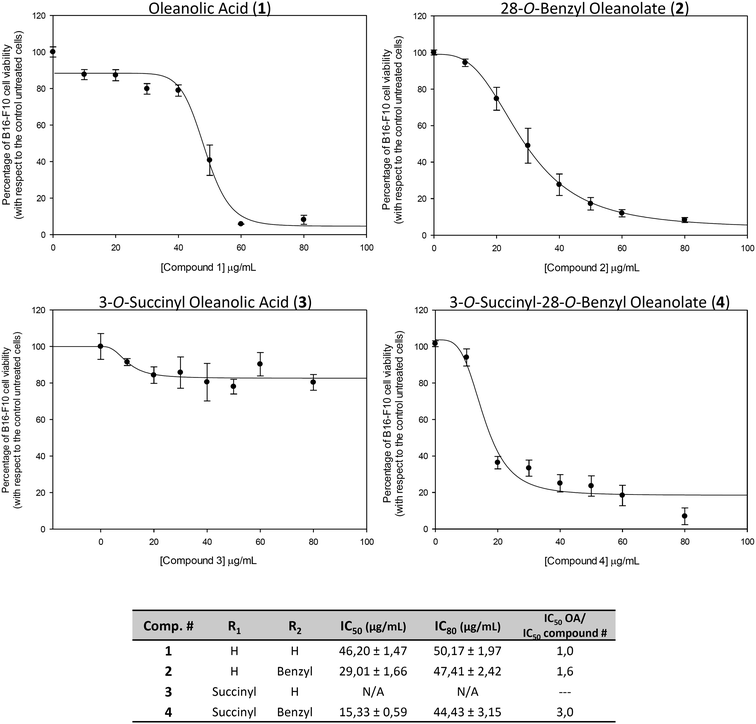
The concentration (expressed in μg mL−1) of products required for 50% and for 80% growth inhibition (IC50 and IC80) were determined for all products (Fig. 2). The treatment with 1 showed quite high values of IC50 and IC80 (IC50 = 46.2 ± 1.4 and IC80 = 50.2 ± 2.0). For treatment with 2, the IC50 value was reduced almost to half (IC50 = 29.0 ± 1.7 and IC80 = 47.4 ± 2.4). The treatment with 3 had no effect on cancer cell proliferation, not reaching the IC50 value.
The treatment with 4 had the lowest IC50 value (IC50 = 15.3 ± 0.6 and IC80 = 44.3 ± 3.1), being three times lower than that of its natural precursor (1), and was half that of 2. These effects could to be related to the increased polarity of the whole molecule, without a significant increase in molecular weight or volume. The compounds 1, 2 and 4 that showed cytotoxic effects in the range of concentrations assayed were selected for the rest of the assays: cell-cycle analysis, characterization of apoptosis, changes in mitochondrial membrane potential and Hoechst-staining.
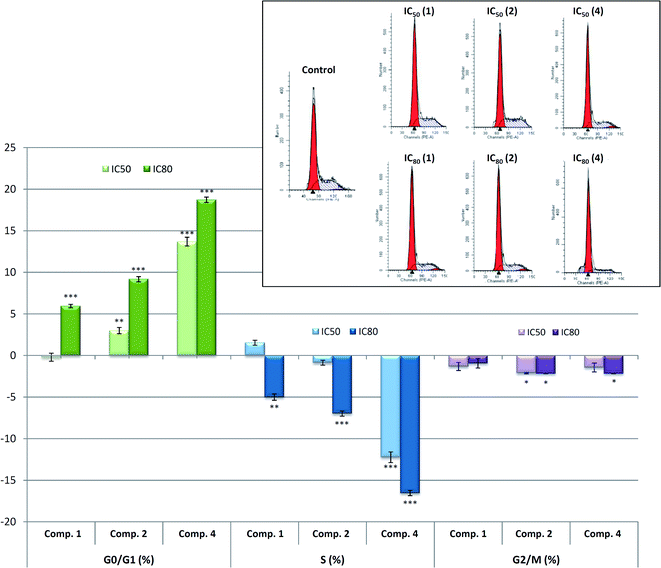
The effects of the selected products, 1, 2 and 4 on cell-cycle distribution were investigated to determine a possible cytostatic effect attached to the cytotoxic response. The distribution of cells in different cell-cycle phases was analyzed after 72 h of treatment, by the incorporation of propidium iodide (PI). B16–F10 melanoma cells were treated with the products at IC50 and IC80 concentrations, determined previously.
A wide range of studies in recent years have shown that triterpenoids hinder carcinogenesis by intervening in pathways such as carcinogen activation, DNA repair, cell-cycle arrest, cell differentiation and the induction of apoptosis in cancer cells.1,45,46 The identification of new cytotoxic agents that enhance or restore the capability of malignant tumor cells to undergo apoptosis may be crucial for more effective anticancer therapies.1,39,40
Apoptosis is one of the body's most potent defenses against cancer; the pathogenesis of many forms of this degenerative disease is closely connected with aberrantly regulated apoptotic cell death. Different mechanisms that regulate apoptosis associated with mediators that trigger or inhibit cell death have led to the development of therapeutic strategies against cancer.
In most of the pentacyclic triterpenoids, the cytotoxic effects are often accompanied by cytostatic effects. These cytostatic effects are frequently associated with apoptosis induction or differentiation cell process activation. The cell-cycle machinery is an alternative target for the identification of novel biomarkers for cancer detection and prognosis, providing target validation for cell-cycle-directed therapies. As the products (1, 2 and 4) inhibited cell growth, we investigated their effect on cell-cycle distribution in B16–F10 skin-melanoma cells after 72 h of treatment. In this respect, two derivatives, 2 and 4, produced cell-cycle arrest in the G0/G1 phase.
Compound 4 induces greater cell-cycle arrest in the G0/G1 phase, which is approximately 15% at IC50 concentration and 20% at IC80 concentration, coinciding with apoptotic cell death and thus, contributing to the inhibition of cell growth. This could indicate a likely induction of cell differentiation in response to the anti-cancer properties of product 4. Further studies, such as the determination of the expression of the differentiation marker enzymes, would be necessary to assert this point.
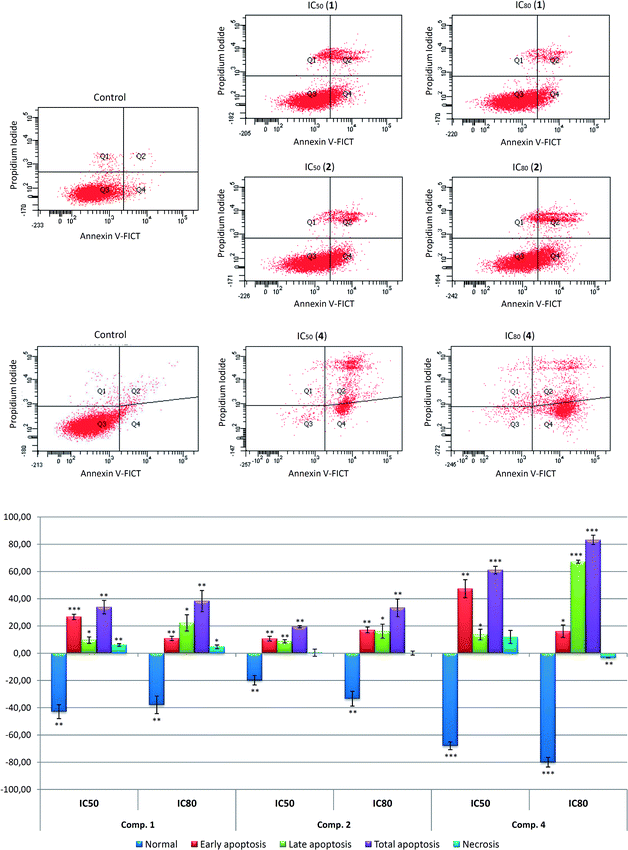
Assessment of apoptosis in B16–F10 cells was performed 72 h after treatment with the compounds 1, 2 and 4 at IC50 and IC80 concentrations. FACS analysis using Annexin V-FITC staining and PI accumulation was used to differentiate normal cells (Annexin-V− and PI−), early apoptotic cells (Annexin-V+ and PI−), late apoptotic cells (Annexin-V+ and PI+) and necrotic cells (Annexin-V− and PI+).
The three compounds demonstrated apoptotic effects on the treated cells, with high percentage of total apoptosis (early apoptotic together with late apoptotic cells), reaching an IC50 concentration of 42% (28.1% early apoptosis and 16.4% late apoptosis) in response to compound 1, 28% (12.2% early apoptosis and 29.1% late apoptosis) for compound 2, and 69% (48.8% early apoptosis and 20.5% late apoptosis) for compound 4.
At IC80 concentration, these percentages were 47% (12.4% early and 29.1% late apoptosis) for 1, 42% (18.6% early apoptosis and 23% late apoptosis) for 2, and 92% (16.6% early apoptosis and 73.9% late apoptosis) in the treatment with 4. In addition, the percentages of the necrotic population were not noteworthy. The apoptotic effect in response to 4, with the lowest IC50 concentration was the most significant.
In most cases, the highest percentage of apoptosis was achieved at IC80 concentrations. In all cases, the number of apoptotic cells increased concomitantly with dose concentration. The low values of IC50 concentrations and good percentages of apoptosis attained by these derivatives, especially by 4, show that they could be used as promising anticancer drugs; further studies will be necessary to strengthen this point.
The apoptotic process frequently does not function in tumor cells. The intrinsic and extrinsic apoptotic activation routes have been described in the apoptotic effect of numerous triterpenoids, such as maslinic acid, ursolic acid, betulinic acid, OA and its derivatives.1–3,5 With alterations to the Bcl-2 protein family balance, loss of mitochondrial membrane potential, and the release of mitochondrial cytochrome-c occur.48,49
We investigated the MMP to determine the possible mechanism involved in the apoptotic responses. The changes in MMP were analyzed by monitoring the cell fluorescence following double staining with Rh123 and PI. Rh123 is a membrane-permeable fluorescent cationic dye that is selectively taken up by mitochondria, and directly proportional to MMP.52
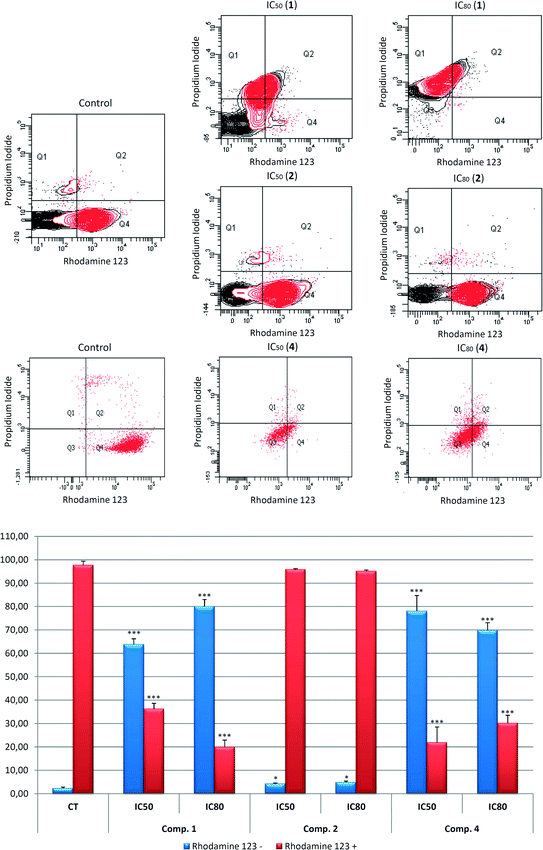
Changes in MMP were analyzed by flow-cytometry staining with Rh123/IP after treatment with the compounds 1, 2, and 4 for 72 h, at IC50 and IC80 concentrations. The apoptosis induction by 2 did not produce any changes in MMP, suggesting that the apoptosis was triggered by the extrinsic apoptotic pathway activation. Compounds 1 and 4 clearly produced MMP disturbances with loss of MMP and negative Rh123 staining.
The treatment with these products showed a decrease in the Rh123 positive cells stained, 63.8% at IC50 and 80.1% at IC80 concentrations for 1, and 78.1% at IC50 and 69.8% at IC80 concentration in response to 4, with a concomitant increase in Rh123 negative cells stained (Fig. 5). Therefore, the mitochondrial disruption, together with apoptosis, could indicate the activation of the intrinsic apoptotic route in the B16–F10 cell line in response to 1 and 4. Nevertheless, no changes in mitochondrial potential were observed following treatment with 2.
These results clearly show mitochondrial disturbances following treatment with 1 and 4 in B16–F10 murine melanoma cells, which could be related to the activation of the mitochondrial or intrinsic apoptotic pathway by these products. Further molecular studies will be necessary to confirm this assertion.
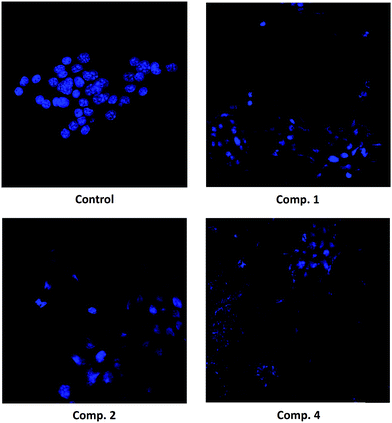
The morphological analysis of Hoechst-stained cells in B16–F10 cells indicated that they had undergone remarkable morphological changes. After 72 h of exposure to compounds 1, 2, and 4 (at IC50 and IC80 concentrations), the cells showed typical apoptotic changes, including cell shrinkage, chromatin condensation, and the loss of normal nuclear architecture. Fluorescence microscopic observation after Hoechst staining showed that a significant number of cells treated with compound 4 acquired apoptotic features, as evident from nuclear fragmentation, and the prominent disruption of the cell-membrane integrity.
4. Conclusions
This study is the first to investigate the apoptotic effects of the oleanolic acid derivatives, 2, 3 and 4, in comparison to their natural precursor. Our data provide evidence that these products exert anti-proliferative and pro-apoptotic effects on B16–F10 skin-melanoma cells, a model for malignant melanoma cells. Moreover, they induce morphological changes that are characteristic of apoptosis, such as chromatin condensation and fragmentation, as well as cell shrinkage and loss of cell-membrane asymmetry, as demonstrated by fluorescence microscopy. These effects are greater in response to 4, compared to its precursor, with smaller IC50 and IC80 values and a greater percentage of apoptosis induction. In conclusion, the 3-O-succinyl-28-O-benzyl oleanolate (4), a novel oleanolic acid derivative, is able to induce apoptosis in murine skin-melanoma cells, probably via the intrinsic mitochondrial pathway. The precise molecular signaling pathway by which this compound induces apoptosis needs to be investigated. Nevertheless, our data could contribute to the development of this compound and related compounds for use as cancer chemotherapeutics or chemopreventive agents. The apoptotic potency of 4 suggests that it may be an effective compound in the prevention or treatment of skin-melanoma.Authors' contribution
Fernando J. Reyes-Zurita, Andrés Parra and José A. Lupiáñez conceived and designed the study protocol. Fernando J. Reyes-Zurita, Marta Medina-O'Donnell, Rosa M. Ferrer-Martín, Eva E. Rufino-Palomares, Amalia Pérez-Jiménez, Leticia García-Salguero, Khalida Mokhtari, Juan Peragón, Pedro P. Medina and José A. Lupiáñez performed all cell culture (in vitro) and other biological experiments. Samuel Martín-Fonseca, Francisco Rivas, Antonio Martínez, Andrés García-Granados and Andrés Parra performed all the synthesis and purification experiments of SBOA and OA. Fernando J. Reyes-Zurita, Marta Medina-O'Donnell, Rosa M. Ferrer-Martín, Eva E. Rufino-Palomares, Amalia Pérez-Jiménez, Khalida Mokhtari, Leticia García-Salguero and Pedro P. Medina contributed to reagents, materials, and analysis tools. Fernando J. Reyes-Zurita, Eva E. Rufino-Palomares, Leticia García-Salguero, Juan Peragón, Pedro P. Medina, Andrés Parra and José A. Lupiáñez conducted the data analysis. Fernando J. Reyes-Zurita, Andrés Parra and José A. Lupiáñez contributed to the paper preparation.Acknowledgements
This study was supported by grants Group BIO 157 from the Technology and Innovation Council of the Andalucian regional government and AGL2006-12210-C03-02/ALI, SAF2005-01627, ISCIII-RTICC (RD06/0020/0046) from the Spanish government and European Union FEDER funds.References
- F. J. Reyes, J. J. Centelles, J. A. Lupiáñez and M. Cascante, FEBS Lett., 2006, 580, 6302–6310 CrossRef CAS PubMed.
- F. J. Reyes-Zurita, E. E. Rufino-Palomares, J. A. Lupiáñez and M. Cascante, Cancer Lett., 2009, 273, 44–54 CrossRef CAS PubMed.
- F. J. Reyes-Zurita, G. Pachon-Pena, D. Lizarraga, E. E. Rufino-Palomares, M. Cascante and J. A. Lupiáñez, BMC Cancer, 2011, 11, 154 CrossRef CAS PubMed.
- S. Sanchez-Tena, F. J. Reyes-Zurita, S. Diaz-Moralli, M. P. Vinardell, M. Reed, F. Garcia-Garcia, J. Dopazo, J. A. Lupiáñez, U. Gunther and M. Cascante, PLoS One, 2013, 8, e59392 CAS.
- F. J. Reyes-Zurita, E. E. Rufino-Palomares, P. P. Medina, E. Leticia Garcia-Salguero, J. Peragon, M. Cascante and J. A. Lupiáñez, Biochimie, 2013, 95, 2157–2167 CrossRef CAS PubMed.
- E. E. Rufino-Palomares, A. Pérez-Jiménez, F. J. Reyes-Zurita, L. García-Salguero, K. Mokhtari, A. Herrera-Merchán, P. P. Medina, J. Peragón and J. A. Lupiáñez, Curr. Org. Chem., 2015, 19, 919–947 CrossRef CAS.
- J. Peragón, E. E. Rufino-Palomares, I. Muñoz-Espada, F. J. Reyes-Zurita and J. A. Lupiáñez, Int. J. Mol. Sci., 2015, 16, 21681–21694 CrossRef PubMed.
- F. J. Reyes-Zurita, E. E. Rufino-Palomares, L. García-Salguero, J. Peragón, P. P. Medina, A. Parra, M. Cascante and J. A. Lupiáñez, PLoS One, 2016, 11, e0146178 Search PubMed.
- E. Rufino-Palomares, F. J. Reyes-Zurita, C. A. Fuentes-Almagro, M. de la Higuera, J. A. Lupiáñez and J. Peragón, Proteomics, 2011, 11, 3312–3325 CrossRef CAS PubMed.
- E. E. Rufino-Palomares, F. J. Reyes-Zurita, L. García-Salguero, K. Mokhtari, P. P. Medina, J. A. Lupiáñez and J. Peragón, J. Proteomics, 2013, 83, 15–25 CrossRef CAS PubMed.
- S. Schwarz, A. Loesche, S. D. Lucas, S. Sommerwerk, I. Serbian, B. Siewert, E. Pianowski and R. Csuk, Eur. J. Med. Chem., 2015, 103, 438–445 CrossRef CAS PubMed.
- K. Mokhtari, E. E. Rufino-Palomares, A. Pérez-Jiménez, F. J. Reyes-Zurita, C. Figuera, L. García-Salguero, P. P. Medina, J. Peragón and J. A. Lupiáñez, Evidence-Based Complementary Altern. Med., 2015, 2015, 272457 Search PubMed.
- M. Cascante, S. Sanchez-Tena, D. Lizarraga, M. A. Reed, J. B. Carrigan, S. Diaz-Moralli, G. Alcarraz-Vizan, F. J. Reyes-Zurita, J. J. Centelles, M. P. Vinardell, J. A. Lupiáñez, V. Noe, C. J. Ciudad, J. L. Torres and U. Gunther, FEBS J., 2013, 280, 628–629 Search PubMed.
- A. Pérez-Jiménez, E. E. Rufino-Palomares, N. Fernández-Gallego, M. C. Ortuño-Costela, F. J. Reyes-Zurita, J. Peragón, L. García-Salguero, K. Mokhtari, P. P. Medina and J. A. Lupiáñez, Phytomedicine, 2016, 23, 1301–1311 CrossRef.
- E. E. Rufino-Palomares, F. J. Reyes-Zurita, L. García-Salguero, J. Peragón, M. de la Higuera and J. A. Lupiáñez, Comp. Biochem. Physiol., Part C: Toxicol. Pharmacol., 2016, 187, 32–42 CrossRef CAS PubMed.
- M. Fernandez-Navarro, J. Peragon, F. J. Esteban, M. de la Higuera and J. A. Lupiáñez, Comp. Biochem. Physiol., Part C: Toxicol. Pharmacol., 2006, 144, 130–140 CrossRef PubMed.
- M. Fernandez-Navarro, J. Peragon, V. Amores, M. de la Higuera and J. A. Lupiáñez, Comp. Biochem. Physiol., Part C: Toxicol. Pharmacol., 2008, 147, 158–167 CrossRef PubMed.
- M. Fernández-Navarro, J. Peragón, F. J. Esteban, V. Amores, M. de la Higuera and J. A. Lupiáñez, in Olives and olive oil in health and disease prevention, ed. V. R. Perry and R. R. Watson, Elsevier Inc, London, England, 2009, ch. 157, pp. 1415–1421 Search PubMed.
- E. E. Rufino-Palomares, F. J. Reyes-Zurita, L. García-Salguero, J. Peragón, M. de la Higuera and J. A. Lupiáñez, Aquacult. Nutr., 2012, 18, 138–151 CrossRef CAS.
- E. E. Rufino-Palomares, F. J. Reyes-Zurita, L. García-Salguero, J. Peragón, M. de la Higuera and J. A. Lupiáñez, Aquacult. Nutr., 2012, 18, 568–580 CrossRef CAS.
- E. E. Rufino-Palomares, F. J. Reyes-Zurita, L. Garcia-Salguero, J. Peragon, M. de la Higuera and J. A. Lupiáñez, Aquacult. Nutr., 2013, 19, 709–720 CrossRef CAS.
- E. E. Rufino-Palomares, J. Peragón, F. J. Reyes-Zurita, L. García-Salguero and J. A. Lupiáñez, FEBS J., 2012, 279, 229–230 Search PubMed.
- R. Thimmappa, K. Geisler, T. Louveau, P. O'Maille and A. Osbourn, Annu. Rev. Plant Biol., 2014, 65, 225–257 CrossRef CAS PubMed.
- W. S. Kombargi, S. E. Michelakis and C. A. Petrakis, J. Econ. Entomol., 1998, 91, 993–998 CrossRef CAS.
- R. A. Hill and J. D. Connolly, Nat. Prod. Rep., 2015, 32, 273–327 RSC.
- H. Tokuda, H. Ohigashi, K. Koshimizu and Y. Ito, Cancer Lett., 1986, 33, 279–285 CrossRef CAS PubMed.
- M. K. Shanmugam, X. Dai, A. P. Kumar, B. K. Tan, G. Sethi and A. Bishayee, Cancer Lett., 2014, 346, 206–216 CrossRef CAS PubMed.
- K. T. Liby and M. B. Sporn, Pharmacol. Rev., 2012, 64, 972–1003 CrossRef CAS PubMed.
- M. Medina-O'Donnell, F. Rivas, F. J. Reyes-Zurita, A. Martinez, S. Martin-Fonseca, A. Garcia-Granados, R. M. Ferrer-Martin, J. A. Lupiáñez and A. Parra, Eur. J. Med. Chem., 2016, 118, 64–78 CrossRef PubMed.
- A. Parra, S. Martín-Fonseca, F. Rivas, F. J. Reyes-Zurita, M. Medina-O'Donnell, E. E. Rufino-Palomares, A. Martínez, A. García-Granados, J. A. Lupiáñez and F. Albericio, ACS Comb. Sci., 2014, 16, 428–447 CrossRef CAS PubMed.
- A. Parra, S. Martin-Fonseca, F. Rivas, F. J. Reyes-Zurita, M. Medina-O'Donnell, A. Martinez, A. Garcia-Granados, J. A. Lupiáñez and F. Albericio, Eur. J. Med. Chem., 2014, 74, 278–301 CrossRef CAS PubMed.
- R. Rodriguez-Rodriguez, Curr. Med. Chem., 2015, 22, 1414–1425 CrossRef CAS PubMed.
- Z. Du, Z. Liu, Z. Ning, Y. Liu, Z. Song, C. Wang and A. Lu, Planta Med., 2015, 81, 259–271 CrossRef CAS PubMed.
- R. Csuk, Expert Opin. Ther. Pat., 2014, 24, 913–923 CrossRef CAS PubMed.
- X. Wang, Genes Dev., 2001, 15, 2922–2933 CAS.
- S. Y. Sun, N. Hail Jr and R. Lotan, J. Natl. Cancer Inst., 2004, 96, 662–672 CrossRef CAS PubMed.
- A. Ashkenazi, Cytokine Growth Factor Rev., 2008, 19, 325–331 CrossRef CAS PubMed.
- O. Micheau and J. Tschopp, Cell, 2003, 114, 181–190 CrossRef CAS PubMed.
- A. Garcia-Granados, P. C. T. Int. Appl, WO 9804331, 1998Chem. Abstr., 1998, 128, 179706.
- A. Garcia-Granados, A. Martinez, J. N. Moliz, A. Parra and F. Rivas, Molecules, 1998, 3, M88 CrossRef CAS.
- R. Weis and W. Seebacher, Magn. Reson. Chem., 2002, 40, 455–457 CrossRef CAS.
- J. Yang, J. W. Quail and Z. C. Jia, Acta Crystallogr., Sect. C: Cryst. Struct. Commun., 1997, 53, 349–351 Search PubMed.
- I. J. Fidler, Cancer Res., 1975, 35, 218–224 CAS.
- I. J. Fidler and C. Bucana, Cancer Res., 1977, 37, 3945–3956 CAS.
- P. Dzubak, M. Hajduch, D. Vydra, A. Hustova, M. Kvasnica, D. Biedermann, L. Markova, M. Urban and J. Sarek, Nat. Prod. Rep., 2006, 23, 394–411 RSC.
- T. Ikeda, M. Sporn, T. Honda, G. W. Gribble and D. Kufe, Cancer Res., 2003, 63, 5551–5558 CAS.
- K. Takano, Y. Nakamura and Y. Yoneda, Neuroscience, 2003, 120, 961–967 CrossRef CAS PubMed.
- P. O. Harmand, R. Duval, C. Delage and A. Simon, Int. J. Cancer, 2005, 114, 1–11 CrossRef CAS PubMed.
- V. Zuco, R. Supino, S. C. Righetti, L. Cleris, E. Marchesi, C. Gambacorti-Passerini and F. Formelli, Cancer Lett., 2002, 175, 17–25 CrossRef CAS PubMed.
- A. Petronelli, G. Pannitteri and U. Testa, Anticancer Drugs, 2009, 20, 880–892 CrossRef CAS PubMed.
- R. Martin, J. Carvalho-Tavares, E. Ibeas, M. Hernandez, V. Ruiz-Gutierrez and M. L. Nieto, Cancer Res., 2007, 67, 3741–3751 CrossRef CAS PubMed.
- R. K. Emaus, R. Grunwald and J. J. Lemasters, Biochim. Biophys. Acta, 1986, 850, 436–448 CrossRef CAS.
| This journal is © The Royal Society of Chemistry 2016 |

