DOI:
10.1039/C6RA18712A
(Paper)
RSC Adv., 2016,
6, 106453-106464
Facile synthesis of D–π–A structured dyes and their applications towards the cost effective fabrication of solar cells as well as sensing of hazardous Hg(II)†
Received
23rd July 2016
, Accepted 17th October 2016
First published on 19th October 2016
Abstract
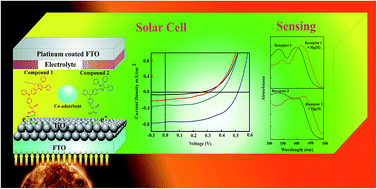
We design and establish an environmentally benign synthesis of new D–π–A dyes containing imidazole derivatives structured to triphenylamine (TPA) as a donor and cyano acrylic groups acting as acceptors without using any toxic catalysts. These newly synthesized imidazole derivatives are anchored on TiO2, towards a cost effective dye sensitized organic solar cell, and achieve 0.22% solar-light to electricity conversion efficiency under standard AM 1.5G irradiation (100 mW cm−2). The most widely significant findings of this study are high thermal stability, smooth surface, strong intramolecular interaction between dyes and TiO2 which improve the performance of the dye sensitized solar cell. The metal ion sensing properties of both the dyes were investigated optically using UV-Vis absorption spectroscopy. The results exhibited high selectivity and sensitivity towards toxic Hg(II) ions compared to other tested metal ions. The binding constants (Ka) of receptors 1 and 2 are 2.53 × 10⁵ M−1 and 0.99 × 10⁵ M−1, respectively, which are reported with the help of Benesi–Hildebrand method.
Introduction
Breakthrough work by Gratzel in 1991 and increasing public concern about the development of new energy sources, dye-sensitized solar cells (DSSCs) have attracted more and more attention because of their advantages such as their low cost, simple preparation process, green materials, environmentally friendliness, up-scalable strategy and relatively high conversion efficiencies.1,2 DSSCs typically contain four components: a mesoporous semiconductor metal oxide film, a dye, an electrolyte/hole transporter, and a counter electrode. Routinely, DSSCs consist of a photoanode synthesized from mesoporous TiO2 particles adsorbed with a sensitizer, an iodide/tri-iodide (I−/I3−) redox couple as an electrolyte, and platinum (Pt) as a counter electrode.3–8
“Green” compounds are getting more and more attention from researchers as they have additional advantages in terms of low toxicity and ready biodegradability without the generation of toxic, persistent metabolites.9 In metal-free organic sensitizers, traditional linear donor–π–acceptor (D–π–A) systems are the most common, and consist of donor, π-conjugation linker, and acceptor parts. But D–π–A structures usually have a linear construction, and the major factors for the low conversion efficiency of DSSCs based on organic dyes are the formation of dye aggregates on the semiconductor surface and the recombination of conduction band electrons with triiodide in the electrolyte.10 In order to overcome these disadvantages and extend the π-system of the dye, an imidazole derivative to the D–π–A structure has been introduced, which is a possible alternative to retard the interfacial charge-recombination dynamics and to retain efficient light-induced charge separation. Among the organic dyes, triphenylamine (TPA) and its derivatives as donor units have displayed promising properties in the development of photovoltaic devices, because TPA is non-coplanar, it can act as a rich electron donor and chemically stable molecule.11–13 A series of organic dyes showed that the use of the π-conjugation could improve the photovoltaic performance of DSSCs.14–16 Molecules containing donor–π–acceptor (D–π–A) moieties are types of commonly-used organic sensitizers. These D–π–A moieties could result in electron push–pull, by allowing efficient intramolecular charge transfer (ICT), as a consequence of which, charge separation and photoelectron injection could occur in DSSCs.17,18 Specifically, TPA represents one of the most studied electron donors, because of its (i) good electron donating properties, and (ii) highly stabilized radical cation due to its oxidized form (namely, TPA˙+), so that the charge recombination process could be efficiently prevented.19 TPA derivatives show multifunctional properties, and they are commonly used as two photon absorption (TPA) materials, in memory devices and hole transporting materials.20 On the other hand, five membered heterocyclic compounds containing two heterocyclic compounds have been reported as P38 MAP kinase inhibitors, antivascular disruptors, antitumor compounds, ionic liquids, anion sensors, and electrical and optical materials.21
In continuation of our research into the synthesis of organic compounds and dyes,22–25 and their applications in photovoltaic cells26–30 and sensing of hazardous Hg(II) and Cu(II),31 we introduce the synthesis of two D–π–A dyes with imidazole derived structures, compounds 1 and 2, with triphenylamine as the donor and cyanoacetic acid as the acceptor. The effect of imidazole derivatives in compounds 1 and 2 on the optical and photovoltaic performance were studied. Furthermore, the metal ion sensing properties of both the compounds were studied using UV-Vis absorption spectroscopy and results showed high selectivity of the Hg(II) ion.
Experimental
Instrumentation
1H-NMR and 13C-NMR spectra were recorded on Mercury Plus 300 MHz NMR spectrometer. Liquid chromatography high resolution mass (LC-HRMS) spectra were recorded on 6550 iFunnel QTOF LC-MS/MS Make-Agilent Technologies 1290 Infinity Binary Pump. The thermogravimetric analyses (TGA) was carried out on a Perkin Elmer 4000 instrument under purified nitrogen gas flow with a 10 °C min−1 heating rate. Surface roughness and morphology of thin films were characterized by Field Emission-Scanning Electron Microscopy (FE-SEM) on an S-4800 instrument from Hitachi, Japan operated at 10 kV and elemental analysis were performed by EDAX unit coupled with FE-SEM unit. The optical absorption spectra were recorded between 300 to 800 nm wavelength ranges by UV-Vis spectrophotometer (Shimadzu 2450). Film thicknesses were measured by using a thickness profiler DEKTAK-150 profilometer for area 1 μm. The current density–voltage (J–V) characteristics of the organic solar cells (OSCs) were measured under 100 mW cm−2 AM 1.5G illumination condition which was provided by a 3A grade solar simulator (Newport, USA, 94043A, calibrated with a standard crystalline silicon solar cell).
Synthesis
Scheme 1 demonstrates the synthetic route for all of the compounds used. All spectral graphs have been given in section S2 of the ESI.†
 |
| Scheme 1 Synthetic routes of compound 1 and compound 2 (a) acetic acid, ammonium acetate, ethanol (b) piperidine, acetonitrile. | |
Synthesis of compound (i). 1,2-Diphenylethane-1,2-dione (benzil) (10 mmol), 4,4′-diformyltriphenylamine (10 mmol), hexylamine (10 mmol), ammonium acetate (10 mmol), and acetic acid (0.5 mL) were charged sequentially in a round bottom flask and heated in EtOH (ethanol) 10 mL under reflux for 10 h. The reaction mixture was then poured into ice-cold water. The resulting precipitate was filtered, washed with water, and dried, and the resulting residue was purified using silica gel column chromatography with hexane/ethyl acetate to afford compound (i) as a yellow solid. Yield: 68.42%.1H NMR (300 MHz, DMSO-d6): 0.656–0.672 (t, 3H), 1.337 (brs, 6H), 1.915–2.001 (quintet, 2H), 4.101 (brs, 2H) 6.964–6.994 (d, 2H, 9 Hz), 7.139–7.158 (d, 2H, 5.7 Hz), 7.256–7.530 (m, 15H), 7.835–7.867 (d, 2H, 9.6 Hz), 8.038–8.067 (d, 2H, 8.7 Hz), 9.989 (s, 1H).
13C NMR (75 MHz, DMSO-d6): 14.125, 22.180, 26.256, 30.545, 34.456, 43.689, 123.045, 123.565, 124.385, 125.114, 125.683, 126.256, 126.816, 129.234, 144.054, 152.474, 156.241, 157.042, 179.260.
MS: calculated C40H37N3O 575.29; found ([C40H37N3O] + 2H) 577.32.
Synthesis of compound (ii). 1,2-Diphenylethane-1,2-dione (benzil) (10 mmol), 4,4′-diformyltriphenylamine (10 mmol), aniline (10 mmol), ammonium acetate (10 mmol), acetic acid (0.5 mL) were charged sequentially in a round bottom flask and heated in 10 mL ethanol under reflux for 12 h. The reaction mixture was then poured into ice-cold water. The resulting precipitate was filtered, washed with water, and dried, and the resulting residue was purified using silica gel column chromatography with hexane/ethyl acetate to afford compound (ii) as a yellow solid. Yield: 70.54%.1H NMR (300 MHz, DMSO-d6): 6.711–6.739 (d, 2H, 8.4 Hz), 6.890–6.923 (d, 2H, 9.9 Hz), 7.125–7.151 (d, 2H, 7.8 Hz), 7.430–7.702 (m, 20H), 8.109–8.135 (d, 2H, 7.8 Hz), 9.741 (s, 1H).
13C NMR (75 MHz, DMSO-d6): 125.151, 126.075, 126.380, 126.509, 127.141, 127.618, 128.218, 135.319, 135.892, 145.770, 148.126, 156.391, 180.844.
MS: calculated C40H29N3O 567.23; found ([C40H29N3O] + H) 568.25.
Synthesis of compound 1 (receptor 1): (E)-2-cyano-3-(4-((4-(1-hexyl-4,5-diphenyl-1H-imidazol-2-yl)phenyl)(phenyl)amino)phenyl)acrylic acid. Acetonitrile (10 mL), compound (i) (5 mmol), cyanoacetic acid (10 mmol), and few drops of piperidine were charged sequentially in a round bottom flask and heated under reflux for 7 h. After cooling to room temperature, the solvents were removed through rotary evaporation, and the residue was purified using silica gel column chromatography with hexane/ethanol to afford compound 1 as a deep yellow solid. Yield: 64.51%.1H NMR (300 MHz, DMSO-d6): 0.662–0.708 (t, 3H), 1.288 (brs, 6H), 1.965 (s, 2H), 4.141 (s, 2H), 6.956–6.985 (d, 2H, 8.7 Hz), 7.007–7.970 (m, 17H), 8.089–8.157 (m, 5H), 10.573 (s, 1H).
13C NMR (75 MHz, DMSO-d6): 14.007, 20.658, 24.305, 29.579, 34.456, 45.709, 98.037, 116.642, 118.795, 123.140, 125.564, 126.118, 126.414, 126.681, 127.381, 128.089, 129.804, 132.556, 144.654, 144.787, 144.844, 151.121, 152.876, 163.720.
HR-MS: calculated C43H38N4O2 642.2942; found ([C43H38N4O2] + H) 643.3016.
Synthesis of compound 2 (receptor 2): (E)-2-cyano-3-(4-(phenyl(4-(1,4,5-triphenyl-1H-imidazol-2-yl)phenyl)amino)phenyl)acrylic acid. Acetonitrile (10 mL), compound (ii) (5 mmol), cyanoacetic acid (10 mmol), and few drops of piperidine were charged sequentially in a round bottom flask and heated under reflux for 10 h. After cooling to room temperature, the solvents were removed through rotary evaporation, and the residue was purified using silica gel column chromatography with hexane/ethanol to afford compound 2 as an orange solid. Yield: 66.24%.1H NMR (300 MHz, DMSO-d6): 6.950–6.979 (d, 2H, 8.7 Hz), 7.045–7.534 (m, 22H), 7.936–7.965 (d, 2H, 8.7), 8.095–8.158 (m, 3H), 10.601 (s, 1H).
13C NMR (75 MHz, DMSO-d6): 98.041, 116.610, 118.782, 123.136, 124.933, 125.511, 126.082, 126.410, 126.830, 127.373, 127.822, 128.056, 128.518, 129.760, 132.519, 144.626, 144.771, 151.083, 152.839, 163.704.
HR-MS: calculated C43H30N4O2 634.2317; found ([C43H30N4O2] + H) 635.2391.
Fabrication of solar cell devices
An FTO (fluorine doped tin oxide) coated glass substrate was first cleaned in a detergent solution and then cleaned ultrasonically with double distilled water and ethanol. For the fabrication of the solar cell, a paste of TiO2 nanoparticles was coated, using a dip-coating method, on FTO. This dipping and drying cycle were repeated 10 times. After 10 successive cycles these TiO2 coated FTO films were first dried at 100 °C for 30 min and then annealed at 500 °C for 1 h in air. Following this, different solutions containing different combinations of the synthesised compounds (10 mM compound 1 and compound 2), and 5 mM cholic acid were prepared separately in EtOH. Then the FTO/TiO2 plate was immersed into the solution of compounds:cholic acid and kept for 10 minutes at 60 °C until the chemical attachment of compounds was complete, the plates were then rinsed with EtOH to remove any excess compound.
UV-Vis absorption spectroscopic studies
All of the solutions required for the UV-Vis absorption spectroscopic study were prepared in double distilled water and EtOH. Solutions of receptor 1 and 2 (c = 1 mM and 0.1 mM) were prepared in EtOH/H2O (80
:
20, v/v). Similarly, stock solutions of all of the metal ions (c = 1 mM) were prepared in EtOH/H2O (80
:
20, v/v) and diluted to yield their corresponding working solutions (c = 0.1 mM). The selectivity of the cations towards different metal ions (1 mM, 100 μL) [Ag(I), Al(III), Ba(II), Ca(II), Cd(II), Co(II), Cs(I), Cu(II), Fe(II), Fe(III), Hg(II), K(I), Mg(II), Mn(II), Na(I), Ni(II), Pb(II), Sr(II), Zn(II), Zr(IV), Pt(II) and Au(III)] was performed on a Shimadzu 2450 UV-Vis spectrophotometer with receptor 1 and 2 (0.1 mM, 2000 μL) in EtOH/H2O (80
:
20, v/v) at room temperature. Absorption intensity was recorded in the range of λ = 300–550 nm alongside a reagent blank. The binding constants (Ka) and limits of detection (LOD) was calculated from the titration experiments, which were performed between receptor 1 and 2 with Hg(II). Titrations were performed through successive incremental addition of metal salt solutions (c = 1 mM) to fixed volume solutions of receptor 1 and 2 (c = 0.1 mM) in 10 mL volumetric flasks. The stoichiometry of the complexes of receptor 1 and 2 with Hg(II) was determined by mixing.
Result and discussion
Synthesis and characterization of the new dyes
The synthesis of the two new imidazole based organic dyes, compounds 1 and 2, is outlined in Scheme 1. The two compounds 1 and 2 were synthesized through a similar stepwise synthetic protocol. First, 1,2-diphenylethane-1,2-dione (benzil) and 4,4′-diformyltriphenylamine were reacted with hexylamine and aniline in the presence of ammonium acetate in acetic acid which resulted in compounds (i) and (ii). Finally, compounds (i) and (ii) with about a three fold excess of 2-cyanoacetic acid afforded the target compounds 1 and 2 in acetonitrile using piperidine as a catalyst. A plausible mechanism for the synthesis of both of the compounds was given in section S1 of the ESI.† The structures of all of the dye molecules were characterized unambiguously with 1H NMR, 13C NMR, mass spectroscopy and HRMS analysis (detailed spectra are given in section S2 of the ESI†).
C. Jia and co-workers reported a two component reaction of 1,2-diphenylethane-1,2-dione with 4,4′-diformyltriphenylamine in the presence of ammonium acetate and acetic acid under reflux for 15 h, followed by the addition of cyanoacetic acid for the synthesis of TPA-B5.32 Whereas, in our work we introduced a one pot three component synthesis of compounds (i) and (ii) through the reaction of 1,2-diphenylethane-1,2-dione and 4,4′-diformyltriphenylamine with hexylamine and aniline respectively. We have used hexylamine and aniline for the synthesis of compound 1 and 2 to check the effects of saturated and six membered substituents linked to the imidazole ring on the efficiency of solar cells. The primary aims of these modifications were to study the effects of these substituents on the efficiency of solar cells in the presence of cholic acid and also their effect on binding constants with Hg(II).
Optical properties
To ascertain the light-harvesting abilities of the synthesized compounds we have recorded the absorption spectra of the compounds in EtOH. Fig. 1 shows the absorption spectra of the dyes. In ethanol solutions, compounds 1 and 2 show one band in the visible region which appears at 400 nm and 402 nm, respectively. Both of the compounds show nearly the same absorption in the visible region. TiO2 shows weak absorption in the visible region as compared to compounds 1 and 2. The absorption spectra of both of the compounds in ethanol after the addition of cholic acid show slight red-shifts. Cholic acid, as a non-conjugated co-adsorbent spacer, is introduced between the TiO2 and the chromophore of the dye molecule to prevent aggregation. When compounds 1 and 2 with the co-adsorbent cholic acid are adsorbed on TiO2, the spectra show an overall red shift. This indicates a strong interaction between the anchoring group and the TiO2 surface which may be helpful for light harvesting in the solar cell, enhancing the photocurrent of the cell.
 |
| Fig. 1 Normalized absorption spectra of (a) compound 1 in ethanol, (b) compound 2 in ethanol, (c) compound 1:cholic acid in ethanol, (d) compound 2:cholic acid in ethanol, (e) TiO2 coated on FTO (f) FTO/TiO2/compound 1:cholic acid, and (g) FTO/TiO2/compound 2:cholic acid. | |
Thermal stability
The thermal stabilities of compounds 1 and 2 were evaluated using thermo-gravimetric analysis (TGA) under nitrogen (Fig. 2). Initial weight loss (decomposition temperature Td) is observed in stage I for compound 1 and compound 2 at 255.3 and 232.3 °C, respectively. Then, in the second stage, weight loss of 28.3% and 20% for compound 1 and compound 2, respectively, after stage I were observed, which may be due to the loss of CH4 and acrylic acid from both compounds. Furthermore, compound 1 and compound 2 decompose completely in stage III at 657 and 765 °C, respectively, which can be assigned to the complete decomposition of the carbon frames of both compounds. The weight percentage of compound 1 at 657 °C is 0.047% and that of compound 2 at 765 °C is 4.99%.
 |
| Fig. 2 TGA of (a) compound 1 and (b) compound 2. | |
Surface characterization
The morphologies of compounds 1 and 2, with and without co-adsorbent cholic acid, were studied using FE-SEM and the chemical components of their respective material films were identified using the Energy Dispersive X-ray Analysis (EDAX) technique, and are shown in Fig. 3. It can be seen from these images that compact films were uniformly formed on the FTO glass plate. Further observation indicates that smoothness and homogeneity of the surface increases with the addition of cholic acid. This homogeneity minimizes void formation and increases the contact area at the interface of the electrode and electrolyte. The enlarged effective reaction area can enhance charge transfer reactions with the electrolyte, which results in moderate efficiency compared to the compounds without cholic acid. In addition, there was no obvious cracks in the films observed.
 |
| Fig. 3 FE-SEM images of (a) compound 1 on TiO2, (b) compound 2 on TiO2, (c) compound 1 with cholic acid on TiO2, and (d) compound 2 with cholic acid on TiO2. (e) (f) (g) and (h) represent the EDAX analyses, respectively. | |
Electrochemical properties
The highest occupied molecular orbitals (HOMOs) and lowest unoccupied molecular orbitals (LUMOs) of the synthesized dyes were determined using cyclic voltammetry (CV).26
The onset oxidation and reduction potentials of compound 1 are 1.21 V and −1.62 V, respectively, thus the corresponding HOMO and LUMO energy levels are −5.62 eV and −2.78 eV. For compound 2, the onset oxidation and reduction potentials of compound 1 are 1.10 V and −1.61 V, respectively, and the corresponding HOMO and LUMO energy levels are −5.50 eV and −2.79 eV. Band gaps calculated from the HOMOs and LUMOs are 2.84 eV and 2.71 eV for compound 1 and compound 2, respectively, which are consistent with the optical band gaps (Eoptg) 2.81 eV and 2.76 eV calculated from the UV-Vis absorption onset (a detailed plot is given in S3, ESI†). The voltammograms of both dyes are shown in Fig. 4 and the electrochemical energy levels are summarized in Table 1. The schematic energy levels of compound 1 and compound 2 based on absorption and electrochemical data are shown in Fig. 5. The HOMO and LUMO energy levels of the two synthesised organic molecules show that they were suitable as donors in organic solar cells with TiO2 as the acceptor. The positions of the HOMOs and LUMOs of compound 1 and compound 2 are at higher energy levels than the valance band (V.B.) and conduction band (C.B.) of TiO2, respectively, as illustrated in Fig. 5. There is a probability that photo-generated electrons within the dye, after transfer to the LUMO, can be quickly transferred to the C.B. of TiO2 which lies at a lower energy level than the LUMO of the dyes, which is a basic requirement for DSSCs.
 |
| Fig. 4 Cyclic voltammograms of compound 1 and compound 2 in 1000 ppm tetra-n-butylammonium-hexafluorophosphate (TBAPF6) in acetonitrile solution at a scan rate of 100 mV s−1. | |
Table 1 Photophysical and electrochemical data for the dyes
Material |
Eoxi (V) |
Ered (V) |
HOMO (eV) |
LUMO (eV) |
Eecg (eV) |
Eoptg (eV) |
Compound 1 |
1.21 |
−1.62 |
−5.62 |
−2.78 |
2.84 |
2.81 |
Compound 2 |
1.10 |
−1.61 |
−5.50 |
−2.79 |
2.71 |
2.76 |
 |
| Fig. 5 Schematic energy levels of (a) compound 1 and (b) compound 2 based on absorption and electrochemical data. | |
Photochemical properties
The photocurrent density–photovoltage (J–V) curves of the corresponding DSSC devices, measured under AM 1.5G irradiation (100 mW cm−2), have the structure FTO/TiO2/compound:cholic acid/electrolyte/Pt and are shown in Fig. 6. The detailed photovoltaic parameters obtained are summarized in Table 2. For the construction of the solar cell, a layer of TiO2 nanoparticles with a maximum thickness of 3.5 μm and roughness of 310 nm was coated on a clean FTO conducting glass plate, using a dip-coating method of up to 10 cycles, from its acetone dispersion. After 10 successive cycles these TiO2 coated FTO films were first dried at 100 °C for 30 min and then annealed at 500 °C for 1 h in air. After cooling, the TiO2 electrodes were immersed into 10 mm dye solutions of compound 1 and 2 with or without 5 mm cholic acid in ethanol using a simple dipping method at 60 °C for 10 minutes. The dye-anchored TiO2 working electrode and the counter electrode were assembled into a sealed DSSC cell. A drop of electrolyte solution was injected into the cell using capillary action. The electrolyte solution consisted of 0.5 M tetra-n-propyl ammonium iodide and 0.1 M I2 in ethylene carbonate/acetonitrile (2
:
8 volumes).33 Finally, current density–voltage (J–V) measurements for the devices with the above structure under dark and illuminated conditions were performed in the voltage range of −0.6 to +0.6 V. Table 2 shows the moderate efficiency of 0.22% for compound 1 containing saturated substituents and 0.068% for compound 2 containing six membered substituents. This change in efficiency is the result of different rates of electron transfer from the donor layer to acceptor layer. As saturated substituents show electron donating effects, the presence of saturated substituents accelerated electron transfer to the acceptor layer. Whereas the six membered ring substituents have shown an opposite effect compared to the saturated substituents because of the delocalization of electrons through the six membered conjugated rings. Therefore compound 1 has shown a moderate efficiency compared to compound 2.
 |
| Fig. 6 Current density–voltage curves of (a) FTO/TiO2/compound 1/electrolyte/Pt, (b) FTO/TiO2/compound 2/electrolyte/Pt, (c) FTO/TiO2/compound 1:cholic acid/electrolyte/Pt, and (d) FTO/TiO2/compound 2:cholic acid/electrolyte/Pt. | |
Table 2 Photovoltaic performance of the different devices
Device |
Voc (V) |
Jsc (mA cm−2) |
FF |
Efficiency (%) |
(a) |
0.273 |
0.061 |
0.38 |
0.006 |
(b) |
0.313 |
0.194 |
0.45 |
0.027 |
(c) |
0.518 |
0.754 |
0.57 |
0.222 |
(d) |
0.393 |
0.273 |
0.53 |
0.068 |
Spectroscopic studies for Hg(II) sensing
Both of the synthesised dyes contain nitrogen atoms and polar oxygen atoms from carboxylic groups with extended π-electron clouds which makes them key receptors for sensing electron deficient centres. Keeping this in mind, we have screened different metal cations towards the UV-Visible spectroscopic response of key receptor 1 in an EtOH/H2O (80
:
20, v/v) medium as shown in Fig. 7(a). Receptor 1 shows a broad absorption spectra with absorption maxima at 332 nm and 400 nm. Amusingly, on addition of 100 μL of a Hg(II) ion solution to a 2000 μL solution of receptor 1, the absorption maxima red shifted at 346 nm and 417 nm, respectively, whilst other metal ions do not affect or moderately affect the absorption contour of the key motifs of receptor 1. As a consequence, a noteworthy discernable shift of 14 and 17 nm in the absorption peaks of receptor 1 at 332 nm and 400 nm, gives it conceivable use as a sensor for the selective and sensitive recognition of Hg(II) ions amongst the range of metal ions studied. Similarly, the absorption maximum of receptor 2, centered at 402 nm becomes red shifted at 425 nm, with a judicious shift of 23 nm on addition of the Hg(II) ion solution, thus proving receptor 2 as a selective and sensitive chemosensor, as revealed in Fig. 7(b). The shifting may be a result of some sort of photoelectron transfer (PET).
 |
| Fig. 7 Changes in absorption intensity of (a) receptor 1 (0.1 mm, 2000 μL) and (b) receptor 2 (0.1 mm, 2000 μL), upon addition of fixed amounts of metal ion (1 mm, 100 μL) solutions in EtOH/H2O (80 : 20, v/v). | |
Fig. 8 shows plausible complexation of both receptors with Hg(II). Both receptors contain heteroatomic centres in the form of nitrogen and oxygen with lone pairs of electrons which are capable of forming metal ligand bonds with electron deficient centres. Moreover both receptors have extended electron clouds over their structures in the form of conjugated double bonds which makes them electron rich moieties overall, this allows them to form complexes with electron deficient centres such as cations. The binding mode of Hg(II) via hard atoms such as nitrogen and oxygen has been reported in the literature.31,34–39 G. Chen et al. reviewed fluorescent and colorimetric sensors for environmental mercury detection.35 In that review, the authors have explained different modes of binding with the sensors with Hg(II) and suggested that even though Hg(II) is a soft atom, it is possible to bind it to the sensor through hard atoms such as nitrogen and oxygen.
 |
| Fig. 8 Plausible complex formation between (a) receptor 1 and (b) receptor 2 with Hg(II). | |
In order to elucidate the binding modes of both compounds with Hg(II), we initially compared the 1H-NMR spectra of both compounds with their Hg(II) complexes in DMSO-d6 (Fig. S4, ESI†). When 0, 1, 2, 5 equiv. of Hg(II) were added to solutions of receptor 1 and receptor 2 separately, signals of –OH protons (indicated by i for receptor 1 and e for receptor 2 in Fig. S4, ESI,† respectively) were shifted downfield (Δ ppm = 0.71 for receptor 1 and Δ ppm = 0.90 for receptor 2) more so than that of other aromatic and aliphatic protons of both compounds. Also –CH– protons of the cyano acrylic acid groups (indicated by h for receptor 1 and d for receptor 2 in Fig. S4, ESI†, respectively) were shifted upfield (Δ ppm = 1.64 for receptor 1 and Δ ppm = 1.8 for receptor 2) after the complexation of both receptors with Hg(II). The upfield shift of these –CH– protons of the cyano acrylic acid groups may be attributed to the shielding of these protons. This might be because the cloud from the full set of d electrons exhibited by Hg(II) somehow adds to the ligand pi system, thereby allowing some shielding of the –CH– protons. This indicated that the cyano acrylic acid groups are involved in the binding process and that they bind through nitrogen and oxygen centres within the first coordination sphere of the Hg(II) complexes. It should be noted that the shifts observed in the cyano acrylic acid group protons for both complexes suggested metal–nitrogen and metal–oxygen interactions in both complexes. However, further insights into the 1H-NMR titration spectra revealed that no further changes in 1H-NMR signals were observed at higher equivalents of Hg(II). The 1H-NMR titration results also indicated a 1
:
1 binding stoichiometry of both receptors with Hg(II) which supported the Job’s plot results (Fig. 13).
Here Hg(II) is binding to the compound framework through secondary bond formation and such metal ligand binding does not involve strong electron sharing as observed in covalent bonding. Therefore, such binding will have much less of an effect on the hybridization modes of the organic framework. In Fig. 8, Hg(II) binds through metal ligand bond formation which will exhibit weak electron donation towards the Hg(II) centre which will result in some stain on the –CN group. However, another electron rich centre (oxygen) from the other side of Hg(II) will share some electron density with Hg(II) and consequently this will reduce the overall stain on the –CN group due to combined electron cloud sharing with the oxygen centre towards Hg(II). Also there will be no covalent sharing between both centres. Considering all these postulates, sp hybridization will not undergo overall change to sp2, though it may be considered as distorted sp hybridization in the –CN group.
Furthermore, a detailed study of the titration profiles performed between fixed volumes of receptor 1 and 2 (2000 μL) with Hg(II) metal ion solutions shows a decrease in their absorbance maxima, with successive incremental addition of Hg(II) ion solution up to 1600 μL, with a red shift in the absorption maxima, as shown in Fig. 9(a) and (b).
 |
| Fig. 9 Photometric titration of (a) receptor 1 and (b) receptor 2 upon addition of incremental amounts of Hg(II) ion solution. | |
In between, the spectrophotometric response of receptor 1 and 2 towards various cations studied was recorded at 417 and 425 nm, respectively and is depicted in Fig. 10(a) and (b). It can be clearly seen that both receptors have shown good response towards Hg(II) ions which indicates selectivity of both receptors towards Hg(II) ions.
 |
| Fig. 10 Photometric response of (a) receptor 1 at 417 nm and (b) receptor 2 at 425 nm towards various cations. | |
Also, we have tackled the interference of other ions in Hg(II) binding with receptors 1 and 2. The graphs for this competition experiment are shown in Fig. 11(a) and (b), and indicate that the interference of other ions in Hg(II) ion recognition with the synthesized key scaffold is negligible.
 |
| Fig. 11 Effect of competitive cations on (a) the interaction between receptor 1 and Hg(II) ions and (b) the interaction between receptor 2 and Hg(II) ions. | |
The binding constant (Ka) for the formation of receptor 1·Hg(II) and receptor 2·Hg(II) was computed using Benesi–Hildebrand methodology [Fig. 12(a) and (b)].40
 |
| Fig. 12 Benesi–Hildebrand methodology depicting that (a) for receptor 1·Hg(II), association constant (Ka) = 2.53 × 10⁵ M−1 and (b) for receptor 2·Hg(II), association constant (Ka) = 0.99 × 10⁵ M−1. | |
Complex formation between receptors and Hg(II) can be represented by eqn (1).
|
Receptor + Hg(II) → receptor·Hg(II)
| (1) |
The corresponding binding constant Ka can be defined using eqn (2),
|
K = [receptor·Hg(II)]/[receptor][Hg(II)]
| (2) |
and can be determined using the Benesi–Hildebrand equation which is shown in
eqn (3);
|
1/ΔA = (1/(εKa))(1/[G]) + (1/ε)
| (3) |
where, [G] = total concentration of the receptor, Δ
A = absorbance difference between the absorbance of the initial Hg(
II) solution and absorbance after formation of the receptor·Hg(
II) complex at maximum wavelength
λ in nm,
Ka = binding constant for receptor·Hg(
II) complex formation,
ε = molar absorptivity of the receptor·Hg(
II) complex at maximum wavelength
λ in nm.
From eqn (3), a plot of x = 1/[G] vs. y = 1/ΔA gives a y-intercept = 1/ε and slope = (1/Kaε) which gives the value of Ka. Respective binding constants for complex formation between receptor 1 and receptor 2 with Hg(II) are 2.53 × 10⁵ M−1 and 0.99 × 10⁵ M−1 respectively. This difference in binding constants can be attributed to differences in resonance effect caused by extended straight chain alkyl groups present in receptor 1 and aromatic rings of receptor 2. In receptor 1, the presence of alkyl groups shows an electron donating resonance effect and results in an increase of the electron cloud over the cyano and carboxylic groups which ultimately results in stronger binding with Hg(II). Alternatively in receptor 2, three aromatic rings show more delocalisation of the electron cloud over these three rings and it decreases the electron cloud over the cyano and carboxylic groups, resulting in a decrease of the binding constant compared to receptor 1.
For determining the stoichiometry of receptor 1·Hg(II) and receptor 2·Hg(II), the Job’s plot continuous variation method was employed, which revealed a 1
:
1 stoichiometric equilibrium for both receptor 1·Hg(II) and receptor 2·Hg(II). The Job’s plots for receptor 1·Hg(II) and receptor 2·Hg(II) formation are shown in Fig. 13(a) and (b).
 |
| Fig. 13 Job’s plots for (a) receptor 1·Hg(II) and (b) receptor 2·Hg(II) formation. | |
The observation from the Job’s plots was also supported by the mole ratio and normalized plots depicted in S5, ESI,† showing the 1
:
1 stoichiometric complexation of Hg(II) with receptor 1 as well as receptor 2. Limit of Detection (LOD) and Limit of Quantification (LOQ) for receptor 1 were found to be 3.49 μM and 11.6 μM, respectively, and for receptor 2 LOD and LOQ were found to be 3.74 μM and 12.5 μM, respectively.
Table 3 compiles some recently reported methods for the change in absorbance maxima after the addition of Hg(II) and it was observed that a 7–11 nm shift of absorbance maxima was considered in the reported methods.39,41 Moreover some reported methods considered a decrease or increase in absorbance maxima and broadening of maxima peak.34,36,37,42 Table 3 also shows that the LOD values of the reported methods are comparable with our work.
Table 3 Comparison of some recently reported methods with the present work
Sr. no. |
Sensor |
Response in absorbance spectra after addition of Hg(II) |
LOD |
Ref. |
1 |
Vitamin B2 (riboflavin) stabilized Ag nanoparticle |
Decrease in absorption intensity by a factor of 7 |
5 nM |
34 |
2 |
Rhodamine B hydrazide (RBH) and rhodamine 6G hydrazide |
Increase in absorption band at approximately 525 nm |
2.4 × 10⁻⁷ M |
36 |
3 |
1,1′-(1,5,5-Trimethyl-3-oxocyclohexane-1,2-diyl)bis(3-(naphthalene-2-yl)urea) |
Decrease in the absorption maxima at 307 nm and 326 nm |
0.23 μM |
37 |
4 |
(E)-5-(Diethylamino)-2-((2-(phthalazine-1-yl)hydrazono)methyl)phenol |
Red-shift of 11 nm |
26.1 nM |
39 |
5 |
Fluorescein dithia-cyclic skeleton |
Red-shift of 7 nm |
7.38 × 10⁻⁹ M |
41 |
6 |
Chitosan–silver nanocomposite |
Reduction in the intensity and a blue shift on addition of higher concentrations of mercury |
7.2 × 10⁻⁸ M |
42 |
7 |
Papain and 2,6-pyridinedicarboxylic acid (PDCA) functionalized gold nanoparticles |
Absorption spectra became broader and shifted to a much longer wavelength (650 nm) |
9 nM |
43 |
8 |
(E)-2-Cyano-3-(4-((4-(1-hexyl-4,5-diphenyl-1H-imidazol-2-yl)phenyl)(phenyl)amino)phenyl)acrylic acid (receptor 1) (E)-2-cyano-3-(4-(phenyl(4-(1,4,5-triphenyl-1H-imidazol-2-yl)phenyl)amino)phenyl)acrylic acid (receptor 2) |
Red-shift of 17 and 23 nm for receptor 1 and receptor 2, respectively |
3.49 μM |
Present work |
Conclusion
We have designed and synthesized two novel D–π–A dyes containing imidazole derived structures with triphenylamine (TPA) as a donor and cyano acrylic groups acting as acceptors. Their spectral and photovoltaic properties were investigated systematically. The DSSC based on compound 1 with cholic acid obtained an efficiency of 0.222% (Jsc 0.754 mA cm−2, Voc 0.518 V, FF 0.57). The spectroscopic studies of receptors 1 and 2 show selectivity towards Hg(II) ions amongst different metal ions. Receptors 1 and 2 both show good association constants whereas the LODs and LOQs of both the receptors were found to be 3.49 μM, 11.6 μM and 3.74 μM, 12.5 μM, respectively. Findings from both applications revealed that the electron donating effect plays a prominent role. Considering applications of the synthesized dyes in both solar cells and sensing, these dyes can be used comprehensively in the future.
Acknowledgements
One of the authors (PPK) acknowledges UGC, New Delhi for the SAP (DSA-I) fellowship under the scheme ‘Research Fellowship in Sciences for Meritorious Students’.
References
- M. G. Gang, S. W. Shin, C. W. Hong, K. V. Gurav, J. Gwak, J. H. Yun, J. Y. Lee and J. H. Kim, Green Chem., 2016, 18, 700 RSC.
- P. Y. Ho, C. H. Siu, W. H. Yu, P. Zhou, T. Chen, C. L. Ho, L. T. L. Lee, Y. H. Feng, J. Liu, K. Han, Y. H. Lo and W. Y. Wong, J. Mater. Chem. C, 2016, 4, 713 RSC.
- B. O’Regan and M. Gratzel, Nature, 1991, 353, 737 CrossRef.
- W. G. Wang, H. Y. Zhang, R. Wang, F. Ming and Y. M. Chen, Nanoscale, 2014, 6, 2390 RSC.
- J. J. Fan, S. W. Liu and J. G. Yu, J. Mater. Chem., 2012, 22, 17027 RSC.
- J. G. Yu, J. J. Fan and K. Lv, Nanoscale, 2010, 2, 2144 RSC.
- J. G. Yu, Q. L. Li, J. J. Fan and B. Cheng, Chem. Commun., 2011, 47, 9161 RSC.
- M. Gratzel, Acc. Chem. Res., 2009, 42, 1788 CrossRef CAS PubMed.
- M. Ghavre, O. Byrne, L. Altes, P. K. Surolia, M. Spulak, B. Quilty, K. R. Thampi and N. Gathergood, Green Chem., 2014, 16, 2252 RSC.
- D. Liu, R. W. Fessenden, G. L. Hug and P. V. Kamat, J. Phys. Chem. B, 1997, 101, 2583 CrossRef CAS.
- P. Shen, Y. Tang, S. Jiang, H. Chen, X. Zheng, X. Wang, B. Zhao and S. Tan, Org. Electron., 2011, 12, 125 CrossRef CAS.
- N. Satoh, T. Nakashima and K. Yamamoto, J. Am. Chem. Soc., 2005, 127, 13030 CrossRef CAS PubMed.
- Q. Wang, S. M. Zakeeruddin, J. Cremer, P. Bauerle, R. H. Baker and M. Grätzel, J. Am. Chem. Soc., 2005, 127, 5706 CrossRef CAS PubMed.
- L. Zhou, C. Jia, Z. Wan, Z. Li, L. Zhang, J. Zhang and X. Yao, Dyes Pigm., 2012, 95, 743 CrossRef CAS.
- S. P. Singh, M. S. Roy, A. Thomas, K. Bhanuprakash and G. D. Sharma, Org. Electron., 2012, 13, 3108 CrossRef CAS.
- S. Wenger, P. A. Bouit, Q. Chen, J. Teuscher, D. D. Censo, R. H. Baker, J. E. Moser, J. L. Delgado, N. Martiń, S. M. Zakeeruddin and M. Gratzel, J. Am. Chem. Soc., 2010, 132, 5164 CrossRef CAS PubMed.
- K. Yan, X. Lu, Y. Qiu, Z. Liu, J. Sun, F. yan, W. Guo and S. Yang, Org. Lett., 2012, 14, 2214 CrossRef PubMed.
- N. Koumura, Z. S. Wang, S. Mori, M. Miyashita, E. Suzuki and K. Hara, J. Am. Chem. Soc., 2006, 128, 14256 CrossRef CAS PubMed.
- H. Im, S. Kim, C. Park, S. H. Jang, C. J. Kim, N. G. Park and C. Kim, Chem. Commun., 2010, 1335 RSC.
- C. Fan, X. Wang, P. Ding, J. Wang, Z. Liang and X. Tao, Dyes Pigm., 2012, 95, 757 CrossRef CAS.
- H. T. Akçay, R. Bayrak, Ü. Demirbas, A. Koca, H. Kantekin and I. Degirmencioglu, Dyes Pigm., 2013, 96, 483 CrossRef.
- P. P. Kumavat, A. D. Jangale, D. R. Patil, K. S. Dalal, J. S. Meshram and D. S. Dalal, Environ. Chem. Lett., 2013, 11, 177 CrossRef CAS.
- D. R. Patil, Y. B. Wagh, P. G. Ingole, K. Singh and D. S. Dalal, New J. Chem., 2013, 37, 3261 RSC.
- Y. A. Tayade, D. R. Patil, Y. B. Wagh, A. D. Jangale and D. S. Dalal, Tetrahedron Lett., 2015, 56, 666 CrossRef CAS.
- Y. A. Tayade, S. A. Padvi, Y. B. Wagh and D. S. Dalal, Tetrahedron Lett., 2015, 56, 2441 CrossRef CAS.
- P. P. Kumavat, P. K. Baviskar, B. R. Sankapal and D. S. Dalal, New J. Chem., 2016, 40, 634–640 RSC.
- P. K. Baviskar, W. Tan, J. Zhang and B. R. Sankapal, J. Phys. D: Appl. Phys., 2009, 42, 125108 CrossRef.
- X. Yin, W. Tan, J. Zhang, Y. Lin, X. Xiao, X. Zhou, X. Li and B. R. Sankapal, J. Appl. Electrochem., 2009, 39, 147 CrossRef CAS.
- P. K. Baviskar, J. B. Zhang, V. Gupta, S. Chand and B. R. Sankapal, J. Alloys Compd., 2012, 510, 33 CrossRef CAS.
- P. K. Baviskar, A. Ennaoui and B. R. Sankapal, Sol. Energy, 2014, 105, 445 CrossRef CAS.
- Y. B. Wagh, A. Kuwar, S. K. Sahoo, J. Gallucci and D. S. Dalal, RSC Adv., 2015, 5, 45528 RSC.
- L. Zhou, C. Jia, Z. Wan, X. Chen and X. Yao, Org. Electron., 2013, 14, 1755 CrossRef CAS.
- P. K. Baviskar, R. Gore, A. Ennaoui and B. R. Sankapal, Mater. Lett., 2014, 116, 91 CrossRef CAS.
- B. Roy, P. Bairi and A. K. Nandi, Analyst, 2011, 136, 3605 RSC.
- G. Chen, Z. Guo, G. Zeng and L. Tang, Analyst, 2015, 140, 5400 RSC.
- S. Kraithong, P. Damrongsak, K. Suwatpipat, J. Sirirak, P. Swanglap and N. Wanichacheva, RSC Adv., 2016, 6, 10401 RSC.
- K. Tayade, B. Bondhopadhyay, A. Basu, G. K. Chaitanya, S. K. Sahoo, N. Singh, S. Attarde and A. Kuwar, Talanta, 2014, 122, 16 CrossRef CAS PubMed.
- R. Patil, U. Fegade, R. Kaur, S. K. Sahoo, N. Singh and A. Kuwar, Supramol. Chem., 2015, 27, 527 CrossRef CAS.
- D. Mahajan, N. Khairnar, B. Bondhopadhyay, S. K. Sahoo, A. Basu, J. Singh, N. Singh, R. Bendre and A. Kuwar, New J. Chem., 2015, 39, 3071 RSC.
- S. R. Tetgure, A. U. Borse, B. R. Sankapal, V. J. Garole and D. J. Garole, Amino Acids, 2015, 47, 757 CrossRef CAS PubMed.
- P. Piyanuch, S. Watpathomsub, V. S. Lee, H. A. Nienaber and N. Wanichacheva, Sens. Actuators, B, 2016, 224, 201 CrossRef CAS.
- E. A. K. Nivethaa, V. Narayanan and A. Stephen, Spectrochim. Acta, Part A, 2015, 143, 242 CrossRef CAS PubMed.
- C. Lai, L. Qin, G. Zeng, Y. Liu, D. Huang, C. Zhang, P. Xu, M. Cheng, X. Qin and M. Wang, RSC Adv., 2016, 6, 3259 RSC.
Footnote |
† Electronic supplementary information (ESI) available. See DOI: 10.1039/c6ra18712a |
|
This journal is © The Royal Society of Chemistry 2016 |
Click here to see how this site uses Cookies. View our privacy policy here.