DOI:
10.1039/C6RA20502J
(Paper)
RSC Adv., 2016,
6, 106465-106472
3D reticulate CoxNi3−xS2 nanostructure on nickel foam as a new type of electroactive material for high-performance supercapacitors†
Received
14th August 2016
, Accepted 27th October 2016
First published on 27th October 2016
Abstract
3D reticulate CoxNi3−xS2 nanostructures were grown on nickel foam using a simple precursor sulfuration route. Compared with monometallic Ni3S2, the introduction of an appropriate content of Co could markedly improve electrochemical properties. Also, the electrochemical performance of as-prepared CoxNi3−xS2 nanostructures could be tuned by the Co content added to the Ni3S2. The investigation showed that 3D CoxNi3−xS2 nanostructures prepared from the system with initial Co2+/Ni2+ molar ratio of 2/1 (labeled as S2/1) exhibited the best energy storage properties. At a current density of 2 mA cm−2, the areal capacitance of S2/1 reached 3030 mF cm−2; and even at a current density of 30 mA cm−2, the areal capacitance reached 2268 mF cm−1. After 6500 cycles at a current density of 5 mA cm−2, the capacitance retention retained 92.8% of the initial value, exhibiting excellent cycling stability. After 3D reticulate S2/1 nanostructures were fabricated into an asymmetrical supercapacitor with activated carbon, the energy density achieved 73.5 W h kg−1 at a power density of 600 W kg−1; and at high power density of 3024.06 W kg−1, the energy density could still reach 50.04 W h kg−1, which presents potential applications for energy storage as a high performance electrode material.
1. Introduction
The rapid development of industrialization means that demand for energy resources is dramatically increasing. However, fossil fuels such as oil and coal are gradually being exhausted. Therefore, it has become extremely urgent to explore environmentally friendly and alternative new energy sources. Although clean energy sources such as wind, solar, and geothermal are attractive, they strongly depend on natural conditions, which limits their work efficiency. Capacitors with high energy density would be useful to promote application of such clean energy sources. There has been extensive research interest in recent years on supercapacitors (SCs) with long cycle-life, high power density, and fast charge/discharge capability.1–3
Electrode materials are the most important component of supercapacitors. Hence, in attempts to achieve excellent electrochemical performance, great efforts have been focused on identifying new electrode materials with high capacity or/and designing optimal electrode architectures.4 As one of the most prominent candidates of electrode materials for lithium ion batteries (LIBs) and SCs, transition metal sulfides have attracted much attention as they have higher electrical conductivity than oxides, larger specific capacitance than carbon-based electrodes, and longer cycle performance than conducting polymers.5 Among various transition metal sulfides, nickel or cobalt sulfides such as NixSy,6–9 CoxSy,10–12 and some emerging metal sulfides such as MoS2,13 VS2,14 and bimetallic NiCo2S4,15,16 offer varieties of compositions, low cost, and excellent electrochemical performance. In particular, Ni3S2 has attracted increased interest because of its high theoretical specific capacitance in high-performance SCs17 and LIBs.18,19 When used as an electrode material, however, Ni3S2 bears poor electrical conductivity and rate capability, which limits the charge–discharge rate of SCs.20 To improve electrical conductivity and rate capability, series of composites have been formed using Ni3S2 and highly conductive materials such as carbon-based materials, metals, and metal oxides.21–23 For example, Dai and coworkers hydrothermally synthesized hierarchical Ni3S2/carbon nanotube composites and investigated their electrochemical performances. The as-obtained composites exhibited a high specific capacitance of 800 F g−1 and great cycling stability at a current density of 3.2 A g−1.24 Xing et al. prepared ZnO@Ni3S2 arrays through an electrodeposition route and found that the as-prepared arrays displayed high specific capacitance of 1529 F g−1 at a current density of 2 A g−1, and good rate capability and cycling stability.19
It is well known that the property of a material can be enhanced by proactively introducing certain impurities. When Ni element in Ni3S2 is partly substituted by other metal elements, a new freedom degree is endowed for optimization of the electrical conductivity and electrochemical activity.25 Thus, doping offers another useful approach to improve the electrochemical properties of Ni3S2. In this study, a simple precursor sulfuration route was designed to successfully prepare 3D reticulate CoxNi3−xS2 nanostructures grown on nickel foam. It was found that the electrochemical performances of CoxNi3−xS2 nanostructures varied with changes in the amount of cobalt introduced into the Ni3S2. 3D CoxNi3−xS2 nanostructures prepared from the system with initial Co2+/Ni2+ molar ratio of 2/1 (labeled as S2/1) presented the best energy storage properties. The areal capacitance reached 3030 mF cm−2 at a current density of 2 mA cm−2; and even at a current density of 30 mA cm−2, the areal capacitance reached 2268 mF cm−1. After cycling for 6500 times at a current density of 5 mA cm−2, there was 92.8% capacitance retention (against the initial value), exhibiting an excellent cycling stability. After assembling an asymmetrical supercapacitor with 3D reticulate S2/1 and activated carbon, the energy density achieved 73.50 W h kg−1 at a power density of 600 W kg−1, and even at a power density of 3024.06 W kg−1, the energy density achieved 50.04 W h kg−1. Compared with some previous reports,23,26,27 the present asymmetrical capacitor possesses bigger energy density and power density. Also, its potential window was 1.6 V, higher than those of MoS2 (0.8 V)28 and NiCo2S4 (1.5 V).29
2. Experimental
Materials
All reagents and chemicals were analytically pure, bought from the Shanghai Chemical Company and used without further purification.
Synthesis of 3D reticulate CoxNi3−xS2 nanostructures on nickel foam
The synthesis of CoxNi3−xS2 on nickel foam was realized through a two-step hydrothermal method. Before hydrothermal reactions, a piece of nickel foam (2 cm × 3 cm) was treated with 3 M HCl for 15 min to remove the oxide layer and then washed thoroughly with deionized water and ethanol. In a typical procedure, CoSO4·7H2O and NiSO4·6H2O with varying molar ratios of 3
:
0, 2
:
1, 1.5
:
1.5, 1
:
2, and 0
:
3 were first dissolved in a mixed solvent of 28 mL deionized water and 7 mL ethanol. Then, 10 mmol urea (CO(NH2)2) and 0.05 g PVP were added under magnetic stirring. After the as-obtained pale-pink solution was transferred to a Teflon-lined stainless-steel autoclave with a capacity of 50 mL, the nickel foam was placed into the autoclave. Thereafter, the system was heated at 100 °C for 12 h. Nickel foam with pink matter on its surface was taken out and washed with deionized water and ethanol several times. Subsequently, nickel foam loaded by the precursor was transferred to another 50 mL autoclave with 35 mL 0.05 mol L−1 of Na2S solution. The sulfuration reaction was carried out at 140 °C for 8 h. After the autoclave was cooled to room temperature naturally, nickel foam with black matter on the surface was taken out and washed with deionized water and ethanol several times; and finally dried in a vacuum at 60 °C for 10 h. The as-prepared samples were separately denoted S3/0, S2/1, S1.5/1.5, S1/2, and S0/3. The masses of CoxNi3−xS2 loading the surface of Ni foam (1.0 cm × 1.0 cm) were, in turn, 1.4, 1.5, 1.7, 2.0, and 2.2 mg.
Characterization
The X-ray powder diffraction patterns of the products were carried out on a BRUKER D8 ADVANCE X-ray diffractometer equipped with Cu Kα radiation (λ = 0.154060 nm), employing a scanning rate of 5 °s−1 and 2θ ranges from 10° to 80°. Transmission electron microscopy (TEM) images were carried out on a Hitachi HT7700 transmission electron microscope, employing an accelerating voltage of 100 kV. SEM images and EDS analysis of the product were obtained using a Hitachi S-4800 field emission scanning electron microscope, employing an accelerating voltage of 5 kV and 15 kV, respectively. X-ray photoelectron spectroscopy (XPS) of the product was obtained on a Thermo ESCALAB 250 instrument, employing monochromic Al Kα (hν = 1486.6 eV) at a power of 150 W.
Electrochemical performance
For the electrochemical measurements, CoxNi3−xS2 loaded on nickel foam at a size of 1.0 cm × 1.0 cm directly acted as the working electrode, and a platinum wire and an Hg/HgO electrode acted as the counter and reference electrodes, respectively. A 3 M KOH aqueous solution acted as the electrolyte.
To fabricate an all-solid-state asymmetric supercapacitor, CoxNi3−xS2 loaded on nickel foam at a size of 1.0 cm × 1.0 cm was directly used as the positive electrode. The negative electrode was prepared by mixing active carbon, acetylene black, and poly-tetrafluoroethylene (PVDF) in a mass ratio of 80
:
10
:
10 to obtain a slurry.23 Then the slurry was pressed onto a piece of nickel foam (1.0 cm × 1.0 cm) and dried at 60 °C for 12 h. The positive and negative electrodes were put together and separated by a piece of cellulose paper separator that had been soaked in 3 M KOH aqueous solution.
3. Results and discussion
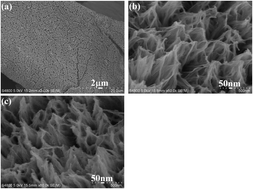
The surface shape changes of Ni foam before and after depositing the precursor were observed by SEM technology. As shown in Fig. S1,† the surface of pure Ni foam is smooth; however, after the precursor had been deposited, the surface of Ni foam had a porous structures (Fig. 1a). Further enlargement in Fig. 1b showed that the porous structures were reticulate and constructed by abundant nanosheets. Although different initial molar ratios of Co/Ni were used, all of the as-obtained precursors exhibited similar reticulate structures. After the precursors had been sulfurized by Na2S, the reticulate structures could still be maintained (see Fig. S2†). Fig. 1c shows a high magnification SEM image of the product after the precursor had been sulfurized by Na2S. The surfaces of the final product are slightly rougher than those of the precursor (see Fig. 1b). Fig. S3† shows the XRD patterns of five samples. Three strong diffraction peaks, centered at 44.6°, 52.0°, and 76.4°, come from metallic Ni. The other weak ones separately match with data of cubic Co3S4 (for S3/0, PDF card files no. 47-1738) and rhombohedral Ni3S2 (for S2/1, S1.5/1.5, and S1/2, PDF card files no. 44-1418). As cubic Co3S4 and rhombohedral Ni3S2 have close diffraction patterns, EDS technology was employed for composition analysis of S2/1, S1.5/1.5, and S1/2 samples. As shown in Fig. S4,† Co and Ni peaks can be detected simultaneously in the three samples. The integrated Co content in S2/1, S1.5/1.5, and S1/2 is, in turn, 31.7%, 26.9%, and 14.5%. S2/1 bears the highest Co content. Fig. 2 compares the diffraction patterns of S2/1 and S0/3 after removing the Ni foam. The two samples have the same peak sites but different diffraction intensities, implying that introduction of cobalt ions does not markedly vary the phase of Ni3S2. Fig. 3a gives a typical TEM image of S2/1, on which wrapped nanosheets can be seen. A HRTEM image is shown in Fig. 3b. Some lattice fringes can be seen clearly, implying good crystallinity of nanosheets. The ED pattern in the inset of (b) displays clear concentric rings, indicating the polycrystalline nature of nanosheets. Furthermore, the d-spacings of neighboring planes are measured to be 0.29 nm and 0.24 nm, which are separately close to 0.2873 nm of the (110) plane and 0.23793 nm of the (003) plane of rhombohedral Ni3S2. These results prove that the phase of Ni3S2 is not markedly changed by integration of Co(II), which should be attributed to the close ion radius of Co2+ and Ni2+.
 |
| Fig. 1 (a) A typical SEM image of Ni foam loading the precursor on its surface, (b) an enlarged SEM image of the precursor, and (c) a representative SEM image of the product obtained after sulfuration of the precursor. | |
 |
| Fig. 2 XRD patterns of S2/1 and S0/3 after Ni foam was removed. | |
 |
| Fig. 3 (a) TEM image and (b) HRTEM image of S2/1 prepared with original Co2+/Ni2+ molar ratio of 2 : 1. The inset in (b) is the SAED pattern of S2/1. | |
It is well known that urea can react with water to produce NH3 and CO2 (see eqn (1)) under hydrothermal conditions. Subsequently, CO32− ions are formed rapidly because of reaction between the produced NH3 and CO2 (see eqn (2)). When some metal ions exist in the solution, it is probable that precipitates of metal carbonates are formed owing to their low solubility in water.30,31 Therefore, under the present hydrothermal conditions, the precursor could be obtained because of co-precipitation of cobalt carbonate and nickel carbonate (see eqn (3)). As Ni foam was present in the system, the precursor gradually nucleated and grew on the surface of the Ni foam, and, with the assistance of PVP, reticulate structures were finally formed.
|
CO(NH2)2 + H2O = CO2 + 2NH3
| (1) |
|
CO2 + 2NH3 + H2O = CO32− + 2NH4+
| (2) |
|
Co2+/Ni2+ + CO32− = Co(Ni)CO3
| (3) |
Electrochemical performance
To investigate the electrochemical performance of products prepared from systems with various original Co2+/Ni2+ molar ratios, the CV curves of S3/0, S2/1, S1.5/1.5, S1/2, and S0/3 were measured at a scan rate of 10 mV s−1. As shown in Fig. 4a, when only Ni2+ or Co2+ ion existed in the system, a pair of marked redox peaks separately appeared at 0.3–0.44 V for S0/3 and 0.29–0.48 V for S3/0, implying the presence of a reversible faradaic reaction. When Ni2+ or Co2+ ion coexisted in the system, two pairs of redox peaks appeared, attributed to redox reactions between Ni2+/Ni3+, Co2+/Co3+, and Co3+/Co4+.32,33 Compared with S3/0 and S0/3, S2/1, S1.5/1.5, and S1/2 displayed better electrochemical property. Among them, S2/1 showed the biggest peak currents and CV area. Fig. 4b shows the charge–discharge curves of five samples at 10 mA cm−2 and the correlations between specific capacity and current density (see the inset in (b)). One can clearly see that S2/1 also presents the best charge–discharge capacity and the highest specific capacity. These results confirm that S2/1 shows the best electrochemical performance. In this study, the loading masses on nickel foam of 1.0 cm × 1.0 cm were 1.4 mg (S3/0), 1.5 mg (S2/1), 1.7 mg (S1.5/1.5), 2.0 mg (S1/2), and 2.2 mg (S0/3). The loading mass increased with decreasing Co/Ni molar ratio in the solution. Generally, the loading mass has positive influence on the electrochemical performance of the electrode. However, although S2/1 had lower loading mass than S1.5/1.5, S1/2, and S0/3, and higher loading mass than S3/0, it displayed the best areal capacitance of all the samples. Clearly, loading mass was not the main factor affecting electrochemical performance of the electrode. Recently, Li and coworkers suggested that coexistence of different elements with varied chemical valence states could cause self-doping to occur to optimize the electrical conductivity and electrochemical activity.34 In Ni–Co sulfides, Ni and Co species with higher valence states can be formed under electrochemical conditions. Theoretically, the presence of Ni3+ provides extra electrons as n-type doping whereas the presence of Co3+ will result in extra holes as p-type doping.35 Therefore, more Ni3+ and Co3+ will lead to higher electrical conductivity for electrons and better electrochemical performance. Therefore, the synergistic effect of cobalt and nickel in the present work is likely to be the main factor affecting the electrochemical performance of the electrode.
 |
| Fig. 4 (a) CV curves of S3/0, S2/1, S1.5/1.5, S1/2, and S0/3 at 10 mV s−1, and the inset in (a) shows the galvanostatic charge–discharge plots of S3/0, S2/1, S1.5/1.5, S1/2, and S0/3 at a current density of 10 mA cm−2. (b) Effects of the current density of various samples on their specific capacitances. | |
Fig. 5 shows high resolution Ni 2p and Co 2p XPS analyses of S2/1. Utilizing the Gaussian fitting method, the Ni 2p spectrum is well fitted with two spin–orbit doublets and two satellite peaks (see Fig. 5a). The Co 2p spectrum presents similar results (see Fig. 5b). In the Ni 2p spectrum, the peaks at 855.4 eV and 873.0 eV, as well as satellite peaks at 861.2 and 879.1 eV, are separately attributed to Ni 2p3/2 and Ni 2p1/2. In the Co 2p spectrum, the binding energies at 777.9 and 796.3 eV of the Co 2p peaks are assigned to Co3+, and the binding energies at 780.9 and 802.2 eV to Co2+.34 The above results are similar to those in Li's report,34 indicating the presence of Ni2+, Ni3+, Co2+, and Co3+ in the product.
 |
| Fig. 5 High resolution Ni 2p (a) and Co 2p (b) XPS spectra of S2/1. | |
Fig. 6a shows the CV curves of S2/1 in the potential window from −0.2 to 0.7 V at scan rates from 5 to 50 mV s−1. With increasing scan rate, the redox currents increase. The oxidation and reduction peaks separately shift towards higher and lower potentials, which is attributed to the increase of the internal diffusion resistance.36,37 Fig. 6b depicts the galvanostatic charging–discharging curves of S2/1 at a current density of 2–20 mA cm−2. The corresponding specific capacitances can be calculated according to the below equations:38
|
 | (4) |
|
 | (5) |
where
Ca (mF cm
−2) and
Cm (F g
−1) separately stand for the areal and mass specific capacitance;
I (A) and Δ
t (s) are in turn the discharge current and time;
S (cm
2) and
m (g) represent the areal and mass of the active material; and Δ
V (V) is the potential window for the charge–discharge process. Based on
eqn (4) and
(5), the areal/mass specific capacitance of S2/1 reaches 3030 mF cm
−2/2020 F g
−1 at a current density of 2 mA cm
−2, and 74.8% of the capacity is maintained with increase of the current density from 2 to 30 mA cm
−2, implying good rate capability.
Fig. 6c exhibits the change of the specific capacitance with cycle time. The specific capacitance increases with increase of the cycle time from 0 to 1200, which is ascribed to the activating process of the electrode. Subsequently, the specific capacitance of the electrode decreases with increase of the cycle time to 6500. Herein, the capacitance is retained at 92.8% of the initial value, indicating that S2/1 has outstanding capacitance retention. Furthermore, the inset given in
Fig. 6c shows the Nyquist plots of S2/1 at the first cycle and after 200 cycles in a frequency range of 100
![[thin space (1/6-em)]](https://www.rsc.org/images/entities/char_2009.gif)
000–0.01 Hz. The similar diameters of the semicircles indicate high stability of the electrode, implying that S2/1 is a promising material for application in electrochemical energy storage.
 |
| Fig. 6 (a) CV curves of S2/1 at scan rates from 5 mV s−1 to 50 mV s−1, (b) the GCD plots of S2/1 at current densities between 2 and 20 mA cm−2, and (c) the cycling performance of S2/1 at a constant current density of 5 mA cm−2. The inset in (c) is Nyquist plots of S2/1 at the 1st and the 200th cycles. | |
To explore practical applications of the as-prepared S2/1, an asymmetric supercapacitor was fabricated using S2/1 sample as the positive electrode and activated carbon as the negative one in a 3 M KOH solution. Mass loading of active materials on the positive electrode and negative electrode was 1.6 mg and 10.2 mg, respectively. The mass ratio (m+/m−) of the positive and negative materials was calculated to 0.1568. According to the charge balance mechanism,39 the loading mass of materials on positive and negative electrodes can be controlled precisely. The corresponding formula is shown in eqn (6):
|
 | (6) |
where
m+/− are the loading masses of materials on positive and negative electrodes;
C+/− and Δ
E+/− stand for mass specific capacitances and potential windows of the positive and negative electrodes. In the current work, activated carbon (AC) is used as the negative material and shows a specific capacitance of 185 F g
−1 at a current density of 1 A g
−1 (see Fig. S5
†).
Fig. 7a depicts the CV curves of S2/1 and activated carbon at a scan rate of 50 mV s−1 in a three-electrode system. The potential windows of activated carbon and S2/1 are, in turn, 1.0 V and 0.7 V. According to the specific capacitances and potential windows of CV curves, the mass ratio (m+/m−) of the positive and the negative materials is 0.156, which is in good agreement with the practical mass ratio. Simultaneously, the working voltage of S2/1-AC cell can be expanded to 1.6 V because of different working potentials of activated carbon and S2/1. Fig. 7b shows the CV plots of the S2/1-AC asymmetric supercapacitor at different scan rates. The CV curves are located in the range of 0–1.6 V, which is also confirmed by GCD curves at different current densities (see Fig. 7c). According to the present GCD curves, however, a low coulombic efficiency is obtained. This could be caused by electrolysis of the solvent under high potentials. In Fig. 7c, a platform appears in the region of 1.5–1.6 V, resulting from electrolysis of the solvent. After tuning the potential window to 0–1.5 V, the platform disappears and the coulombic efficiency can be markedly increased (see Fig. S6†). The specific capacitance values are calculated to be 827, 806, 739, 638, and 563 F g−1 at current densities of 3, 5, 7, 10, and 15 A g−1 (see Fig. 7d). The inset shown in Fig. 7d shows the cycle performance of the S2/1-AC asymmetric supercapacitor at a current density of 15 A g−1. After cycling 2000 times, the specific capacity is retained at ∼71%, implying good stability of the present S2/1-AC asymmetric supercapacitor. In the present work, the 3D porous material was directly grown on the Ni foam as binder-free electrodes. Thus, highly accessible electro-active sites, fast diffusion of the electrolyte ions, and access of fast ion transport could be easily achieved.40,41 Furthermore, the synergistic effect of cobalt and nickel in the active material also promoted the electrochemical properties. Hence, good stability was obtained. The corresponding energy density and power density of the asymmetric supercapacitor can be calculated using the eqn (7) and (8):42,43
|
 | (7) |
|
 | (8) |
where
C represents the specific capacitance of the asymmetric supercapacitor, Δ
V is the operating voltage of the device, and
t is the discharge time. According to the GCD measurement, S2/1-AC asymmetric supercapacitors present a high energy density of 73.50 W h kg
−1 at a power density of 600 W kg
−1, and even at a power density of 3024.06 W kg
−1, the energy density still reaches 50.04 W h kg
−1. Compared with some previous reports (see
Table 1), the present hybrid supercapacitors deliver higher energy density than some asymmetric supercapacitors based on Ni–Co sulfides.
 |
| Fig. 7 (a) CV curves of activated carbon and S2/1 at a scan rate of 50 mV s−1 in a three-electrode system. Electrochemical measurements of the S2/1-AC asymmetric supercapacitors: (b) CV curves at various scan rates; (c) charge–discharge curves at different current densities; (d) effects of the current density on the specific capacitance. The inset in (d) is the cycle performance of the asymmetric supercapacitor at a current density of 15 A g−1. | |
Table 1 Comparison of the electrochemical performances of the present work with some previous reports
Materials |
Specific capacitance (F g−1) |
Energy density (W h kg−1) |
Power density (W kg−1) |
Ref. |
CoNi2S4–AC |
762 F g−1 at 10 mA cm−1 |
33.9 |
409 |
1 |
NiCo2S4–RGO–AC |
197 F g−1 at scan rate of 5 mV s−1 |
31.5 |
156.6 |
23 |
NiCo2S4@Ni3V2O8//AC |
116.7 F g−1 at 1 A g−1 |
42.7 |
200 |
26 |
NiCo2S4//AC |
1471 F g−1 at 1 A g−1 |
44.8 |
401 |
27 |
NiSrGO–AC |
79.7 F g−1 at 0.2 A g−1 |
18.7 |
124 |
44 |
Ni3S2@CoS–AC |
270 F g−1 at 4 mA cm−1 |
28.24 |
134.46 |
45 |
CoxNi3−xS2–AC |
827 F g−1 at 3 A g−1 |
73.5 |
600 |
This work |
Fig. 8 depicts the EIS of the as-assembled asymmetric capacitor before and after 2000 cycles. Each Nyquist plot consists of a semicircle in the high-frequency region and a straight line in the low-frequency one. Although the Nyquist plots have obviously changed before and after 2000 cycles, they have similar equivalent circuits (see the inset of Fig. 8), composed of a bulk solution resistance (Rs), a charge-transfer resistance (Rct), a pseudocapacitive element (C), and a constant phase element for the double-layer capacitance (CPE). The Rct before and after 2000 cycles is calculated to be 0.52 Ω and 1 Ω, respectively, with the increase in the Rct attributed to structure collapse of the sample.
 |
| Fig. 8 Electrochemical impedance spectra (EIS) of the asymmetric capacitor assembled by S2/1 and activated carbon before and after 2000 cycles. The inset is the equivalent circuit. | |
4. Conclusion
In summary, CoxNi3−xS2 with different Ni and Co ratios was synthesized by a facile precursor sulfuration method on Ni foam. It was found that introduction of Co2+ ion into Ni3S2 improved its specific capacity, rate performance, and cyclic stability. The excellent electrochemical performance of CoxNi3−xS2 is attributed to its 3D reticulate structure and the synergistic effect between Ni and Co ions in sulfides. In particular, CoxNi3−xS2 obtained from the system containing Co2+/Ni2+ molar ratio of 2/1 showed the best electrochemical performance, the highest specific capacitance, and excellent rate capability and cycling stability. An asymmetric supercapacitor prepared by S2/1 and activated carbon exhibited high specific capacitance values of 827, 806, 739, 638, and 563 F g−1 at current densities of 3, 5, 7, 10, and 15 A g−1, respectively; and good cycle stability. After cycling 2000 times at a current density of 15 A g−1, the specific capacity retained ∼71%. Furthermore, the as-prepared asymmetric supercapacitor had a high energy density of 73.50 W h kg−1 at a power density of 600 W kg−1, and even at a power density of 3024.06 W kg−1, the energy density still reached 50.04 W h kg−1. The as-obtained 3D reticulate CoxNi3−xS2 superstructures have potential application in energy storage as high performance electrode materials.
Acknowledgements
The authors thank the National Natural Science Foundation of China (21571005) and High School Leading talent incubation program of Anhui province (gxbjZD2016010) for the funding support.
References
- W. Hu, R. Q. Chen, W. Xie, L. L. Zou, N. Qin and D. H. Bao, ACS Appl. Mater. Interfaces, 2014, 6, 19318–19326 CAS.
- Y. F. Zhang, C. C. Sun, H. Q. Su, W. Huang and X. C. Dong, Nanoscale, 2015, 7, 3155–3163 RSC.
- C. Liu, Z. Yu, D. Neff, A. Zhamu and B. Z. Jang, Nano Lett., 2010, 10, 4863–4868 CrossRef CAS PubMed.
- G. P. Wang, L. Zhang and J. J. Zhang, Chem. Soc. Rev., 2012, 41, 797–828 RSC.
- B. H. Qu, Y. J. Chen, M. Zhang, L. L. Hu, D. N. Lei, B. G. Lu, Q. H. Li, Y. G. Wang, L. B. Chen and T. H. Wang, Nanoscale, 2012, 4, 7810–7816 RSC.
- Z. Zhang, Z. Y. Huang, L. Ren, Y. Z. Shen, X. Qi and J. X. Zhong, Electrochim. Acta, 2014, 149, 316–323 CrossRef CAS.
- Y. J. Ruan, J. J. Jiang, H. Z. Wan, X. Ji, L. Miao, L. Peng, B. Zhang, L. Lv and J. Liu, J. Power Sources, 2016, 301, 122–130 CrossRef CAS.
- L. N. Wang, J. J. Liu, L. L. Zhang, B. S. Dai, M. Xu, M. W. Ji, X. S. Zhao, C. B. Cao, J. T. Zhang and H. S. Zhua, RSC Adv., 2015, 5, 8422–8426 RSC.
- C. W. Lee, S. D. Seo, H. K. Park, S. B. Park, H. J. Song, D. W. Kim and K. S. Hong, Nanoscale, 2015, 7, 2790–2796 RSC.
- S. J. Peng, X. P. Han, L. L. Li, Z. Q. Zhu and F. Y. Cheng, Small, 2016, 12(10), 1359–1368 CrossRef CAS PubMed.
- S. G. Liu, C. P. Mao, Y. B. Niu, F. L. Yi, J. K. Hou, S. Y. Lu, J. Jiang, M. W. Xu and C. M. Li, ACS Appl. Mater. Interfaces, 2015, 7, 25568–25573 CAS.
- W. H. Shi, J. X. Zhu, X. H. Rui, X. H. Cao, C. L. Chen, H. Zhang, H. H. Hng and Q. Y. Yan, ACS Appl. Mater. Interfaces, 2012, 4, 2999–3006 CAS.
- X. Y. Chia, A. Y. S. Eng, A. Ambrosi, S. M. Tan and M. Pumera, Chem. Rev., 2015, 115, 11941–11966 CrossRef CAS PubMed.
- J. Feng, X. Sun, C. Z. Wu, L. L. Peng, C. W. Lin, S. L. Hu, J. L. Yang and Y. Xie, J. Am. Chem. Soc., 2011, 133, 17832–17838 CrossRef CAS PubMed.
- M. Sun, J. J. Tie, G. Cheng, T. Lin, S. M. Peng, Z. Deng, F. Ye and L. Yu, J. Mater. Chem. A, 2015, 3, 1730–1736 CAS.
- J. W. Xiao, L. Wan, S. H. Yang, F. Xiao and S. Wang, Nano Lett., 2014, 14, 831–838 CrossRef CAS PubMed.
- X. W. Ou, L. Gan and Z. T. Luo, J. Mater. Chem. A, 2014, 2, 19214–19220 CAS.
- D. Li, X. W. Li, X. Y. Hou, X. L. Sun, B. L. Liu and D. Y. He, Chem. Commun., 2014, 50, 9361–9364 RSC.
- Z. C. Xing, Q. X. Chu, X. B. Ren, C. J. Ge, A. H. Qusti, A. M. Asiri, A. O. Al-Youbi and X. P. Sun, J. Power Sources, 2014, 245, 463–467 CrossRef CAS.
- W. Zhou, W. Chen, J. Nai, P. Yin, C. Chen and L. Guo, Adv. Funct. Mater., 2010, 20, 3678–3683 CrossRef CAS.
- J. L. Zhu, Y. Y. Li, S. Kang, X. L. Wei and P. K. Shen, J. Mater. Chem. A, 2014, 2, 3142–3147 CAS.
- W. J. Zhou, X. H. Cao, Z. Y. Zeng, W. H. Shi, Y. Y. Zhu, Q. Y. Yan, H. Liu, J. Y. Wang and H. Zhang, Energy Environ. Sci., 2013, 6, 2216–2221 CAS.
- W. T. Wei, L. W. Mi, Y. Gao, Z. Zheng, W. H. Chen and X. X. Guan, Chem. Mater., 2014, 26, 3418–3426 CrossRef CAS.
- C. S. Dai, P. Y. Chien, J. Y. Lin, S. W. Chou, W. K. Wu, P. H. Li, K. Y. Wu and T. W. Lin, ACS Appl. Mater. Interfaces, 2013, 5, 12168–12174 CAS.
- Y. X. Xu, Z. Y. Lin, X. Zhong, X. Q. Huang, N. O. Weiss, Y. Huang and X. F. Duan, Nat. Commun., 2014, 5, 5554–5556 CrossRef PubMed.
- L. Y. Niu, Y. D. Wang, F. P. Ruan, C. Shen, S. Chan, M. Xu, Z. K. Sun, C. Li, X. J. Liu and Y. Y. Gong, J. Mater. Chem. A, 2016, 4, 5669–5677 CAS.
- Y. L. Xiao, Y. Lei, B. Z. Zheng, L. Gu, Y. Y. Wang and D. Xiao, RSC Adv., 2015, 5, 21604–21613 RSC.
- K. Krishnamoorthy, P. Pazhamalai, G. K. Veerasubramani and S. J. Kim, J. Power Sources, 2016, 321, 112–119 CrossRef CAS.
- W. Kong, C. C. Lu, W. Zhang, J. Pu and Z. C. Wang, J. Mater. Chem. A, 2015, 3, 12452–12460 CAS.
- N. N. Xiang, Y. H. Ni and X. Ma, Chem.–Asian J., 2015, 10, 1972–1978 CrossRef CAS PubMed.
- H. S. Zheng, Y. H. Ni, F. Y. Wan and X. Ma, RSC Adv., 2015, 5, 31558–31565 RSC.
- G. Yang, L. W. Mi, W. T. Wei, S. Z. Cui, Z. Zheng, H. W. Hou and W. H. Chen, ACS Appl. Mater. Interfaces, 2015, 7, 4311–4319 Search PubMed.
- H. C. Chen, J. J. Jiang, L. Zhang, H. Z. Wan, T. Qi and D. D. Xia, Nanoscale, 2013, 5, 8879–8883 RSC.
- X. M. Li, Q. G. Li, Y. Wu, M. C. Rui and H. B. Zeng, ACS Appl. Mater. Interfaces, 2015, 7, 19316–19323 CAS.
- X. Wang, C. Y. Yan, A. Sumboja, J. Yan and P. S. Lee, Adv. Energy Mater., 2014, 4, 1301240–1301246 CrossRef.
- J. Y. Ji, L. L. Zhang, H. X. Ji, Y. Li, X. Zhao, X. Bai, X. B. Fan, F. B. Zhang and R. S. Ruoff, ACS Nano, 2013, 7, 6237–6243 CrossRef CAS PubMed.
- U. Patil, K. Gurav, V. Fulari, C. Lokhande and O. S. Joo, J. Power Sources, 2009, 188, 338–342 CrossRef CAS.
- H. C. Chen, J. J. Jiang, L. Zhang, D. D. Xia, Y. D. Zhao, D. Q. Guo, T. Qi and H. Z. Wan, J. Power Sources, 2014, 254, 249–257 CrossRef CAS.
- J. H. Zhu, J. Jiang, Z. P. Sun, J. S. Luo, Z. X. Fan, X. T. Huang, H. Zhang and T. Yu, Small, 2014, 14, 2937–2945 CrossRef PubMed.
- W. B. Fu, Y. L. Wang, W. H. Han, Z. M. Zhang, H. M. Zha and E. Q. Xie, J. Mater. Chem. A, 2016, 4, 173–182 CAS.
- G. K. Veerasubramani, K. Krishnamoorthy and S. J. Kim, J. Power Sources, 2016, 306, 378–386 CrossRef CAS.
- Y. D. Wang, C. Shen, L. Y. Niu, R. Z. Li, H. T. Guo, Y. X. Shi, C. Li, X. J. Liu and Y. Y. Gong, J. Mater. Chem. A, 2016, 4, 9977–9985 CAS.
- W. Li, S. L. Wang, L. P. Xin, M. Wu and X. J. Lou, J. Mater. Chem. A, 2016, 4, 7700–7709 CAS.
- F. Cai, R. Sun, Y. R. Kang, H. Y. Chen, M. H. Chen and Q. W. Li, RSC Adv., 2015, 5, 23073–23079 RSC.
- R. Li, S. L. Wang, J. P. Wang and Z. C. Huang, Phys. Chem. Chem. Phys., 2015, 17, 16434–16442 RSC.
Footnote |
† Electronic supplementary information (ESI) available. See DOI: 10.1039/c6ra20502j |
|
This journal is © The Royal Society of Chemistry 2016 |
Click here to see how this site uses Cookies. View our privacy policy here.