Effect of guests on the adsorption interaction between a hydrate cage and guests

Chanjuan Liuab, Zhengcai Zhanga and Guang-Jun Guo*a
aKey Laboratory of Earth and Planetary Physics, Institute of Geology and Geophysics, Chinese Academy of Sciences, Beijing 100029, China. E-mail: guogj@mail.iggcas.ac.cn
bKey Laboratory of Natural Gas Hydrate, Guangzhou Institute of Energy Conversion, Chinese Academy of Sciences, Guangzhou 510640, China

Received 27th August 2016 , Accepted 2nd November 2016

First published on 3rd November 2016


Abstract

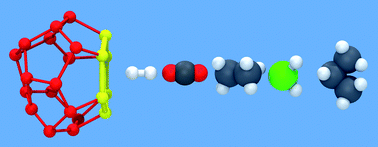
The adsorption interaction between a water cage and a guest molecule, shown by the potential of mean force (PMF), is key to understanding hydrate formation mechanisms. In this work, we performed a series of PMF calculations to investigate how the guests affect adsorption interactions. We considered spherical guests for five species of inert gases (He, Ne, Ar, Kr, and Xe), and non-spherical guests for carbon dioxide, hydrogen, hydrogen sulfide, ethane, and propane. The results show that the location of the first well of PMF mainly depends on the guest size (i.e., the kinetic diameter of the guest) rather than the guest structure; and the activation energy (the free energy difference between the first well and the first barrier) mainly depends on the water–guest cross interaction and the size of the adsorption face. An empirical criterion is suggested to distinguish the adsorption face (dring/dguest < 1.72) and cage hole (dring/dguest > 1.72) for a specific guest molecule, where dring is the diameter of the circumcircle of a water ring in a cage and dguest is the kinetic diameter of the guest. Additionally, some interesting phenomena are observed. For example, CO2 has the smallest activation energy and a predominant orientation near the adsorption face. H2S and Kr have almost the same cage–guest adsorption interaction owing to their similar size. C3H8 has the largest distance for the first barrier of PMF so as to require the smallest critical concentration to trigger hydrate nucleation according to the cage adsorption hypothesis. The present observations are very helpful to understand hydrate formation mechanisms.

1. Introduction

Gas hydrates are ice-like inclusion compounds formed by water as a host component and gas as a guest component, and form under low temperatures and high pressures. The guest molecules trapped in the clathrate framework composed of water molecules can be methane, ethane, propane, butane, carbon dioxide, hydrogen sulfide, tetrahydrofuran, inert gases, and so on. Depending on the size of these guest molecules, gas hydrates can mainly form one of the three typical structures, i.e., sI, sII, and sH.1,2

Different gas hydrates have their distinctive importance, and deserve to be studied. For example, a large amount of natural gas hydrates (represented by methane hydrate) exist below the ocean floor and in permafrost zones, and thus are regarded as a potential energy resource in future. However, the decomposition of natural gas hydrates may cause the sediments unstable and lead to geological disasters.3,4 To obtain methane and to keep the sediments stable at the same time, one suggested injecting carbon dioxide into the sediments to form CO2 hydrate by replacing methane. By such a way, CO2 is sequestrated as clathrate hydrates so as to reduce CO2 emissions and alleviate the greenhouse effect.5 Recent years, to develop the technology of using hydrogen as a clean and efficient fuel is an active research area worldwide. Since the synthesis of hydrogen clathrate hydrates,6–8 there has been considerable interest at using clathrate hydrates for H2 storage.9,10 Of all the common hydrate guests, H2S is known to form hydrates at the lowest pressure and persists to the highest temperature.11 In addition, H2S has a significant effect on hydrate formation of gas mixtures. Previous studies have shown that H2S forms hydrate more readily than other components of natural gas. Thus, the presence of H2S in natural gas may help initiate the formation of hydrates.11–13

One of the common questions on these hydrates is their formation mechanism, which is still not sufficiently understood on a molecular level. Before 2008, limited by the computer resources, the spontaneous nucleation of hydrates has not realized via MD simulations, and the labile cluster hypothesis14 and the local structural hypothesis15 were popular proposed hydrate nucleation mechanisms. After 2008, several important works of MD simulations are done to realize the spontaneous nucleation of hydrate16,17 and a two-step mechanism is proposed.18,19 The two-step mechanism states that the amorphous phase hydrate should form first to act as an intermediate state and then undergoes an annealing process to form crystalline phase hydrate. Recently, Zhang et al.20 confirmed that hydrate actually nucleates with multiple pathways which Walsh et al.21 once speculated. Although the two-step mechanism and then the multiple pathways describe the hydrate nucleation processes, they do not explain why and how the nucleus forms in detail. Several groups give different answers. For example, Guo's group calculated the potential of mean force (PMF) between a cage and a guest molecule, such as methane, and proposed the cage adsorption nucleation hypothesis that emphasized the cage–guest adsorption interaction to control the nucleation and growth of hydrate.22 Matsumoto believed four methane molecules aggregate together will lead to the cage formation.23 Bai et al. demonstrated that the water–guest molecule attraction regulated the pathway and rate of nucleus growth, whereas the size of guest molecules determines the dynamically preferable structure.24 Sum's group emphasized two methane molecules separated by a pentagonal water ring is the basic structure to induce hydrate nucleation.25

In this work, we focus on the cage–guest adsorption interaction. In our previous simulation of guest–water systems, we paid particular attention to the adsorption interaction between a water cage and a methane molecule. We previously evaluated the effects of cage rigidity, filling status, and orientation on the potential of mean force (PMF) between a dodecahedral cage (512) and a methane molecule,22 and found that a strong attractive interaction exists between cage and methane, whose strength is comparable with that of hydrogen bonds and whose direction is perpendicular to cage faces. Then, we further investigated how the cage type and adsorption face affect the PMF.26 It is found that the PMF depends on the face size rather than the cage type, and the adsorption interaction becomes stronger as the face size increases.

In this paper, we continuously investigate how different kinds of guest molecules affect the cage–guest adsorption interaction. For this aim, we first calculated the PMFs between five species of inert gas molecules (He, Ne, Ar, Kr, and Xe) and water cages to investigate how the guest molecular size affects the cage–guest adsorption interaction, and then we calculated the PMFs between water cages and CO2, H2, H2S, C2H6, and C3H8, respectively, to study how the guest molecular structure affects the cage–guest adsorption interaction.

2. Method

Similar to the previous work,26 all molecular dynamics (MD) simulations were carried out using the GROMACS package.27 The simulation cell was orthorhombic with dimensions of 45 × 30 × 30 Å (x × y × z). The simulations consisted of one cage, one dissolved guest molecule, and 1240 water molecules. The potential parameters of water and guest molecules used in this work are listed in Table 1. The cross interactions between water and guest molecules were calculated according to the Lorentz–Berthelot combining rules, via,
 
image file: c6ra21513k-t1.tif(1)
 
εij = χ(εiiεjj)1/2. (2)
Where σ and ε are the Lennard-Jones interaction parameters, and χ is the modification factor. In our previous work, we chose χ = 1.07 for the water–methane cross interaction which can predict better methane solubility.34 However, in this work, we chose χ = 1, meaning the standard Lorentz–Berthelot combining rules, for other guests because the optimized χ values are unavailable. The Nosé–Hoover thermostat and Parrinello–Rahman barostat, with a period of 0.8 ps for both, were used to obtain the NPT ensemble with a temperature of 258.5 K and a pressure of 30 MPa. Here, the state point locates at the phase region of methane hydrate for the combination of TIP4P/2005 water28 and OPLS-UA methane,35 and is out of the ice region. Additionally, the period of 0.8 ps seems a little smaller than the usual value (for example 1–10 ps) but it is still larger than the characteristic relaxation time of liquid water, i.e., less than 0.5 ps according to the viscosity study.36 So we used the value to meet the requirement of T- and P-coupling and to improve the precision of controlling T and P in short simulation runs. The cutoff distance was 10 Å for the Lennard-Jones potential. Periodic boundary conditions were used in all directions and the long-range interaction was calculated using the particle mesh Ewald method with a real space cutoff of 10 Å, spline order of 4, and Fourier spacing of 1.2 Å.
Table 1 Potential parameters for TIP4P/2005 water and guest molecules used in the MD simulations
Molecule Atom/site σii (Å) εii (kJ mol−1) q (e) l[thin space (1/6-em)]e (Å) α[thin space (1/6-em)]f (°)
a The site M of H2O lies in the molecular plane on the bisector of the H–O–H angle, and the distance between atom O and M is 0.1546 Å.b The site Hc.m. corresponds to the center of mass of the H2 molecule.c The atom I of H2S lies in the molecular plane on the bisector of the H–S–H angle, and the distance between atom S and I is 0.1862 Å.d The C1 and C2 of C3H8 represent the carbon which connect to one C atom and two C atoms, respectively.e l means the bond length.f α means the bond angle.
H2O (ref. 28) O 3.1589 0.774912 0.0 lOH = 0.9572 ∠HOH = 104.52
H 0.0 0.0 0.5564    
Ma 0.0 0.0 −1.1128    
He (ref. 29) He 2.5510 0.084974 0.0    
Ne (ref. 29) Ne 2.8200 0.272716 0.0    
Ar (ref. 29) Ar 3.5420 0.775744 0.0    
Kr (ref. 29) Kr 3.6550 1.487466 0.0    
Xe (ref. 29) Xe 4.0470 1.920652 0.0    
CO2 (ref. 30) C 2.7918 0.239832 0.5888 lCO = 1.1630 ∠OCO = 180.0
O 3.0 0.687244 −0.2944
H2 (ref. 31) H 0.0 0.0 0.4932 lHH = 0.7414  
Hc.m.b 3.0380 0.285200 −0.9864
H2S (ref. 32) S 3.7300 2.078628 0.40 lSH = 1.3400 ∠HSH = 92.0
H 0.0 0.0 0.25
Ic 0.0 0.0 −0.90
C2H6 (ref. 33) C 3.5000 0.276144 −0.18 lCC = 1.5400, lCH = 1.0900  
H 2.5000 0.125520 0.06
C3H8 (ref. 33) C1d 3.5000 0.276144 −0.18 lCC = 1.5400, lCH = 1.0900 ∠C1C2C1 = 109.47
C2d 3.5000 0.276144 −0.12
H 2.5000 0.125520 0.06


To study the cage–guest adsorption interaction, we used the constrained molecular dynamics simulations to calculate the PMF between a cage and a guest molecule. Similar to the advantage of umbrella sampling, the constrained molecular dynamics method can also improve the sampling of phase space. By constraining the distance between cage and guest during simulations, the constraint mean force F(rc) exerted on them can be calculated. Then, the PMF is achieved through

 
image file: c6ra21513k-t2.tif(3)
where r1 is the constrained distance of the reference state, r2 is an arbitrary constrained distance, and rc is the constrained distance between the center of the adsorption face of cage and the geometric center of a guest molecule. For convenience, r1 often takes a value large enough so that PMF(r1) reaches zero. Therefore, the PMF can be calculated from
 
image file: c6ra21513k-t3.tif(4)

In this study, rc chose 56 sample points, varying from 1 Å to 12 Å with an interval of 0.2 Å, and PMF(12 Å) was set at zero.

All the MD simulations in this work were performed with considering only the face-orientation of cage, meaning that guest molecules locate on the line perpendicular to the adsorption face. Because PMF is found to depend on the face size rather than the cage type in our previous work,26 the water cage 4151062 was used in this work with considering two aspects: (1) it has three different types of face so as to avoid changing cage type when to change different adsorption face as needed; (2) the occurrence of 4151062 cage is very frequent during hydrate nucleation process, and in fact, it is the second important cage (only less than the 512 cage) in one of MD formation trajectories of methane hydrate.17,37 In addition, two other cages, 43576271 and 44566381, were also used, which can provide larger faces, such as 7-membered and 8-membered faces (seeing the Fig. S1). The above three cages are all extracted from the MD trajectories for hydrate formation reported by Walsh et al.17 The edge lengths of all cages were fixed at 2.82 Å as usual.26 In the constrained MD simulations, we defined two groups including the adsorption face and the dissolved guest molecule. They were initially placed on the x-axis and located in the middle of simulation box. During the simulation, the two groups could move freely but the distance between the center of the adsorption face and the geometric center of the dissolved gas molecule was fixed at rc with using the SHAKE algorithm and the COM pulling codes of GROMACS.27 To keep the adsorption face perpendicular to the adsorption direction, every hypotenuse (VG) of the right triangle VOG were also fixed, where V is every vertex of the adsorption face, O is the face center and G is the dissolved guest molecule. As for the cages, both the distance constraints and angle constraints among the cage water molecules were used to maintain their rigidity to avoid the cages of 43576271 and 44566381 collapsing during the simulations. Each simulation was run for 602 ps. The initial 2 ps were run using a small step of 0.2 fs to relax the system smoothly. As for the following 600 ps, most of the simulations were run using the usual time step of 1 fs. However, for the cases of hydrogen, ethane and propane, 1 fs is too large to simulate smoothly because the rotation of hydrogen is faster and the size of ethane and propane is larger than that of other guest molecules, which leading to the over large angular displacements of these molecules in our constrained MD simulations. So, we selected some smaller time step of 0.8 fs, 0.4 fs, and 0.8 fs for them, respectively.

Fig. 1 shows the typical initial status of the cage and guest molecule. For spherical guest molecules, we calculated 19 cases of cage–guest PMF, including RG[0]F4He, RG[0]F5He, RG[0]F6He, RG[0]F4Ne, RG[0]F5Ne, RG[0]F6Ne, RG[0]F4Ar, RG[0]F5Ar, RG[0]F6Ar, RP[0]F7Ar, RG[0]F4Kr, RG[0]F5Kr, RG[0]F6Kr, RP[0]F7Kr, RG[0]F4Xe, RG[0]F5Xe, RG[0]F6Xe, RP[0]F7Xe, RQ[0]F8Xe. In this notation, [ ] is used to intimate a polyhedral cage whose appearance is described by the characters on the left side of [ ]—R means a rigid cage, the letters G, P, and Q denote the name of the water cage 4151062, 43576271, and 44566381, respectively. [0] means the cage is empty. On the right side of [ ], He, Ne, Ar, Kr, and Xe mean the inert gas molecules, i.e., helium, neon, argon, krypton, and xenon, respectively, while the subscripts F4, F5, F6, F7, and F8 mean the adsorption faces, i.e., tetragonal, pentagonal, hexagonal, heptagonal, and octagonal faces, respectively. For non-spherical guest molecules, we chose two different types – linear guest molecules (hydrogen, carbon dioxide, and ethane) and nonlinear guest molecules (hydrogen sulfide and propane). For these guests, we calculated 17 cases of cage–guest PMF, including RG[0]F4H, RG[0]F5H, RG[0]F6H, RG[0]F4C, RG[0]F5C, RG[0]F6C, RP[0]F7C, RG[0]F4E, RG[0]F5E, RG[0]F6E, RG[0]F4S, RG[0]F5S, RG[0]F6S, RP[0]F7S, RG[0]F4P, RG[0]F5P, RG[0]F6P, where the last letters, i.e., H, C, E, S, and P mean hydrogen, carbon dioxide, ethane, hydrogen sulfide, and propane, respectively. For easy reading, all of 36 PMF labels are listed together with detailed description in Table S1.


image file: c6ra21513k-f1.tif
Fig. 1 The 4151062 cage and guest molecules used in this paper. The red balls of the cage are water oxygen and the red sticks are H-bonds. The highlighted yellow balls indicate the adsorption face to the dissolved guests. (a) Represents a series of spherical guest molecules, from left to right the dissolved guests are helium, neon, argon, krypton, and xenon, respectively. (b) Represents the non-spherical guest molecules, which are hydrogen, carbon dioxide, ethane, hydrogen sulfide, and propane, respectively.

3. Results

3.1. The effect of spherical guest molecules on PMF

3.1.1. The effect of guest size on PMF. The simplest guest is the spherical molecule which has only one atom (or one LJ particle). In this work, we investigated five species of inert gas molecules (He, Ne, Ar, Kr and Xe). Fig. 2 shows the PMFs between the cage and five species of the inert gas molecules with the same face size, compared with the cage–methane PMF obtained from our previous work.26 From Fig. 2a–c, one can see that the location of the first well mainly depends on the molecular size, σ (Table 1). For different guests, when the face size is fixed, the smaller the inert gas molecules, the closer the first well location from the adsorption face. It is found that the difference of the first well location for neighboring inert gas molecules is equal to their difference of molecular size, Δσ, within the error of 0.2 Å corresponding to the interval of constrained distance (Table 2). For the same guest, when the face size increases, the location of the first well shifts closer to the adsorption face, and this phenomenon will be described in detail in the next section. It also shows that the activation energy (the free energy difference between the first well and the first barrier of a PMF curve), Ea, mainly depends on the water–guest cross interaction and the face size. For different guests, when the cross interaction becomes larger, the activation energy becomes larger. For the same guest, the larger the face size, the deeper the well depth. This is consistent with our previous work.26 There exists a linear relationship between the Ea and the face size (Fig. 3). Here, it should be noted that different water potential models hardly affect the PMF, and the modified factor χ shows a slight effect (Fig. S2 in the ESI). For example, as for methane, χ = 1.07 shifts the PMF for χ = 1 a little downward.
image file: c6ra21513k-f2.tif
Fig. 2 The cage–inert gas PMFs for the same adsorption face. (a–c) are for the tetragonal, pentagonal, hexagonal faces, respectively.
Table 2 Comparison of the difference of guest size (Δσ) with the difference of the first well location of cage–guest PMF (Δrw1). F4, F5 and F6 mean tetragonal, pentagonal, and hexagonal faces, respectively
  Δσ (Å) Δrw1–F4 (Å) Δrw1–F5 (Å) Δrw1–F6 (Å)
Ne–He 0.269 0.2 0.4
Ar–Ne 0.722 0.6 0.4
Kr–Ar 0.113 0.0 0.2 0.2
Xe–Kr 0.392 0.4 0.2 0.2


image file: c6ra21513k-f3.tif
Fig. 3 The activation energies (Ea) of cage-adsorbing guests change with the face size (Nv).
3.1.2. Difference between the minimum cage hole and the maximum adsorption face. In order to observe whether the inert gas molecules can enter the cage, we calculated the PMFs for the cases of RG[0]F5He, RG[0]F6He, RG[0]F5Ne, RG[0]F6Ne, RG[0]F6Ar, RP[0]F7Ar, RP[0]F7Kr, RP[0]F7Xe, and RQ[0]F8Xe with rc ranging from −3 Å to 12 Å. Here, the negative value indicates that the dissolved guest molecule is initially located on the left side of the adsorption face, i.e., the inside of the cage. The P cage (43576271) has a heptagonal face and the Q cage (44566381) has an octagonal face.

Fig. 4 shows the face size effect on PMF for each inert gas molecule. The results are similar to our previous results,26 that is, the larger face size, the stronger adsorption interaction. However, in our previous studies, we defined that the maximum adsorption face was 6-membered water rings, and the 7- and larger membered water rings were called cage holes through which guests can enter into the cage.26,37 From Fig. 4 one can see, for He, Ne, Ar, Kr, and Xe in turn, their maximum adsorption faces are 4-, 5-, 6-, 6-, and 7-membered, respectively. As a comparison, the maximum adsorption face for methane is 6-membered. Obviously, whether the cage face can adsorb a guest molecule or allow it enter into the cage depends on their relative size. Therefore, we calculated the ratios dface/dguest and dhole/dguest for guest molecules, which listed in Table 3, where dface and dhole mean the diameter of circumcircle of water rings for adsorption face and cage hole, respectively, and dguest is the kinetic diameter of guests which is defined as the intermolecular distance of the closest approach for two molecules colliding with zero initial kinetic energy.38 One can see that the dface/dguest values for the maximum adsorption face are in the range of 1.50–1.71. Correspondingly, the dhole/dguest values for the minimum cage hole are 1.73–2.0.


image file: c6ra21513k-f4.tif
Fig. 4 The cage–inert gas PMFs showing the effect of face size. (a–e) are for He, Ne, Ar, Kr, and Xe, respectively.
Table 3 The maximum adsorption face and the minimum cage hole for guest molecules. Here, dface and dhole means the diameter of circumcircle of water ring, and dguest is the kinetic diameter of guest molecules. The data for C2H6 and C3H8 are estimated because we failed to obtain their PMFs for the adsorption faces larger than 6-membered water ring
Molecule dguest (Å) Facemax Holemin dface/dguest dhole/dguest
He 2.551 4 5 1.56 1.88
Ne 2.820 5 6 1.70 2.00
Ar 3.542 6 7 1.59 1.84
Kr 3.655 6 7 1.54 1.78
Xe 4.047 7 8 1.61 1.82
CH4 3.758 6 7 1.50 1.73
CO2 3.3 6 7 1.71 1.97
H2 2.857–2.89 5 6 1.70–1.66 2.0–1.95
H2S 3.623 6 7 1.56 1.79
C2H6 4.443 >6 >1.27
C3H8 4.3–5.118 >6 >1.31


3.2. The effect of non-spherical guest molecules on PMF

Besides the spherical guests, we also studied the effect of non-spherical guests including linear and nonlinear molecules in this study. We selected hydrogen, carbon dioxide, and ethane for linear guests. From Fig. 5, one can see that hydrogen can enter into the cage through the hexagon face very easily. But for CO2, there is an energy barrier about 7 kJ mol−1 to prevent it from crossing the hexagonal face. This energy barrier is actually the smallest threshold value recorded in this study, which we experientially used to judge whether a water ring acts as an adsorption face or a cage hole. According to this criterion, the maximum adsorption faces for H2 and CO2 are 5- and 6-member water rings, respectively. As for C2H6, because its CH3 group is too large and often caused the simulations to collapse when rc is small, we failed to obtain the PMF results for P and Q cages in order to find its maximum adsorption face which should be larger than the 6-membered water ring.
image file: c6ra21513k-f5.tif
Fig. 5 The effects of linear guest to the PMF between water cage and linear gas molecules. (a–c) are for hydrogen, carbon dioxide, ethane, respectively.

For non-linear gas molecules, we considered hydrogen sulfide and propane. Their PMF results show similar features to that of other guests. From Fig. 6 one can see, the maximum adsorption face is the hexagonal water ring for H2S. Due to the same reason for C2H6 mentioned above, the maximum adsorption face of C3H8 is estimated at least 6-membered water ring.


image file: c6ra21513k-f6.tif
Fig. 6 The PMF for non-linear guests. (a) H2S; (b) C3H8.

3.3. The orientation of the adsorbed guests

In order to describe the orientation of guests when they approach the adsorption face, we calculated the angle (θ) between the normal of the adsorption face and the long symmetrical axis of guest molecules. We found that θ is less than 10° when CO2 approaches the adsorption face (Fig. 7a, S3a and b). It shows that CO2 have a predominant direction whose long axis is almost perpendicular to the adsorption face. But for H2, θ is in the range of 48° to 65°, meaning that it does not have any predominant direction and can rotate freely (Fig. 7b, S3c and d). The orientation angle (θ) changes over time at rc = 2.0 Å as shown in Fig. S4 in the ESI. This may be explained with the potential model of H2 which has only one Lennard-Jones interaction site (see Table 1). Moreover, the result agrees well with the simulation results of Alavi and Ripmeester who used the same H2 potential listed in Table 1 and oriented the H2 guest parallel or perpendicular relative to the pentagonal or hexagonal face.39 They fixed the relative position of cage face and H2, and found that the energy required for the H2 guest to migrate through a pentagonal or hexagonal face was almost the same for both the perpendicular and parallel configurations. Additionally, the orientation angles for C2H6, H2S, and C3H8 are shown in Fig. S5. They reveal some extent of orientation when approaching the adsorption faces but not as clear as that of CO2 and H2. Because their larger size often causes simulation runs to fail when they approach the adsorption faces too near, the corresponding orientation angles are unavailable.
image file: c6ra21513k-f7.tif
Fig. 7 The orientation angle (θ) of guests. (a) CO2; (b) H2. r = 0 means the position of the adsorption faces.

3.4. Activation energy of cage–guest adsorption interaction

From the PMF curves, activation energy (Ea) of cage–guest adsorption interaction can be calculated easily. It is equal to the PMF difference between the first well and the first barrier, meaning the free energy barrier to desorption of a guest once that the guest has already adsorbed onto a cage face. In our previous studies, it was found that the Ea of cage–guest adsorption interaction is equivalent to the strength of H-bonds22 and the Ea changes with the size of adsorption face linearly (see Fig. 3).26 Therefore, in this study, we just listed the Ea results of cage–guest PMF for the pentagonal adsorption face in Table 4. Except inert gases, there is no regular variation of Ea with the size of guest molecules. However, the most striking feature is that the Ea of the cage–methane PMF is the largest while that of the cage–CO2 PMF is the smallest. This point will be discussed in the next section.
Table 4 Features of the PMF between the 4151062 cage and guest molecules for the pentagonal adsorption face. Here r1 represents the location of the first well, and PMF(r1) is the potential of mean force at the first well; r2 represents the location of the first barrier, and PMF(r2) is the potential of mean force at the first barrier. The activation energy (Ea) is equal to the PMF difference between the first well and the first barrier
Guest dguest (Å) r1 (Å) PMF(r1) (kJ mol−1) r2 (Å) PMF(r2) (kJ mol−1) Ea (kJ mol−1)
He 2.551 1.6 −14.0 4.8 −0.6 13.4 ± 0.2
Ne 2.820 2.0 −12.8 5.0 1.2 14.0 ± 0.3
Ar 3.542 2.6 −13.5 5.4 2.0 15.5 ± 0.3
Kr 3.655 2.8 −13.4 5.6 2.5 15.9 ± 0.5
Xe 4.047 3.0 −15.1 5.8 1.8 16.9 ± 0.5
CH4 3.758 2.8 −16.1 5.6 1.5 17.6 ± 0.3
CO2 3.3 3.0 −9.8 5.6 1.8 11.6 ± 0.3
H2 2.857–2.89 2.2 −15.8 5.2 −0.7 15.1 ± 0.6
H2S 3.623 2.8 −13.9 5.6 2.4 16.3 ± 0.5
C2H6 4.443 3.4 −14.1 5.8 1.9 16.0 ± 0.9
C3H8 4.3–5.118 3.6 −13.1 6.4 1.8 14.9 ± 0.7


4. Discussion

According to the cage adsorption hypothesis about hydrate nucleation,22 the adsorption interaction between cage and guest is the inherent driving force to trigger hydrate nucleation in a dilute aqueous solution of the guest molecule. However, the cages formed in liquid solution have varies of shapes and varies of faces in size.37,40 Obviously, not all water rings in cages has the ability to act as a qualified adsorption face because a guest molecule can pass through a water ring rather than be adsorbed on when the water ring is large enough relative to the guest size. Therefore, it is necessary to judge whether a water ring is an adsorption face or a cage hole. This point is very important for searching cage structures by using the FSICA method,37 which can identify arbitrary cage types without knowing them in advance. From Table 3 one can see, the values of dface/dguest for the maximum adsorption face are in the range of 1.50–1.71 while the values of dhole/dguest for the minimum cage hole are in the range of 1.73–2.0. Thus, the diameter ratio, 1.72, of water ring to guest is a reasonable criterion to distinguish the water ring's function for a specific guest molecule, i.e., dring/dguest < 1.72 for adsorption faces and dring/dguest > 1.72 for cage holes.

Recently, Kuhs' group obtained a new structure of ice, i.e., ice XVI structure (the empty sII hydrate structure), by five days of continuous pumping operation to remove all the guests from neon hydrate.41 The present work can be used to explain the phenomenon. In Fig. 4b and Table 3, because the cage hole for Ne is the hexagonal water ring, it allows the neon molecules leaving from the neon hydrate through the channel of linked 51264 cages under pumping. However, interestingly, we do not know how the neon molecules occupying the 512 cages come out. Perhaps, the temporary break of the pentagonal water rings linking 51264 and 512 cages is necessary so as to facilitate neon moving from the small 512 cage to the large 51264 cage.

Considering that the selectivity adsorption phenomenon possibly exists in the formation processes of binary hydrates, the activation energies calculated from PMFs are of significance because it can reflect the adsorption affinity between cage and guest.22 From He to Xe, the difference of Ea for neighboring inert gases is small but the increasing trend of Ea is regular (Table 4). Obviously, the adsorption affinity of Xe to cage is larger than that of He. By using the weighted histogram analysis method, Yagasaki et al.42 calculated the free energy profiles for transferring various solute molecules from bulk water to the hydrate surface, and also found the adsorption affinity strongly depends on the size of solute molecules, that is, smaller and larger solutes show lower adsorption affinity than the intermediate solutes in size. However, our results cannot directly compare with theirs due to the large difference in the studying object and method. Additionally, it should be mentioned that, to obtain the PMF in this work, we used the rigid cage in which the relative positions of cage vertices are fixed under both distance and angle constraints. According to our previous studies,22 the Ea for the soft cage in which the angle constraint is removed is a little smaller than that for the rigid cage. The fully flexible cage without collapse during MD simulation has not been available at present, and the effect of its edge length on the PMF deserves to be studied in the future. Anyway, the fixed edge length of 2.82 Å used in this work is the most reasonable choice because it represents the average length of hydrogen bonds in system.

In this work, we found that CO2 is very particular. Firstly, for all studied guests, CO2 is not the smallest guest but it has the smallest activation energy (Ea) (Table 4). It shows the adsorption interaction between cage and CO2 is the weakest. On the contrary, the cage–methane adsorption is the strongest. Although we have not understood its applications, it should be considered when investigating the process of using CO2 to replace CH4 in methane hydrate. Secondly, the orientation angle between the normal of the adsorption face and the O–O connection line of CO2 is less than 10° when CO2 approaches the adsorption face. This phenomenon may be ascribed to the potential parameters of CO2 in which both C atom and O atom have Lennard-Jones interactions. When CO2 approaches an adsorption face, one O atom is attracted more strongly than another and thus turns the long axis of CO2 to be perpendicular to the adsorption face. Thirdly, the maximum adsorption face for CO2 is the hexagonal water ring. However, the PMF barrier at this face, about 6.8 kJ mol−1 (seeing the blue peak located at 1.2 Å in Fig. 5b), is the lowest among those of other guest's maximum adsorption face (being out of the figure actually). It means the hexagonal face may be flexible when adsorbing CO2 molecules. In other words, the hexagonal face can adsorb a CO2 guest but the guest has a chance to penetrate it due to its not much higher PMF barrier.

In addition, H2S and Kr have similar kinetic diameters (seeing Table 3, i.e., 3.623 Å and 3.655 Å, respectively).38 Interestingly, the PMF curves for them almost overlap completely (Fig. 8). This kind of coincidence may provide a chance to study the formation mechanism of hydrate through accurately comparing the difference between H2S hydrate and Kr hydrate. Recently, Liang and Kusalik reported the formation simulation of H2S hydrate,43 which has a very fast nucleation rate mainly due to the high solubility of H2S. As a comparison, similar studies on Kr hydrate deserve to be carried out in the future.


image file: c6ra21513k-f8.tif
Fig. 8 The cage–Kr PMF and the cage–H2S PMF for the 4-, 5-, and 6-membered adsorption face, and the 7-membered cage hole.

At last, the critical concentration beyond which the metastable solutions can form hydrate spontaneously for hydrate nucleation should be mentioned. According to the cage adsorption hypothesis, it can be calculated by the location of the first barrier of cage–guest PMF.44 For example, the first energy barrier of cage–methane PMF locates at ∼8.8 Å from the cage center, and the critical concentration of methane can be calculated as 1.47 (=1/0.883) methane molecules per nm3, corresponding to about 0.044 mol fraction and agreeing with the measured critical value of 0.05 mol fraction.44 In Table 4, the largest separation of the first barrier's location is 6.4 Å from the face center for propane. Because the average distance is 3.2 Å from the cage center to the face center, the first barrier's location becomes 9.6 Å to the cage center. Therefore, the critical concentration for propane hydrate nucleation is only 1.13 C3H8/nm3, being the smallest among the studied guests. Correspondingly, the first barriers of He, Ne, and H2 are closer to the adsorption face than that of other guests (Table 4), it means these guest molecules need higher critical concentration and thus are more difficult to trigger hydrate nucleation.

5. Conclusions

In this work, we investigated how the guests affect the cage–guest PMFs. The results show that the location of the first well mainly depends on the guest size, rather than the structure, and the activation energy mainly depends on the water–guest cross interaction and the face size. For the same guest, when the face size increases, the location of the first well shifts closer to the adsorption face and the well depth becomes deeper. For different guests but the same adsorption face, the smaller the guest size, the closer the first well location from the adsorption face; and the stronger the cross interaction, the larger the activation energy. Furthermore, the maximum adsorption face for He, Ne, Ar, Kr, Xe, H2, CO2, and H2S are identified as 4-, 5-, 6-, 6-, 7-, 5-, 6-, and 6-membered water rings, respectively. An empirical criterion is suggested to distinguish the adsorption face (dface/dguest < 1.72) and cage hole (dhole/dguest > 1.72) for a specific guest molecule. This point is very important when using the FSICA method37 to search all cages in the hydrate-related systems because the face-saturated incomplete cage depends on clear definitions of adsorption face and cage hole for guest molecules. Additionally, it is also helpful for studying the guest migration among the clathrate structures. As for linear and non-linear guest molecules, no regular effect on the cage–guest PMF is found but some features deserve to be noted which may be useful to understand hydrate formation for related guests and to study hydrate inhibitors and promoters. For example, CO2 shows an obvious predominant orientation (θ < 10°) when approaches the adsorption face while H2 does not. Moreover, CO2 bears the weakest cage–guest adsorption interaction while CH4 bears the strongest one. Kr and H2S bear almost the same cage–guest adsorption interaction not only for the activation energy but also for the location of PMF well and barrier. Due to the largest molecular size in this study, C3H8 bears the largest distance for the first PMF barrier which may require a smaller critical concentration than other guests to trigger hydrate nucleation according to the cage adsorption hypothesis. Correspondingly, He, Ne, and H2 may require a little larger critical concentration to induce hydrate nucleation.

Acknowledgements

We appreciate Prof. Peter G. Kusalik and Dr Kyle W. Hall for their valuable discussion and suggestions. We thank the Computer Simulation Lab at IGGCAS for allocation of computer time. This work was supported by National Natural Science Foundation of China via Grant 41372059 and by the Strategic Priority Research Program of the Chinese Academy of Sciences via Grant XDB10020301.

References

  1. E. D. Sloan, Nature, 2003, 426, 353–359 CrossRef CAS PubMed.
  2. C. A. Koh, E. D. Sloan, A. K. Sum and D. T. Wu, Annu. Rev. Chem. Biomol. Eng., 2011, 2, 237–257 CrossRef CAS PubMed.
  3. K. A. Kvenvolden, Rev. Geophys., 1993, 31, 173–187 CrossRef.
  4. K. A. Kvenvolden, Proc. Natl. Acad. Sci. U. S. A., 1999, 96, 3420–3426 CrossRef CAS.
  5. B. A. Buffett, Annu. Rev. Earth Planet. Sci., 2000, 28, 477–507 CrossRef CAS.
  6. W. L. Mao, H.-K. Mao, A. F. Goncharov, V. V. Struzhkin, Q. Guo, J. Hu, J. Shu, R. J. Hemley, M. Somayazulu and Y. Zhao, Science, 2002, 297, 2247–2249 CrossRef CAS PubMed.
  7. V. V. Struzhkin, B. Militzer, W. L. Mao, H.-K. Mao and R. J. Hemley, Chem. Rev., 2007, 107, 4133–4151 CrossRef CAS PubMed.
  8. W. L. Mao and H.-K. Mao, Proc. Natl. Acad. Sci. U. S. A., 2004, 101, 708–710 CrossRef CAS PubMed.
  9. H. Lee, J.-W. Lee, D. Y. Kim, J. Park, Y.-T. Seo, H. Zeng, I. L. Moudrakovski, C. I. Ratcliffe and J. A. Ripmeester, Nature, 2005, 434, 743–746 CrossRef CAS PubMed.
  10. Y. Song, Phys. Chem. Chem. Phys., 2013, 15, 14524–14547 RSC.
  11. J. Carroll, Natural Gas Hydrates: A Guide for Engineers, Gulf Professional Publishing, Calgary, 3rd edn, 2014 Search PubMed.
  12. S. Liang and P. G. Kusalik, J. Phys. Chem. B, 2010, 114, 9563–9571 CrossRef CAS PubMed.
  13. S. Liang and P. G. Kusalik, Chem. Sci., 2011, 2, 1286–1292 RSC.
  14. R. L. Christiansen and E. D. Sloan, Ann. N. Y. Acad. Sci., 1994, 715, 283–305 CrossRef CAS.
  15. R. Radhakrishnan and B. L. Trout, J. Chem. Phys., 2002, 117, 1786–1796 CrossRef CAS.
  16. R. W. Hawtin, D. Quigley and P. M. Rodger, Phys. Chem. Chem. Phys., 2008, 10, 4853–4864 RSC.
  17. M. R. Walsh, C. A. Koh, E. D. Sloan, A. K. Sum and D. T. Wu, Science, 2009, 326, 1095–1098 CrossRef CAS PubMed.
  18. L. C. Jacobson, W. Hujo and V. Molinero, J. Am. Chem. Soc., 2010, 132, 11806–11811 CrossRef CAS PubMed.
  19. J. Vatamanu and P. G. Kusalik, Phys. Chem. Chem. Phys., 2010, 12, 15065–15072 RSC.
  20. Z. Zhang, M. R. Walsh and G.-J. Guo, Phys. Chem. Chem. Phys., 2015, 17, 8870–8876 RSC.
  21. M. R. Walsh, J. D. Rainey, P. G. Lafond, D.-H. Park, G. T. Beckham, M. D. Jones, K.-H. Lee, C. A. Koh, E. D. Sloan, D. T. Wu and A. K. Sum, Phys. Chem. Chem. Phys., 2011, 13, 19951–19959 RSC.
  22. G.-J. Guo, M. Li, Y.-G. Zhang and C.-H. Wu, Phys. Chem. Chem. Phys., 2009, 11, 10427–10437 RSC.
  23. M. Matsumoto, J. Phys. Chem. Lett., 2010, 1, 1552–1556 CrossRef CAS.
  24. D. Bai, B. Liu, G. Chen, X. Zhang and W. Wang, AIChE J., 2013, 59, 2621–2629 CrossRef CAS.
  25. B. C. Barnes, B. C. Knott, G. T. Beckham, D. T. Wu and A. K. Sum, J. Phys. Chem. B, 2014, 118, 13236–13243 CrossRef CAS PubMed.
  26. C.-J. Liu, Z.-C. Zhang, Z.-G. Zhang, Y.-G. Zhang and G.-J. Guo, Chem. Phys. Lett., 2013, 575, 54–58 CrossRef CAS.
  27. E. L. D. van der Spoel, B. Hess, A. R. van Buuren, E. Apol, P. J. Meulenhoff, D. P. Tieleman, A. L. T. M. Sijbers, K. A. Feenstra, R. van Drunen and H. J. C. Berendsen, 2010, http://www.gromacs.org.
  28. J. L. F. Abascal and C. Vega, J. Chem. Phys., 2005, 123, 234505 CrossRef CAS PubMed.
  29. B. E. Poling, J. M. Prausnitz and J. P. O'Connell, The properties of gases and liquids, McGraw-Hill Companies, New York, 5th edn, 2001 Search PubMed.
  30. Z. Zhang and Z. Duan, J. Chem. Phys., 2005, 122, 214507 CrossRef PubMed.
  31. I. F. Silvera and V. V. Goldman, J. Chem. Phys., 1978, 69, 4209–4213 CrossRef CAS.
  32. T. Kristóf and J. Liszi, J. Phys. Chem. B, 1997, 101, 5480–5483 CrossRef.
  33. W. L. Jorgensen, D. S. Maxwell and J. Tirado-Rives, J. Am. Chem. Soc., 1996, 118, 11225–11236 CrossRef CAS.
  34. H. Docherty, A. Galindo, C. Vega and E. Sanz, J. Chem. Phys., 2006, 125, 074510 CrossRef CAS PubMed.
  35. W. L. Jorgensen, J. D. Madura and C. J. Swenson, J. Am. Chem. Soc., 1984, 106, 6638–6646 CrossRef CAS.
  36. G.-J. Guo, Y.-G. Zhang, K. Refson and Y.-J. Zhao, Mol. Phys., 2002, 100, 2617–2627 CrossRef CAS.
  37. G.-J. Guo, Y.-G. Zhang, C.-J. Liu and K.-H. Li, Phys. Chem. Chem. Phys., 2011, 13, 12048–12057 RSC.
  38. J.-R. Li, R. J. Kuppler and H.-C. Zhou, Chem. Soc. Rev., 2009, 38, 1477–1504 RSC.
  39. S. Alavi and J. A. Ripmeester, Angew. Chem., 2007, 119, 6214–6217 CrossRef.
  40. G.-J. Guo, Y.-G. Zhang, M. Li and C.-H. Wu, J. Chem. Phys., 2008, 128, 194504 CrossRef PubMed.
  41. A. Falenty, T. C. Hansen and W. F. Kuhs, Nature, 2014, 516, 231–233 CrossRef CAS PubMed.
  42. T. Yagasaki, M. Matsumoto and H. Tanaka, J. Am. Chem. Soc., 2015, 137, 12079–12085 CrossRef CAS PubMed.
  43. S. Liang and P. G. Kusalik, J. Phys. Chem. B, 2013, 117, 1403–1410 CrossRef CAS PubMed.
  44. G.-J. Guo and P. M. Rodger, J. Phys. Chem. B, 2013, 117, 6498–6504 CrossRef CAS PubMed.

Footnote

Electronic supplementary information (ESI) available. See DOI: 10.1039/c6ra21513k

This journal is © The Royal Society of Chemistry 2016
Click here to see how this site uses Cookies. View our privacy policy here.