
Fabrication of cuprous sulfide nanorods supported on copper foam for nonenzymatic amperometric determination of glucose and hydrogen peroxide†
Wangdong Luab,
Yujing Suna,
Haichao Daiab,
Pengjuan Niab,
Shu Jiangab,
Yilin Wangab,
Zhen Liab and
Zhuang Li*a
aState Key Laboratory of Electroanalytical Chemistry, Changchun Institute of Applied Chemistry, Changchun, 130022, Jilin, P. R. China. E-mail: zli@ciac.ac.cn; Fax: +86 431 85262057; Tel: +86 431 85262057
bUniversity of Chinese Academy of Sciences, Beijing, 100049, P. R. China
First published on 13th September 2016
Abstract
Cu2S nanorods supported on three-dimensional copper foam (Cu2S NRs@Cu foam) are in situ prepared by a low-cost and facile method. The structural and morphological characterization of the Cu2S NRs@Cu foam is executed using scanning electron microscopy, transmission electron microscopy, X-ray diffraction and X-ray photoelectron spectroscopy. The high conductivity of copper foam as a current collector can facilitate charge and mass transfer, and the copper foam with an open framework provides large amounts of anchoring sites for the deposition of Cu2S NWs during the synthesis of the Cu2S NRs@Cu foam. Consequently, the Cu2S NRs@Cu foam works as an electrocatalyst for the detection of glucose and H2O2. Electrochemical measurements of the biosensor show an extremely high sensitivity of 11.7508 mA mM−1 cm−2 and a low detection limit of 0.07 μM for the electrocatalytic oxidation of glucose. The nonenzymatic sensor also exhibits a good response toward hydrogen peroxide with a high sensitivity of 1.686 mA mM−1 cm−2. The detection limit is calculated to be 0.2 μM. This method provides an efficient and promising strategy for the construction of practical non-enzymatic glucose and hydrogen peroxide sensors.
1. Introduction
Biosensors are involved in the fields of health care, chemical and biological analysis, and environmental monitoring.1–3 Blood glucose concentrations can be reflected by insulin levels. Insulin deficiency can lead to hyperglycemia. When glucose concentration is more than 7 mM and other relevant clinical symptoms appear, the patient can be diagnosed with diabetes. Diabetes can be controlled through real-time detection of blood glucose levels. Many groups have devoted themselves to finding sensitive and precise biosensors for the precise detection of glucose levels, since the first glucose sensor was developed in 1962.4–7Hydrogen peroxide is generated during the enzyme/glucose reaction. As a result, the monitoring of hydrogen peroxide is of equal importance. Noble metal based nanomaterials have been used to construct decorated electrodes for electrocatalyzing glucose and hydrogen peroxide.6,8–15 However, a shortage of noble metals is inevitable, which may lead to high prices and low abundance. Transition metal oxide based enzyme-free biosensors have been developed rapidly.16–21
Our group has reported copper oxide based enzyme-free biosensors.22,23 Considering the fact that oxygen and sulfur are elements of the same main group, metal chalcogenides may also work as glucose and hydrogen peroxide sensors. Many CuxS compounds exist such as chalcocite (Cu2S), anilite (Cu1.75S), covellite (CuS) and so on. Particularly, Cu2S, a p-type semiconductor with a direct band gap of 1.2 eV, has drawn attention owing to its application prospects. In the past decades, it has been utilized in the field of solar cells, electronic optoelectronic chips, and cold cathodes.24–27 Cu2S nanomaterials with different morphologies have been synthesized.28–37 However, there are no reports about chain-like Cu2S nanorods. Herein, Cu2S nanorods supported on Cu foam (Cu2S NRs@Cu foam) electrodes are constructed to study their applications as glucose and hydrogen peroxide biosensors, and show extremely high sensitivity and low detection limit. The selectivity and real sample measurements are also investigated, indicating that Cu2S NRs@Cu foam has a promising prospect for biosensor design and other biological applications.
2. Experimental section
2.1 Reagents and materials
Glucose, fructose, ascorbic acid (AA), dopamine (DA), uric acid and Na2S·9H2O are supplied by Sigma-Aldrich. KOH and hydrogen peroxide were purchased from Beijing Chemical Co. (Beijing, China). All of these reagents are of analytical grade and used without further purification. Ultrapure water (18.2 MΩ cm) produced by a Milli-Q system is used as the solvent throughout this work.2.2 Preparation of the Cu2S NRs@Cu foam
The Cu2S NRs@Cu foam is synthesized as follows. To begin with, Cu(OH)2 nanowires are formed on Cu foam (step a). The Cu foam is cut into 0.5 cm × 0.5 cm slices. The anodization is implemented by applying a constant current density of 20 mA cm−2 for 100 s in a three-electrode setup in 2 M KOH aqueous solution. Copper foam, a platinum wire and a saturated calomel electrode act as a working electrode, counter electrode and reference electrode, respectively. Then a blue film appears. The anodized copper foam is washed with distilled water and ethanol three times and dried in air. Then, the Cu(OH)2 nanowires are converted to chain-like Cu2O rods (step b). The obtained Cu foam is put into an Al2O3 crucible and heated to 300 °C and maintained for 0.5 h under N2 flow. Then the temperature is raised to 500 °C and maintained for another 0.5 h. The foam is allowed to cool to room temperature and an orange color appears on the Cu foam. Finally, the foam is dipped into 0.4 mL of 5 mM Na2S solution for 10 min at room temperature. The color of the foam turns dark brown, implying that Cu2S is formed on the Cu foam (step c).2.3 Electrochemical experiments
Cyclic voltammetric and amperometric experiments are executed by a CHI660A electrochemical workstation with a three-electrode system using Cu2S NRs@Cu foam as the working electrode, a platinum wire as the auxiliary electrode, and a saturated calomel electrode (SCE) as the reference electrode. The CVs are measured in a 0.1 M NaOH or PBS solution without and with various concentrations of glucose or H2O2. The amperometric responses of the Cu2S NRs@Cu foam electrode to glucose are collected at the applied potential of 0.45 V or −0.2 V (vs. SCE). Additionally, in order to exhibit its potential for practical applications, the Cu2S NRs@Cu foam electrode is utilized to analyze blood glucose concentrations of human serum samples.2.4 Characterization techniques
Scanning electron microscopy (SEM) images are obtained on a XL-30 ESEM FEG scanning electron microscope. Transmission electron microscopy (TEM) characterization is performed using a H-600 transmission electron microscope. XRD patterns are obtained on a D8 ADVANCE diffractometer with an area detector operating under a voltage of 20 kV using Cu Kα radiation (λ = 1.54 Å).2.5 Live subject statement
The authors state that all experiments were performed in compliance with the relevant laws and institutional guidelines of People’s Republic of China and approved by the institutional committee of Changchun Institute of Applied Chemistry. The authors also state that informed consent was obtained for any experimentation with human subjects and Changchun Institute of Applied Chemistry is committed to the protection and safety of human subjects involved in research.3. Results and discussion
3.1 Preparation and characterization of the Cu2S NRs/Cu foam
The morphologies of the Cu2O NRs@Cu foam and Cu2S NRs@Cu foam at different magnifications are depicted in Fig. S3† and 1. For the Cu2O NRs@Cu foam (Fig. S3†), Cu2O nanorods with a length of 2 μm are freely grown on the copper foam. For the Cu2S NRs@Cu foam, the SEM (Fig. 1A and B) and TEM (Fig. 2A and B) show that pod-like Cu2S nanorods with a length of 2 μm and a diameter of 200 nm almost cover the whole Cu foam uniformly. From high-resolution imaging, the lattice spacings of 1.89 Å and 1.97 Å shown in Fig. 2C correspond to the (103) and (110) crystal planes of cuprous sulfide. The copper foam with a three-dimensional open network framework provides more active sites for growth of Cu2S and facilitates mass and electron transfer for electrolyte diffusion. | ||
| Fig. 1 SEM images of the Cu2S NRs@Cu foam (A–D) at different magnifications. | ||
 | ||
| Fig. 2 Low magnification TEM (A and B) and high-resolution (C) images of the Cu2S NRs@Cu foam. (D) Comparison of XRD patterns of standard file Cu2S and the Cu2S NRs@Cu foam. | ||
The crystal structure of the Cu2S NRs@Cu foam is characterized by XRD and the diffraction peaks are clearly shown in Fig. 2D. The XRD patterns of the Cu2S NRs@Cu foam with three strong reflection peaks at 37.4°, 45.7° and 48.4° can be indexed to the (102), (110) and (103) plane of Cu2S compared with the standard file (JCPDS no. 26-1116), which demonstrates that the Cu2O NRs have been converted to Cu2S NRs completely.
XPS is also implemented to investigate the chemical states of bonded elements for Cu2S NRs. Fig. 3A and B demonstrates the XPS Cu 2p and S 2p spectra for Cu2S NRs. The peaks at 953.1 and 932.7 eV can be attributed to the excitations from the Cu 2p1/2 and Cu 2p3/2 core levels.19 The sulfur peak is composed of a spin split doublet of S 2p3/2 and S 2p1/2, and the binding energies correspond to 161.3 and 162.5 eV, which is in agreement with the reported literature.25,38 This confirms the formation of Cu2S NRs further.
 | ||
| Fig. 3 XPS of (A) Cu 2p1/2 and 2p3/2 and (B) S 2p1/2 and 2p3/2 of the Cu2S NRs@Cu foam. | ||
3.2 Electrocatalytic oxidation of glucose at Cu2S NRs@Cu foam electrode
The Cu2S NRs@Cu foam based non-enzymatic electrode is studied using cyclic voltammetry curves (CVs) between the potentials of −0.4 V and 0.8 V in 0.1 M NaOH solution at a scan rate of 50 mV s−1, as depicted in Fig. 4A. After addition of 1 mM glucose, the Cu2O NRs@Cu foam shows an oxidation peak at about 0.4 V. However, the oxidation peak of the Cu2S NRs@Cu foam appears at 0.3 V. The lower potential of the Cu2S NRs@Cu foam is beneficial for electrocatalytic activity. When 0.5, 1, 1.5, 2 and 2.5 mM glucose are added, it can be observed that the cathodic peak current at 0.5 V increased remarkably, implying obvious electrocatalytic oxidation of glucose. | ||
| Fig. 4 (A) CVs of the Cu2S NRs@Cu foam in the absence and presence of glucose with different concentrations (from the bottom to top: 0–2.5 mM) in 0.1 M NaOH solution. Scan rate: 50 mV s−1. (B) Amperometric responses of the Cu2S NRs@Cu foam at various potentials (vs. SCE) in 0.1 M NaOH solution with successive addition of 5 μM glucose. | ||
To improve the performance of the glucose sensor, the effect of applied potential on the amperometric response of the Cu2S NRs@Cu foam to 5 μM glucose is investigated, as depicted in Fig. 4B. The current is increased with the applied potential ranging from 0.3 to 0.5 V. The maximum current response is obtained at 0.45 V, and 0.45 V is chosen as the optimal working potential for amperometric measurement.
The time–current (I–T) curves of the Cu2S NRs@Cu foam and Cu foam electrodes are measured and compared with successive addition of glucose in 0.1 M NaOH solution per 50 s, as displayed in Fig. 5A–C and S1.† The linear concentration of the Cu2S NRs@Cu foam electrode is in the range of 0.2 μM to 0.63 mM with a correlation coefficient of 0.9971, a high sensitivity of 11.7508 mA mM−1 cm−2 and a low detection limit down to 0.07 μM at the signal-to-noise ratio of 3. The performance of the fabricated sensor in this work is compared with other Cu2S-based nonenzymatic sensors, as summarized in Table 1. Obviously, the Cu2S NRs@Cu foam sensor is highly improved. This may be ascribed to two aspects. For one thing, the Cu2S NRs are grown in situ on the Cu foam, which can facilitate mass and electron transfer between the Cu2S NRs and Cu foam. For another, the Cu2S NRs@Cu foam possesses higher surface area and much more active points than Cu foil.
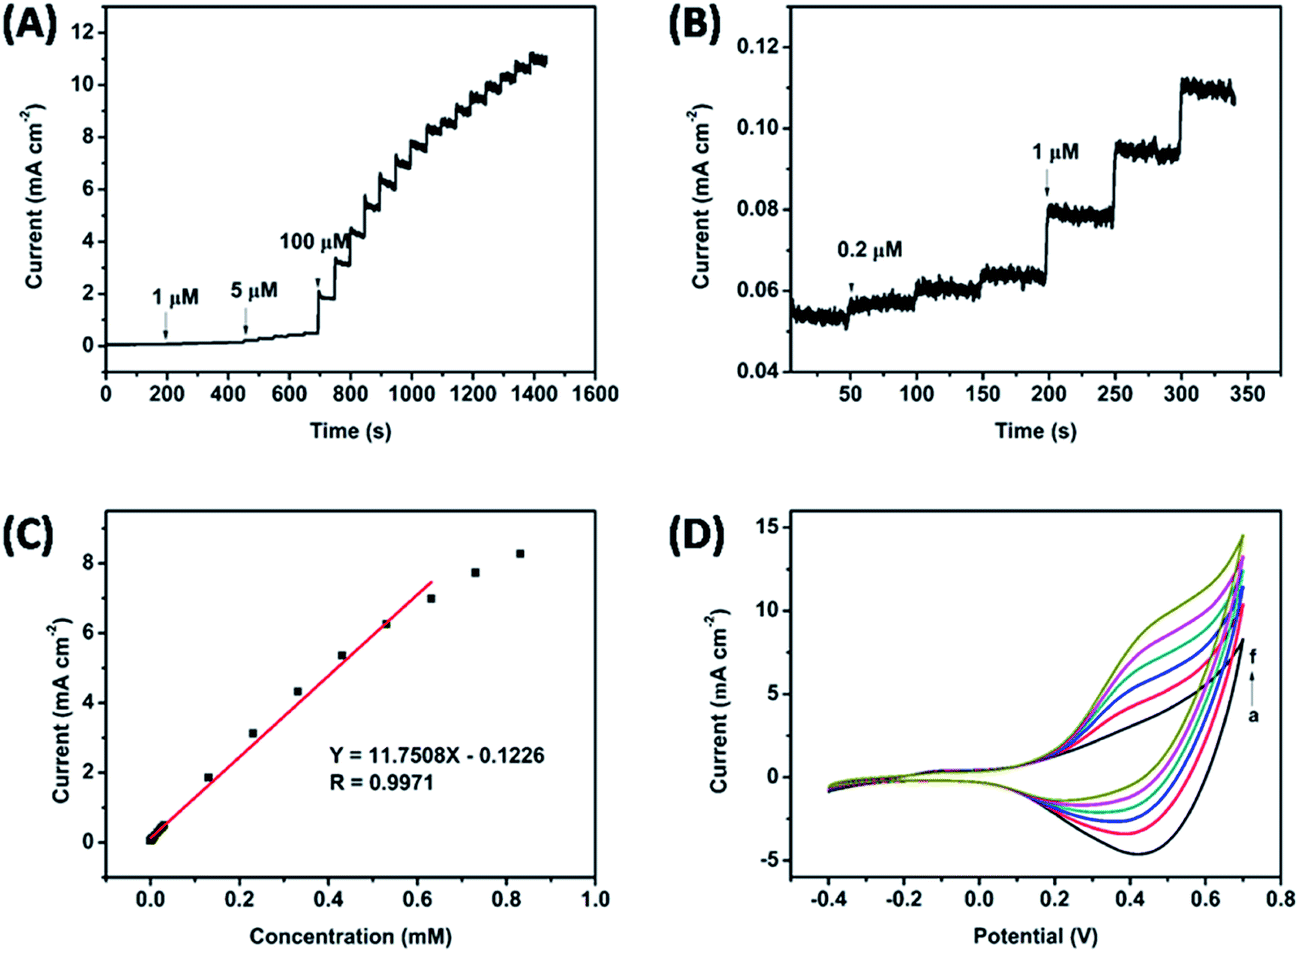 | ||
| Fig. 5 (A) Typical amperometric response of the Cu2S NRs@Cu foam electrode at 0.45 V vs. SCE with the successive addition of glucose from 0.2 μM to 630 μM in 0.1 M NaOH solution. (B) Amperometric response towards 0.2–1 μM glucose. (C) The corresponding calibration curve of the Cu2S NRs@Cu foam in 0.1 M NaOH solution. (D) Amperometric response of the Cu2S NRs@Cu foam towards the addition of 1 mM glucose and various 0.1 mM interfering species in the 0.1 M NaOH solution at 0.45 V vs. SCE. | ||
| Type of electrode | Sensitivity (μA mM−1 cm−2) | Detection limit (μM) | Linear range (mM) | Reference |
|---|---|---|---|---|
| a Multiwalled carbon nanotubes.b Cu2S nanoplates. | ||||
| Cu foam | 3397 | 12.961 | — | 39 |
| Cu2S-MWCNRa | 75 nA@mM | 10 | 0.01–1 | 25 |
| Cu–Cu2S nanocomposite | 361.58 | 0.1 | 0.002–8.1 | 40 |
| Cu2S NPsb | 61.67 | 1.3 | 0.01–3.1 | 41 |
| Cu2S NRs@Cu foam | 11![[thin space (1/6-em)]](https://www.rsc.org/images/entities/char_2009.gif) 750.8 750.8 |
0.07 | 0.0002–0.63 | This work |
One important parameter for evaluating the performance of the glucose sensor is the ability to distinguish the interferents from the real sample. We investigate the interferences from UA, fructose, DA and AA toward the determination of glucose. In practice, the normal physiological level of glucose is about 3–8 mM, which is 30 times that of interfering species such as UA (0.1 mM) and AA (0.1 mM). Thus, the interference test is carried out by successive injection of 1.0 mM glucose and 0.10 mM interfering species. As described in Fig. 5D, the current response of interferents causes negligible interference to the current response of glucose. Thus, we can infer that the Cu2S NRs@Cu foam can show satisfactory anti-interference ability for glucose detection.
The reproducibility and long term stability are two important factors for assessing the performance of sensors. The repeatability of the Cu2S NRs@Cu foam electrode is examined for 0.1 mM glucose, and the relative standard deviation (RSD) for six detections is 3.26%, showing an acceptable repeatability. The RSD of current signals for the measurement of 0.1 mM glucose at six independently prepared sensors is 2.12%, which proves an excellent reproducibility of the sensor preparation. The long-term stability of the Cu2S NRs@Cu foam electrode is also examined. The current–time response towards 5 μM glucose is recorded for a week. The amperometric response still retains 94.8% of the initial value after two weeks, indicating the excellent stability of the electrode.
The obtained recoveries of the proposed method ranges from 97.65% to 98.53%. For comparison, the concentrations of glucose in these samples are also detected using a spectrophotometric method. The results tested by both methods showed a good agreement. These results indicate that the proposed Cu2S NRs@Cu foam has an excellent accuracy for glucose sensing, and could be applied to the determination of glucose in human serum samples.
We can analyze and evaluate glucose in real samples such as diluted serum of healthy human volunteers by the electrochemical determination technique. 10 μL of serum sample is added to 4 mL of 0.1 M NaOH solution, and the current response is recorded at 0.45 V, as depicted in Table S1.†
3.3 Electrocatalytic reduction of hydrogen peroxide at Cu2S NRs@Cu foam electrode
The electrochemical activity of the Cu2S NRs@Cu foam toward hydrogen peroxide reduction is characterized in the range from −0.7 to 0 V by CVs in N2-saturated 0.1 M PBS solution (pH 7.4), as described in Fig. 6A. After addition of 1 mM glucose, the Cu2O NRs@Cu foam shows an oxidation peak at about −0.3 V. However, the oxidation peak of the Cu2S NRs@Cu foam appears at −0.2 V. The lower potential of the Cu2S NRs@Cu foam is beneficial for the electrocatalytic reduction activity. When 1, 2, 3, 4 and 5 mM H2O2 are added, it can be observed that the anodic peak current at −0.25 V increased remarkably and linearly upon addition of H2O2, revealing an obvious electrocatalytic reduction of H2O2.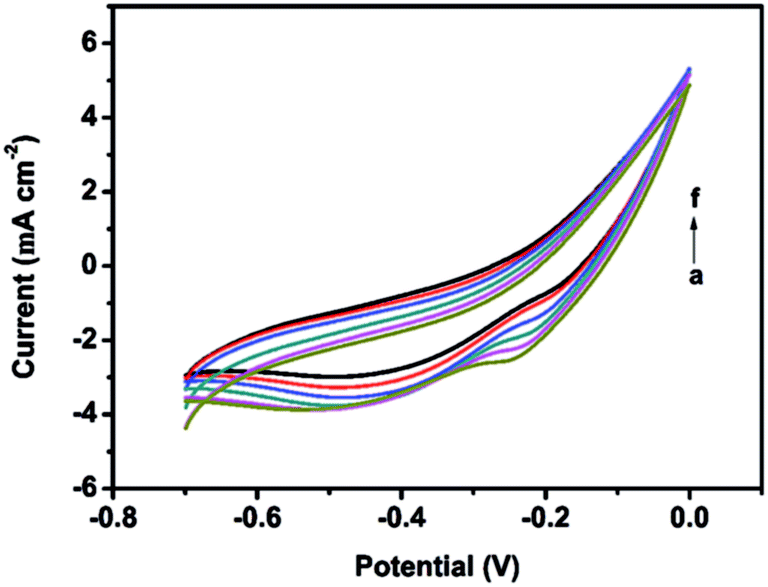 | ||
| Fig. 6 CVs of Cu2S NRs@Cu foam in the absence and presence of H2O2 with different concentrations (from the bottom to top: 0–5 mM) in 0.1 M PBS buffer solution. Scan rate: 50 mV s−1. | ||
The time–current (I–T) curve of the Cu2S NRs@Cu foam and the Cu foam electrode are implemented and compared by subsequent addition of H2O2 in 0.1 M PBS solution at −0.2 V, as displayed in Fig. 7A–C and S2.† The linear regression equation is as follows: I (mA cm−2) = −1.686C − 0.0552 (mM) (R = 0.9985). The linear range is from 1 μM to 0.73 mM, and the limit of detection (LOD) of H2O2 is estimated to be 0.2 μM, which is lower than some Cu2S-based biosensors (Table 2). These results suggest that the Cu2S NRs@Cu foam electrode is a good sensor toward the detection of H2O2.
 | ||
| Fig. 7 (A) Typical amperometric response of the Cu2S NRs@Cu foam electrode at the potential of −0.2 V vs. SCE with the successive addition of glucose from 1 μM to 730 μM in 0.1 M PBS solution. (B) Amperometric response towards 1–5 μM H2O2. (C) The corresponding calibration curve of the Cu2S NRs@Cu foam in 0.1 M NaOH solution. (D) Amperometric response of the Cu2S NRs@Cu foam towards the addition of 50 μM H2O2 and various 100 μM interfering species in 0.1 M PBS solution at −0.2 V vs. SCE. | ||
| Type of electrode | Sensitivity (μA mM−1 cm−2) | Detection limit (μM) | Linear range (μM) | Reference |
|---|---|---|---|---|
| a Multiwalled carbon nanotubes.b Cu2S nanoplates.c Ordered mesoporous carbons. | ||||
| Cu2S-MWCNRa | 14.06 | 0.44 | 2.5–300 | 25 |
| Cu2S NPsb | 50.6 μA mM−1 | 1.5 | 5.0–1500 | 38 |
| Cu2S@OMCsc | 0.23 | 1.4 | 10–1400 | 41 |
| Cu2S NRs@Cu foam | 745 | 0.12 | 0.25–5000 | This work |
To evaluate the selectivity of the proposed H2O2 biosensor, the influence of three possible interfering biomolecules (DA, UA, and AA) for the Cu2S NRs@Cu foam electrode is investigated at −0.2 V. As depicted in Fig. 7D, an obvious current response to the addition of 50 μM H2O2 is observed, while the current response is negligible with the addition of 100 μM DA, UA and AA in the same sample. To sum up, interfering biomolecules cause almost no interference for the determination of H2O2.
The tests of reproducibility and stability are vital for the Cu2S NRs@Cu foam electrode. The repeatability of the Cu2S NRs@Cu foam electrode is examined for 0.1 mM H2O2, and the relative standard deviation (RSD) for six detections is 0.49%, showing an acceptable repeatability. The RSD of current signals for the measurement of 0.1 mM H2O2 at six independently prepared sensors is 2.03%, which proves the excellent reproducibility of the sensor preparation. The long-term stability of the Cu2S NRs@Cu foam electrode is also examined.
The current–time response towards 5 μM H2O2 was recorded for a week. The amperometric response still retains 95.6% of the initial value after two weeks, indicating the excellent stability of the electrode.
4. Conclusions
To conclude, Cu2S nanorods supported on copper foam as the enzyme-free glucose sensor are prepared in situ by a green and simple method. Copper foam as the current collector provides a large number of active sites for the formation of Cu2S nanorods and facilitates charge and mass transfer for electrocatalysis. Compared to other Cu2S nanomaterials, the Cu2S NRs@Cu foam sensor exhibits extremely high electrocatalytic performance for glucose and H2O2 with ultrahigh sensitivity and a low detection limit. Furthermore, the biosensor also displays good selectivity to glucose and H2O2 detection. Our present work is very interesting and significant, and it provides a general strategy for the fabrication of Cu2S-based electrodes for applications in glucose and H2O2 biosensors.Acknowledgements
This work was financially supported by the National Natural Science Foundation of China (21275135, 21405146).Notes and references
- V. Scognamiglio, Biosens. Bioelectron., 2013, 47, 12–25 CrossRef CAS PubMed
.
- E. H. Yoo and S. Y. Lee, Sensors, 2010, 10, 4558–4576 CrossRef PubMed
- J. Wang, Chem. Rev., 2008, 108, 814–825 CrossRef CAS PubMed
- Y. Jiang, H. Zhao, Y. Lin, N. Zhu, Y. Ma and L. Mao, Angew. Chem., 2010, 122, 4910–4914 CrossRef
- Y. Song, K. Qu, C. Zhao, J. Ren and X. Qu, Adv. Mater., 2010, 22, 2206–2210 CrossRef CAS PubMed
- Y. Jv, B. Li and R. Cao, Chem. Commun., 2010, 46, 8017–8019 RSC
- Y. Song, W. Wei and X. Qu, Adv. Mater., 2011, 23, 4215–4236 CrossRef CAS PubMed
- L. Meng, J. Jin, G. Yang, T. Lu, H. Zhang and C. Cai, Anal. Chem., 2009, 81, 7271–7280 CrossRef CAS PubMed
- X. Chen, H. Pan, H. Liu and M. Du, Electrochim. Acta, 2010, 56, 636–643 CrossRef CAS
- S. Hui, J. Zhang, X. Chen, H. Xu, D. Ma, Y. Liu and B. Tao, Sens. Actuators, B, 2011, 155, 592–597 CrossRef CAS
- J. M. You, Y. N. Jeong, M. S. Ahmed, S. K. Kim, H. C. Choi and S. Jeon, Biosens. Bioelectron., 2011, 26, 2287–2291 CrossRef CAS PubMed
- P. Ma, H. Zhu, J. Wei and M. Zhang, Nanosci. Nanotechnol. Lett., 2015, 7, 127–133 CrossRef
- M. W. Shao, Y. Y. Shan, N. B. Wong and S. T. Lee, Adv. Funct. Mater., 2005, 15, 1478–1482 CrossRef CAS
- S. Wu, H. Zhao, H. Ju, C. Shi and J. Zhao, Electrochem. Commun., 2006, 8, 1197–1203 CrossRef CAS
- T. You, O. Niwa, M. Tomita and S. Hirono, Anal. Chem., 2003, 75, 2080–2085 CrossRef CAS PubMed
- S. Ci, T. Huang, Z. Wen, S. Cui, S. Mao, D. A. Steeber and J. Chen, Biosens. Bioelectron., 2014, 54, 251–257 CrossRef CAS PubMed
- L. Su, W. Qin, H. Zhang, Z. U. Rahman, C. Ren, S. Ma and X. Chen, Biosens. Bioelectron., 2015, 63, 384–391 CrossRef CAS PubMed
- S. He, B. Zhang, M. Liu and W. Chen, RSC Adv., 2014, 4, 49315–49323 RSC
- D. Chirizzi, M. R. Guascito, E. Filippo, C. Malitesta and A. Tepore, Talanta, 2016, 147, 124–131 CrossRef CAS PubMed
- Y. Li, Y. Zhong, Y. Zhang, W. Weng and S. Li, Sens. Actuators, B, 2015, 206, 735–743 CrossRef CAS
- C. Dong, H. Zhong, T. Kou, J. Frenzel, G. Eggeler and Z. Zhang, Top. Appl. Phys., 2015, 7, 20215–20223 CAS
- W. Lu, Y. Sun, H. Dai, P. Ni, S. Jiang, Y. Wang, Z. Li and Z. Li, RSC Adv., 2016, 6, 16474–16480 RSC
- W. Lu, Y. Sun, H. Dai, P. Ni, S. Jiang, Y. Wang, Z. Li and Z. Li, Sens. Actuators, B, 2016, 231, 860–866 CrossRef CAS
- M. Savelli, J. Bougnot and B. Seraphin, Top. Appl. Phys., 1979, 31, 213 CrossRef CAS
- H. Lee, S. W. Yoon, E. J. Kim and J. Park, Nano Lett., 2007, 7, 778–784 CrossRef CAS PubMed
- I. Pop, C. Nascu, V. Ionescu, E. Indrea and I. Bratu, Thin Solid Films, 1997, 307, 240–244 CrossRef CAS
- J. Chen, S. Deng, N. Xu, S. Wang, X. Wen, S. Yang, C. Yang, J. Wang and W. Ge, Appl. Phys. Lett., 2002, 80, 3620–3622 CrossRef CAS
- Y. Wu, C. Wadia, W. Ma, B. Sadtler and A. P. Alivisatos, Nano Lett., 2008, 8, 2551–2555 CrossRef CAS PubMed
- T. H. Larsen, M. Sigman, A. Ghezelbash, R. C. Doty and B. A. Korgel, J. Am. Chem. Soc., 2003, 125, 5638–5639 CrossRef CAS PubMed
- Z. Zhuang, Q. Peng, B. Zhang and Y. Li, J. Am. Chem. Soc., 2008, 130, 10482–10483 CrossRef CAS PubMed
- I. Jen La Plante, T. W. Zeid, P. Yang and T. Mokari, J. Mater. Chem., 2010, 20, 6612–6617 RSC
- M. B. Sigman, A. Ghezelbash, T. Hanrath, A. E. Saunders, F. Lee and B. A. Korgel, J. Am. Chem. Soc., 2003, 125, 16050–16057 CrossRef CAS PubMed
- Z. Liu, D. Xu, J. Liang, J. Shen, S. Zhang and Y. Qian, J. Phys. Chem. B, 2005, 109, 10699–10704 CrossRef CAS PubMed
- L. Chen, Y. B. Chen and L. M. Wu, J. Am. Chem. Soc., 2004, 126, 16334–16335 CrossRef CAS PubMed
- H. T. Zhang, G. Wu and X. H. Chen, Langmuir, 2005, 21, 4281–4282 CrossRef CAS PubMed
- X. S. Du, Z. Z. Yu, A. Dasari, J. Ma, Y. Z. Meng and Y. W. Mai, Chem. Mater., 2006, 18, 5156–5158 CrossRef CAS
- Y. Liu, Y. Deng, Z. Sun, J. Wei, G. Zheng, A. M. Asiri, S. B. Khan, M. M. Rahman and D. Zhao, Small, 2013, 9, 2702–2708 CrossRef CAS PubMed
- X. Bo, J. Bai, L. Wang and L. Guo, Talanta, 2010, 81, 339–345 CrossRef CAS PubMed
- J. Jin, G. Zheng, Y. Ge, S. Deng, W. Liu and G. Hui, Electrochim. Acta, 2015, 153, 594–601 CrossRef CAS
- X. Zhang, L. Wang, R. Ji, L. Yu and G. Wang, Electrochem. Commun., 2012, 24, 53–56 CrossRef
- S. K. Maji, A. K. Dutta, G. R. Bhadu, P. Paul, A. Mondal and B. Adhikary, J. Mater. Chem. B, 2013, 1, 4127–4134 RSC
Footnote |
| † Electronic supplementary information (ESI) available. See DOI: 10.1039/c6ra18641f |
| This journal is © The Royal Society of Chemistry 2016 |