DOI:
10.1039/C6RA17863D
(Paper)
RSC Adv., 2016,
6, 85838-85843
Boranil dye based “turn-on” fluorescent probes for detection of hydrogen peroxide and their cell imaging application†
Received
13th July 2016
, Accepted 3rd September 2016
First published on 5th September 2016
Abstract
The synthesis of boranil dye fluorescent probes for the detection of hydrogen peroxide has been described. The probes exhibited high selectivity in sensing hydrogen peroxide among other reactive oxygen species, reactive nitrogen species and biologically pertinent species. The probes display good sensitivity and a rapid response time. The sensing mechanism was ascertained by ESI-MS analysis and density functional theory (DFT) calculations. The probes have been successfully applied for imaging of H2O2 in HeLa cells under physiological conditions.
Introduction
It is known that reactive oxygen species and reactive nitrogen species play crucial roles in human cancer growth.1 Reactive nitrogen species (RNS) include nitric oxide radicals (NO˙), ONOO−, nitrogen dioxide radicals (NO2˙) and other products arising while NO˙ reacts with O2˙−, RO˙ and RO2˙.2 RNS have been distinguished as a critical protagonist in the physiological regulation of smooth muscle cells, nervous cells, juxtaglomerular cells, and platelets.3 The body produces reactive oxygen species (ROS) such as hydrogen peroxide, superoxide (O2−) and hydroxyl radical (˙OH) singlet oxygen (1O2), hypochlorous acid/hypochlorite, peroxyl radicals (˙OOR) during the metabolism processes, which lead to an inexorable influence of aerobic metabolism and in pathogenesis of cancer, cardiovascular diseases and neurodegeneration.4 Hydrogen peroxide is one of the most important reactive oxygen species in living systems5 and intracellular production of H2O2 is interconnected to the accomplishments of certain enzymes that have been associated in vital cellular processes, including cytotoxicity, apoptosis, proliferation and cell growth.6 However, the extreme production of H2O2 can detract cellular structures or biomolecules7 and may cause the oxidative modifications of DNA bases, the production of alkali labile sites and strand breaks, which encourage mutations aging, Alzheimer's disease and even cancer.8 Still, hydrogen peroxide is recognized as an applicant in slaying of pathogenic microbe9 and a physiological regulator of intracellular signalling conduits.10 Hence, effectual monitoring of ROS in the living cells and tissues is very critical for normal body processes and is supportive to estimate the biological functions.11 Several probes, including proteomics probes and fluorescent probes have been tested for the detection of H2O2 in the living cells.12 Chemical approaches comprising colorimetric method,13 fluorimetric method,14 electrochemical method,15 and mass spectrometry analysis16 have also been developed to detect hydrogen peroxide. But fluorescent probes ensure higher selectivity and sensitivity as well as real-time imaging and in recent years, fluorescent probes have emerged as excellent tools for the detection of ROS in living cells and biological molecules.17 Certain fluorescence probes based on boronate ester or benzenesulfonyl ester have been reported.18 Elucidation of the outcome from the reported turn-on probes could be difficult and complex.12–19 However, currently boranil dye based fluorescent probes are not available for the detection of H2O2. From this point of view, we have developed very stable and pH independent boranil dye based probes using a low cost and easy synthetic methodology for the detection of H2O2 selectively among various ROS and RNS, the applicability of which has been extended towards the imaging of H2O2 in living cells. To the best of our knowledge, reports are not available for sensing hydrogen peroxide using boranil dyes.
Boronic complexes with different chelating ligands are being used in the organic light emitting devices (OLEDs) and its dyes can be used for bio imaging and diagnostics.20 Boron(III)-containing fluorescent dyes are used in numerous fields such as material science, chemical biology and analytical chemistry.21 Schiff base boron compounds are four-coordinate boron(III) complex and have higher stability than tri-coordinate boron compounds.22 This article discloses the synthesis of boron(III) complexes of substituted anils bearing sulfide substituents and the application of the complexes for detecting H2O2 in living cells.
Experimental section
2.1. Instrumentation
Nuclear magnetic resonance (1H and 13C NMR) spectra were recorded on a 300 MHz spectrometer in CDCl3 using TMS as an internal standard. Chemical shifts are reported in parts per million (δ), coupling constants are reported in hertz (Hz) and spin multiplicities are indicated by the following symbols: s (singlet), d (doublet), t (triplet), p (pentet) and m (multiplet). 13C NMR spectra were routinely run with broadband decoupling. Elemental analyses were performed on a Perkin Elmer 2400 Series II Elemental CHNS analyzer. Mass spectra were recorded in LCQ Fleet spectrometer, Thermo Fisher Instruments Limited, US. Electrospray ionization spectrometry (ESI-MS) analysis was performed in the positive ion and negative ion mode on a liquid chromatography ion trap.
2.2. Synthesis of probes
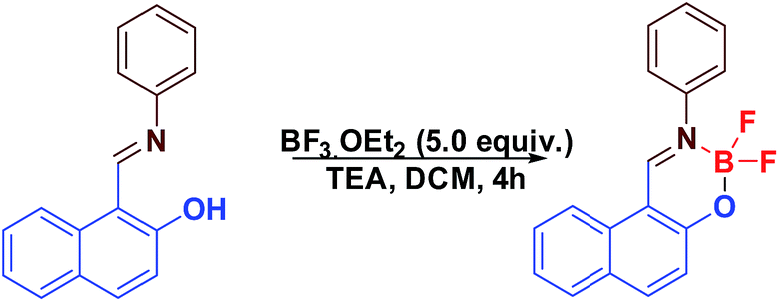
Two probes SB-1 and SB-2 have been prepared by stirring a mixture of 2-hydroxy-1-naphthaldehyde (1.0 equiv.) and 2-(methylthio/phenylthio)aniline (1.0 equiv.) in ethanol for an hour at room temperature. The resulted imine derivative (1.0 equiv.) was treated with a solution of boron trifluoride etherate (5.0 equiv.) and triethylamine (1.0 equiv.) in dichloromethane and the suspension was stirred for 4 hours. The solvent was then evaporated and the crude product was purified by column chromatography using hexane/ethyl acetate (9![[thin space (1/6-em)]](https://www.rsc.org/images/entities/char_2009.gif) :1) as the eluent yielding SB-1/SB-2 as yellow solid (Scheme 1). The idea of selecting SB-1 and SB-2 is to find out the effect of alkyl group vs. aryl group towards hydrogen peroxide sensing.
:1) as the eluent yielding SB-1/SB-2 as yellow solid (Scheme 1). The idea of selecting SB-1 and SB-2 is to find out the effect of alkyl group vs. aryl group towards hydrogen peroxide sensing.
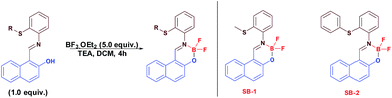 |
| | Scheme 1 Preparation of boranil complex probes for hydrogen peroxide sensing. | |
The synthesized probes were well characterized by NMR spectral techniques and ESI-MS analysis. In the 11B NMR spectrum, a signal appeared as a triplet at 0.54 ppm for SB-1 and in the 19F NMR spectrum, a four line pattern appeared at −129.36 ppm. Similarly for SB-2, the respective signals appeared at 0.65 ppm and −132.99 ppm.
Characterization data of SB-1. Isolated as yellow solid; IR (KBR): 750, 1309, 1346, 1465, 1556, 1625 cm−1; 1H NMR (300 MHz, CDCl3) δ 9.14 (s, 1H), 8.13 (d, J = 9.2 Hz, 1H), 8.02 (d, J = 8.4 Hz, 1H), 7.86 (d, J = 8.0 Hz, 1H), 7.68–7.61 (m, 2H), 7.54–7.34 (m, 3H), 7.40–7.33 (m, 2H), 2.39 (s, 3H). 13C NMR (75 MHz, CDCl3) δ 162.6, 141.1, 133.5, 131.6, 129.8 (two carbons merged), 129.6, 129.5, 129.3 (two carbons merged), 127.9, 126.7 (two carbons merged), 126.1, 125.1, 120.6, 119.1, 16.9. 11B NMR (160 MHz, CDCl3) δ 0.54 (J = 27.0 Hz). 19F NMR (471 MHz, CDCl3) δ −129.4 (J = 53.8 Hz). ESI-MS: m/z calculated: [M + Na]+ 364.18, observed: 364.14. Anal. calcd for C18H14BF2NOS: C, 63.37, H, 4.14, N, 4.11, S, 9.40%. Found: C, 63.32, H, 4.18, N, 4.14, S, 9.43%.
Characterization data of SB-2. Isolated as yellow solid; IR (KBR): 727, 1311, 1348, 1467, 1562, 1627 cm−1; 1H NMR (300 MHz, CDCl3) δ 8.96 (s, 1H), 8.10 (d, J = 8.9 Hz, 1H), 7.81 (d, J = 4.8 Hz, 2H), 7.58 (d, J = 7.5 Hz, 1H), 7.52–7.46 (m, 5H), 7.29–7.17 (m, 6H). 13C NMR (75 MHz, CDCl3) δ 161.8, 143.4, 141.2, 135.7, 135.6, 131.6, 129.9, 129.7 (two carbons merged), 129.5 (three carbons merged), 129.4, 129.2, 127.9, 127.2, 126.7, 124.9, 120.5, 119.0 (two carbons merged). 11B NMR (160 MHz, CDCl3) δ 0.65 (J = 27.2 Hz). 19F NMR (471 MHz, CDCl3) δ −133.00 (J = 53.8 Hz). ESI-MS: m/z calculated: [M + Na]+ 425.25, observed 425.12. Anal. calcd for C23H16BF2NOS: C, 68.51, H, 4.00, N, 3.47, S, 7.95%. Found: C, 68.57, H, 4.03, N, 3.44, S, 7.98%.
2.3. DFT calculations
Geometry optimizations were performed using density functional theory method at B3LYP-6-311G (d, p) level of theory in Gaussian 09 program package.
2.4. Cell culture and live cell imaging study with probes SB-1 and SB-2
HeLa cells were grown in modified Eagle's medium (DMEM) supplemented with 10% FBS (fetal bovine serum) at 37 °C. HeLa cells were incubated with probes SB-1 and SB-2 separately (5 μM in DMSO/H2O (1:9, v/v) buffered in pH = 7.54) for 30 minutes and imaged through the fluorescence microscope. The fluorescence image and bright field images of the probe treated cells were recorded. The cells were washed thrice with PBS buffer to remove the excess probes present in the cells. The cells were further incubated with H2O2 (50 μM in H2O) for 90 min at 37 °C and imaged with fluorescence microscope. The fluorescence image and bright field images of the cells were recorded.
Results and discussion
3.1. Crystal study of probes SB-1 and SB-2
The molecular structures of SB-1 and SB-2 have been confirmed by single crystal X-ray analysis (Fig. 1)23 and the data are summarized in ESI as Table S1.†
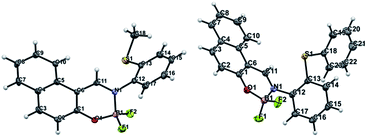 |
| | Fig. 1 Crystal structures of boranil dyes SB-1 and SB-2. ORTEP ellipsoids represent 50% probability. | |
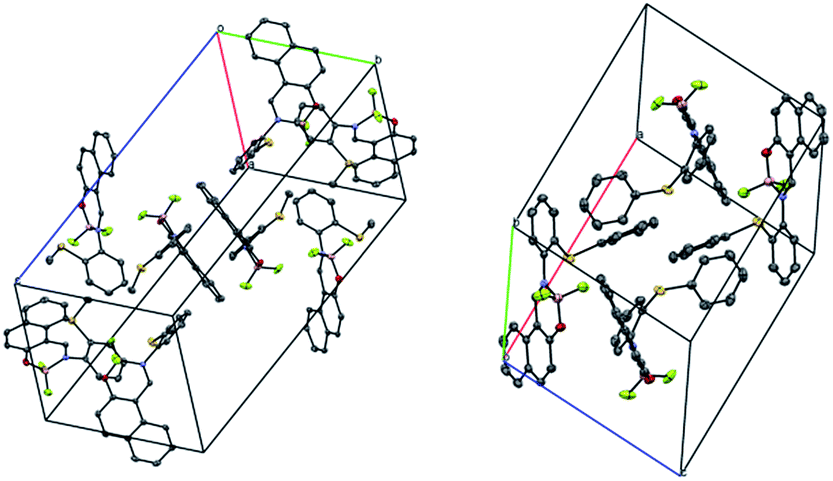
The selected bond lengths and bond angles are depicted in the Table S2.† For both the cases, the average bond length between the B–N and B–F are found in the range of 1.565 and 1.373, and average N–B–O, F–B–F, and N–B–F angles are 109.6, 111.1 and 108.1 respectively. The crystal packing diagrams (Fig. 2) shows that there is significant π–π stacking in SB-1 between the naphthalene rings. But in SB-2, the π–π stacking is not observed which may be attributed to the disturbance in S-phenyl ring.
 |
| | Fig. 2 Molecular structure (unit cell) of SB-1 and SB-2. Hydrogen atoms are omitted for clarity. | |
3.2. Spectral characterization of probes SB-1 and SB-2
The absorption spectrum of SB-1 (10 μM, pH = 7.4 PBS buffer) showed absorbance at 303 nm and 363 nm corresponding to π–π* transitions and SB-2 showed a band 371 nm and a shoulder at 430 nm. The preliminary spectroscopic studies on SB-1 and SB-2 were carried out by monitoring the changes in the absorbance upon the addition of various reactive oxygen species and reactive nitrogen species such as NO, H2O2, ClO−, NO3−, NO2−, ROO−, ONOO, O2, t-BuOOH, ascorbic acid, GSH and HO− under the physiological buffer condition (10 mM, PBS buffer pH 7.4). No appreciable change has been noticed by the addition of ROS and RNS (Fig. S11 and S12, see ESI†). The fluorescence spectra of SB-1 and SB-2 showed a very weak emission maximum at 503 nm and 510 nm respectively, while exciting at 370 nm. The weaker fluorescence emission of SB-1 and SB-2 is attributed to the photo induced electron transfer (PET) from sulfur to the boranil unit.
It is noted that the fluorescence emission of SB-1 was enhanced at 503 nm with hydrogen peroxide. Similarly the fluorescence emission intensity of SB-2 was increased by the addition of hydrogen peroxide whereas NO, ClO−, NO3−, NO2−, ROO−, ONOO, O2, t-BuOOH, ascorbic acid, GSH and HO− did not exhibit any fluorescence enhancement (Fig. 3 and 4). The probes showed the linear response in enhancement of fluorescence with varying amount of hydrogen peroxide in the range 0–100 μM (Fig. 5 and 6). The solutions of SB-1 and SB-2 treated with hydrogen peroxide emit a bright green fluorescence visible to the naked eye under a portable UV light (Fig. 7). In the presence of H2O2, there is an increase in the fluorescence quantum yield of SB-1–H2O2 (0.68) and SB-2–H2O2 (0.54) compared to the probes SB-1 (0.0023) and SB-2 (0.0028). We reasoned that due to the steric hindrance, sulfur atom in the probe SB-1 easily gets oxidized with H2O2.
 |
| | Fig. 3 Fluorescence emission spectra of SB-1 (10 μM) in 100 mM phosphate buffer (pH 7.54) in the presence of various RNS and ROS such as NO, H2O2, ClO−, NO3−, NO2−, ROO−, ONOO, O2, t-BuOOH, ascorbic acid, GSH and HO− (1 mM). Excitation wavelength: 370 nm. Slit width: 5 nm/5 nm. | |
 |
| | Fig. 4 Fluorescence emission spectra of SB-2 (10 μM) in 100 mM phosphate buffer (pH 7.54) in the presence of various RNS and ROS such as NO, H2O2, ClO−, NO3−, NO2−, ROO−, ONOO, O2, t-BuOOH, ascorbic acid, GSH and HO− (1 mM). Excitation wavelength: 370 nm. Slit width: 5 nm/5 nm. | |
 |
| | Fig. 5 Fluorescence emission spectra of SB-1 (10 μM) in 100 mM phosphate buffer (pH 7.54) upon the addition of increasing amount of hydrogen peroxide (0–100 μM). Excitation wavelength: 370 nm. Slit width: 5 nm/5 nm. | |
 |
| | Fig. 6 Fluorescence emission spectra of SB-2 (10 μM) in 100 mM phosphate buffer (pH 7.54) on the addition of increasing amount of hydrogen peroxide (0–100 μM). Excitation wavelength: 370 nm. Slit width: 5 nm/5 nm. | |
 |
| | Fig. 7 Treatment of probes with H2O2 under UV light. | |
In order to study the role of sulfur group in these probes, we synthesized the boranil derivative without sulfur group, SB-3 (Scheme 2). The treatment of hydrogen peroxide with SB-3 did not result in any observable fluorescence even after 1 hour, emphasising the role sulfur group in hydrogen peroxide sensing.
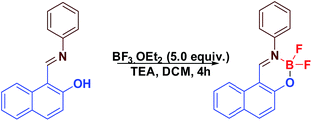 |
| | Scheme 2 Preparation of SB-3. | |
The response times of the fluorescent emission of probes SB-1 and SB-2 (5 μM) in DMSO/phosphate buffer (1:99 v/v, 20 mM, pH 7.4) in the presence of hydrogen peroxide (10 equiv.) were recorded and found to be 12 minutes for probe SB-1 and 22 minutes for probe SB-2. The delayed response of the probe SB-2 is attributed to the steric hindrance of the phenyl group attached on the sulfur (Fig. S13 and S14, see ESI†). The quick response of the sensors SB-1 and SB-2 makes them more advantageous for detection of hydrogen peroxide and imaging in the living cells and biological systems.
The fluorescence emission titration experiments of the probes SB-1 and SB-2 (5 μM) with various concentrations of H2O2 were also carried out in the PBS buffer (1% DMSO as co solvent, 20 mM, pH 7.4). The fluorescence intensity is increased with increasing H2O2 concentration (Fig. S15 and S16, see ESI†) with a linear relationship. The limits of detection of the probes SB-1 and SB-2 for H2O2 were found to be 70.27 nM and 31.27 nM respectively (3σ/m, in which σ is the standard deviation of blank measurements, and m is the slope of the linear equation).24 The effect of pH on the fluorescence of the probes has been studied and it is found that these probes are insensitive towards the pH; in both basic and acidic pH ranges, the probes remain non-fluorescent (Fig. S17†).
In order to identify the products of the reaction of H2O2 with SB-1 and SB-2, the reaction mixture was subjected to ESI-MS. The ESI-MS spectrum of the reaction solution of SB-1 with H2O2 showed peak at m/z 380.78 [M + Na]+ which corresponds to that of sulfoxide of SB-1. Similarly SB-2 with H2O2 showed the m/z = [M + H]+ 420.30 indicating the conversion of sulfide to sulfoxide. The appearance of new band for distinctive sulfoxide at 1217 and 1224 cm−1 respectively in the IR spectra of these cases further confirmed the sulfoxide formation.
3.3. DFT calculations
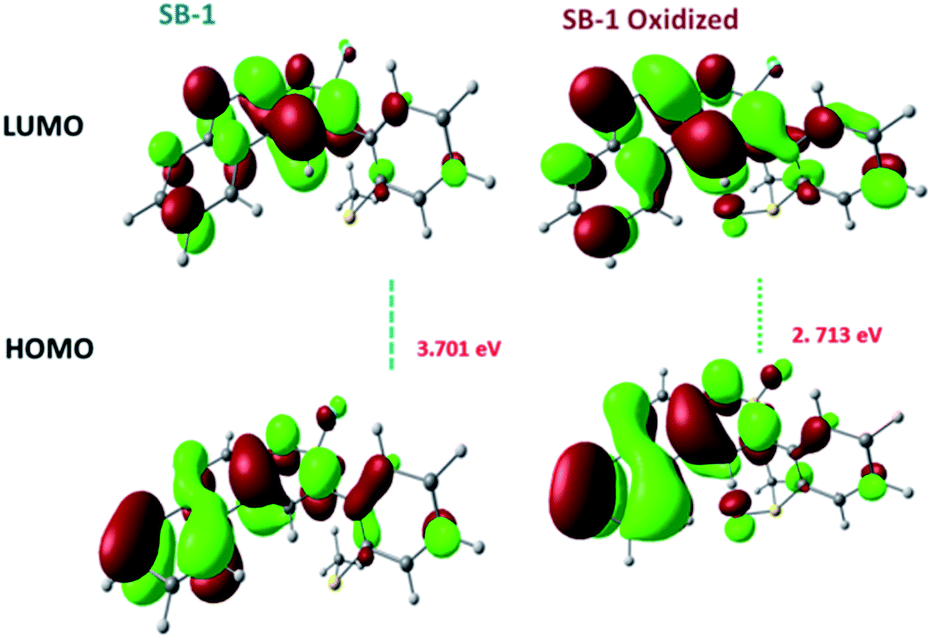
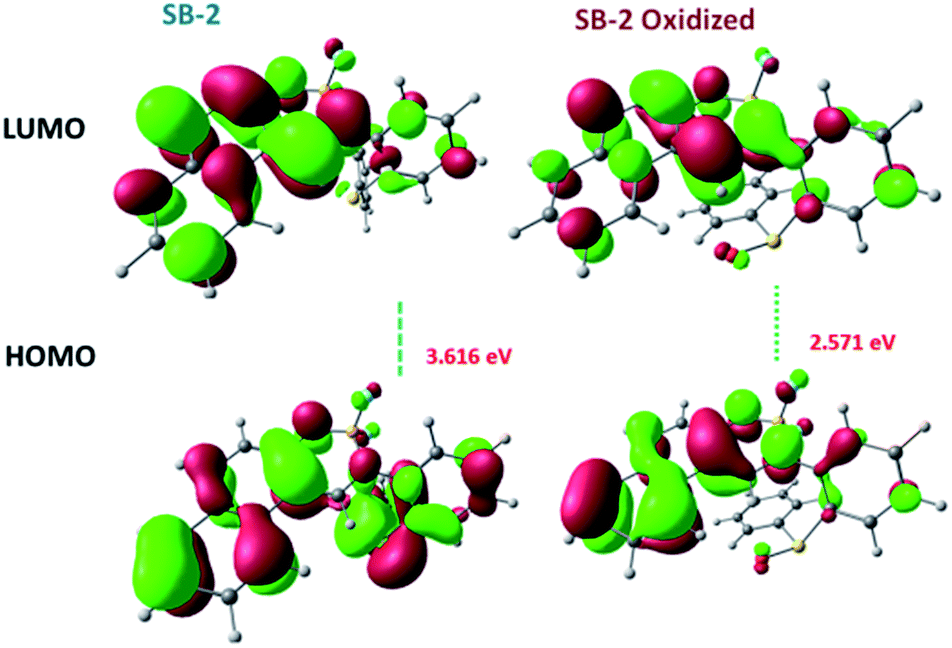
The mechanism of the observed photophysical responses of the probes SB-1 and SB-2 with H2O2 has been analysed by density functional theory (DFT) calculation using the Gaussian 09 program.25 The geometries of the probe SB-1 and SB-2 and the reaction products of SB-1 and SB-2 with H2O2 were optimized by B3LYP/6-311G (d,p) method basis sets and their corresponding transitions are calculated from TDDFT calculations using the above said sets. The optimized geometries are shown in the Fig. S18 and S19 of ESI.† In SB-1, the whole boranil unit except S-methyl behaves as HOMO as well as LUMO, whereas in the oxidized SB-1, the boron fluoride with naphthyl unit acts as HOMO and LUMO spreading over the whole π-moiety (Fig. 8). In SB-2, the HOMO is residing on boranil unit with S-phenyl group and the naphthyl unit alone behaves as LUMO (Fig. 9). In sulfoxide form of SB-2, naphthyl ring with boranil unit behaves as HOMO, while the whole pi moiety behaves as LUMO. The calculated absorption spectral wavelengths of the SB-1 and SB-2 were 373 nm and 390 nm respectively with oscillator strengths of 0.09487 and 0.0884, whereas in the oxidized forms of SB-1 and SB-2 absorption spectral wavelengths were at 389 nm and 413 nm respectively with oscillator strength of 0.8941 and 0.794. In both the cases, the predicted absorption spectra were found to be in good agreement with experimentally observed ones. The S0 → S1 transition in SB-1 and SB-2 involves mainly HOMO−1 → LUMO (>80%) with very high oscillator strength. This confirms that the photo induced electron transfer (PET) between sulfur and boranil takes place quenching the fluorescence. In oxidized forms of SB-1 and SB-2, S0 → S1 transition predominantly involves HOMO–LUMO (>93%) transitions with high oscillator strength. The observed changes in molecular orbitals clearly show that the observed photophysical changes are due to inhibition of PET.
 |
| | Fig. 8 Frontier molecular orbitals (FMO'S) of SB-1 and sulfoxide of SB-1 obtained from the DFT calculations using Gaussian 09 program. | |
 |
| | Fig. 9 Frontier molecular orbitals (FMO'S) of SB-2 and sulfoxide of SB-2 obtained from the DFT calculations using Gaussian 09 program. | |
3.4. Cell imaging studies
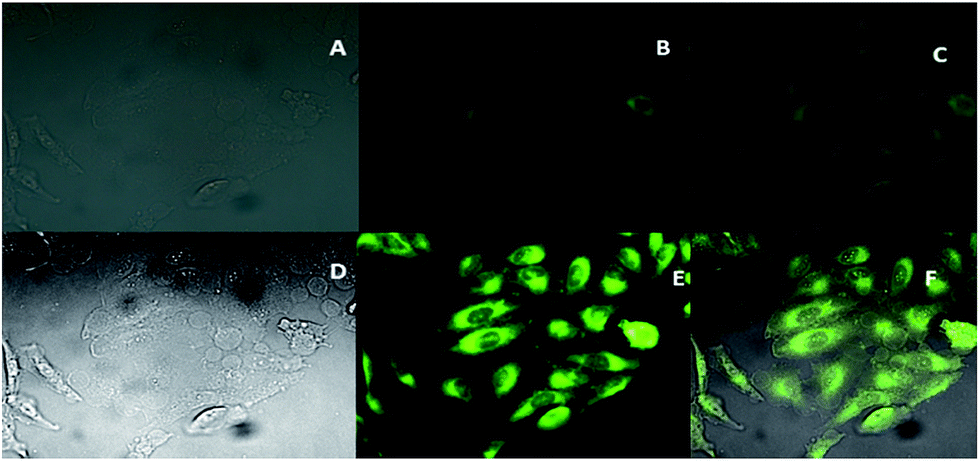
The probes SB-1 and SB-2 tested for its ability to detect H2O2 in living cells. The cytotoxicity of the probes SB-1 and SB-2 were studied by MTT assay and they were found to be non-toxic to the cell lines (Fig. S18†). Human cervical cancer HeLa cells loaded with 5 μM SB-1 and SB-2 for an hour at 37 °C were exposed to fluorescence microscopy. They showed very faint fluorescence in intracellular regions. The cells were washed thrice with buffer to remove the excess probes. The probes pre-treated cells were treated with 50 μM H2O2 for 30 min to generate a prominent increase of bright-green fluorescence in intra cellular regions. The bright field images of the probes treated cells indicate that the cells are viable throughout the imaging experiments. These results indicate that probes SB-1 and SB-2 are cell permeable and effective hydrogen peroxide fluorescence imaging agents in the cells (Fig. 10 and 11).
 |
| | Fig. 10 (A) Bright field images of HeLa cells incubated with SB-1 (5 μM) for 30 min at 37 °C. (B) Fluorescence microscopic images of HeLa cells incubated with SB-1 (5 μM). (C) Merged images of (A) and (B). (D) Bright field images SB-1 pre-treated HeLa cells and again treated with 50 μM H2O2 for 90 min. (E) Fluorescence microscopic images HeLa cells incubated with probe SB-1 and 50 μM H2O2 for 90 min. (F) Merged images of (E) and (F). | |
 |
| | Fig. 11 (A) Bright field images of HeLa cells incubated with SB-2 (5 μM) for 30 min at 37 °C. (B) Fluorescence microscopic images of HeLa cells incubated with SB-2 (5 μM). (C) Merged images of (A) and (B). (D) Bright field images SB-2 pre-treated HeLa cells and again treated with 50 μM H2O2 for 90 min. (E) Fluorescence microscopic images HeLa cells incubated with probe SB-2 and 50 μM H2O2 for 90 min. (F) Merged images of (E) and (F). | |
Conclusions
We designed and synthesized boranil dye based new fluorescent probes for sensitive and fast detection of H2O2. The probes exhibited high selectivity towards H2O2 among other reactive oxygen species (ROS), reactive nitrogen species (RNS), and biologically relevant species. The reaction mechanism was confirmed by ESI-MS and the sensing mechanism was supported by density functional theory (DFT) calculations. Further, the probes SB-1 and SB-2 have been successfully applied for imaging of H2O2 in HeLa cells under physiological conditions.
Acknowledgements
The authors thank DST, New Delhi for funds under IRHPA program towards high resolution NMR spectrometer to Madurai Kamaraj University. J. S greatly acknowledges the management of Thiagarajar College of Engineering, Madurai for instrumental facility.
Notes and references
-
(a) J. R. Totter, Proc. Natl. Acad. Sci. U. S. A., 1980, 77, 1763 CrossRef CAS PubMed;
(b) B. N. Ames, Free Radical Res. Commun., 1989, 7, 121 CrossRef CAS;
(c) H. Oshima and H. Bartsch, Mutat. Res., 1994, 305, 253 CrossRef;
(d) P. Cerutti, Lancet, 1994, 344, 862 CrossRef CAS PubMed;
(e) D. I. Feig, T. M. Reid and L. A. Loeb, Cancer Res., 1994, 54, 1890 Search PubMed.
- H. Wiseman and B. Halliwell, Biochem. J., 1996, 313, 17 CrossRef CAS PubMed.
- M. C. Martínez and R. Andriantsitohaina, Antioxid. Redox Signaling, 2009, 11, 669 CrossRef PubMed.
-
(a) T. Finkel, M. Serrano and M. A. Blasco, Nature, 2007, 448, 767 CrossRef CAS PubMed;
(b) J. K. Andersen, Nat. Rev. Neurosci., 2004, 5, S18 CrossRef PubMed;
(c) K. K. Griendling and G. A. FitzGerald, Circulation, 2003, 108, 912 CrossRef PubMed.
-
(a) J. M. McCord and I. Fridovich, J. Biol. Chem., 1969, 244, 6049 CAS;
(b) T. L. Vanden Hoek, L. B. Becker, Z. Shao, C. Li and P. T. Schumacker, J. Biol. Chem., 1998, 273, 18092 CrossRef CAS PubMed.
-
(a) R. E. Parchment and G. B. Pierce, Cancer Res., 1989, 49, 6680 CAS;
(b) R. D. Allen and T. K. Roberts, Am. J. Reprod. Immunol. Microbiol., 1986, 11, 59 CrossRef CAS PubMed;
(c) J. W. Tetrud and J. W. Langston, Science, 1989, 245, 519 CAS.
-
(a) E. R. Stadtman, Free Radical Res., 2006, 40, 1250 CrossRef CAS PubMed;
(b) I. Levitan, S. Volkov and P. V. Subbaiah, Antioxid. Redox Signaling, 2010, 13, 39 CrossRef CAS PubMed;
(c) S. Kanvah, J. Joseph, G. B. Schuster, R. N. Barnett, C. L. Cleveland and U. Landman, Acc. Chem. Res., 2010, 43, 280 CrossRef CAS PubMed.
-
(a) S. Loft and H. E. Poulsen, J. Mol. Med., 1996, 74, 297 CrossRef CAS PubMed;
(b) Y. Wen, K. Liu, H. Yang, Y. Liu, L. Chen, Z. Liu, C. Huang and T. Yi, Anal. Chem., 2015, 87, 10579 CrossRef CAS PubMed;
(c) V. A. Bohr, Free Radical Biol. Med., 2002, 32, 804 CrossRef CAS;
(d) C. Behl, J. B. Davis, R. Lesley and D. Schubert, Cell, 1994, 77, 817 CrossRef CAS PubMed.
-
(a) W. M. Nauseef, Immunol. Rev., 2007, 219, 88 CrossRef CAS PubMed;
(b) R. Minakami and H. Sumimoto, Int. J. Hematol., 2006, 84, 193 CrossRef CAS PubMed.
-
(a) S. G. Rhee, Science, 2006, 312, 1882 CrossRef PubMed;
(b) B. D'Autreauz and M. B. Toledano, Nat. Rev. Mol. Cell Biol., 2007, 8, 813 CrossRef PubMed;
(c) C. C. Winterbourn, Nat. Chem. Biol., 2008, 4, 278 CrossRef CAS PubMed;
(d) T. J. Finkel, J. Cell Biol., 2011, 194, 7 CrossRef CAS PubMed;
(e) M. Abo, Anal. Chem., 2014, 86, 5983 CrossRef CAS PubMed.
-
(a) F. He, F. Feng, S. Wang, Y. Li and D. Zhu, J. Mater. Chem., 2007, 17, 3702 RSC;
(b) X. Chen, K. A. Lee, E. M. Ha, K. M. Lee, Y. Y. Seo, H. K. Choi, H. N. Kim, M. J. Kim, C. S. Cho, S. Y. Lee, W. J. Lee and J. Yoon, Chem. Commun., 2011, 47, 4373 RSC;
(c) X. Chen, X. Tian, I. Shin and J. Yoon, Chem. Soc. Rev., 2011, 40, 4783 RSC;
(d) X. Zhou, Y. Kwon, G. Kim, J. Ryu and J. Yoon, Biosens. Bioelectron., 2015, 64, 285 CrossRef CAS PubMed.
-
(a) A. R. Lippert, G. C. Van de Bittner and C. J. Chang, Acc. Chem. Res., 2011, 44, 793 CrossRef CAS PubMed;
(b) N. K. Lifshin, E. Segal, L. Omer, M. Portnoy, R. S. Fainaro and D. Shabat, J. Am. Chem. Soc., 2013, 133, 10960 CrossRef PubMed;
(c) B. C. Dickinson, V. S. Lin and C. Chang, J. Nat. Prod., 2013, 8, 1249 Search PubMed.
- C. Matsubara, N. Kawamoto and K. Takamura, Analyst, 1992, 117, 1781 RSC.
- L.-C. Lo and C.-Y. Chu, Chem. Commun., 2003, 2728 RSC.
- D. Lu, A. Cagan, R. A. A. Munoz, T. Tangkuaram and J. Wang, Analyst, 2006, 131, 1279 RSC.
- H. M. Cocheme, A. Logan, T. A. Prime, I. Abakumova, C. Quin, S. J. McQuaker, J. V. Patel, I. M. Fearnley, A. M. James, C. M. Porteous, R. A. J. Smith, R. C. Hartley, L. Partridge and M. P. Murphy, Nat. Protoc., 2012, 7, 946 CrossRef CAS PubMed.
-
(a) Y. Wen, K. Liu, H. Yang, Y. Liu, L. Chen, Z. Liu, C. Huang and T. Yi, Anal. Chem., 2015, 87, 10579 CrossRef CAS PubMed;
(b) W. Zhang, W. Liu, P. Li, F. Huang, H. Wang and B. Tang, Anal. Chem., 2015, 87, 9825 CrossRef CAS PubMed;
(c) D. Kim, G. Kim, S. J. Nam, J. Yin and J. Yoon, Sci. Rep., 2015, 5, 8488 CrossRef CAS PubMed;
(d) J. Xu, Y. Zhang, H. Yu, X. Gao and S. Shao, Anal. Chem., 2016, 88, 1455 CrossRef CAS PubMed.
-
(a) H. Maeda, Y. Fukuyasu, S. Yoshida, M. Fukuda, K. Saeki, H. Matsuno, Y. Yamauchi, K. Yoshida, K. Hirata and K. Miyamoto, Angew. Chem., Int. Ed., 2004, 43, 2389 CrossRef CAS PubMed;
(b) E. W. Miller, O. Tulyathan, E. Y. Isacoff and C. Chang, Nat. Chem. Biol., 2007, 3, 263 CrossRef CAS PubMed;
(c) B. C. Dickinson, C. Huynh and C. J. Chang, J. Am. Chem. Soc., 2010, 132, 5906 CrossRef CAS PubMed.
-
(a) A. R. Lippert, G. C. Van de Bittner and C. J. Chang, Acc. Chem. Res., 2011, 44, 793 CrossRef CAS PubMed;
(b) E. W. Miller, B. C. Dickinson and C. J. Chang, Proc. Natl. Acad. Sci. U. S. A., 2010, 107, 15681 CrossRef CAS PubMed;
(c) G. C. Van de Bittner, E. A. Dubikovskaya, C. R. Bertozzi and C. J. Chang, Proc. Natl. Acad. Sci. U. S. A., 2010, 107, 21316 CrossRef CAS PubMed;
(d) J. Xu, Q. Li, Y. Yue, Y. Guo and S. Shao, Biosens. Bioelectron., 2014, 56, 58 CrossRef CAS PubMed.
-
(a) D. Frath, J. Massue, G. Ulrich and R. Ziessel, Angew. Chem., Int. Ed., 2014, 53, 2290 CrossRef CAS PubMed;
(b) G. W. Bauman, P. Ciećwierz, K. Durka, S. Luliński, J. Serwatowski and K. Woźniak, Inorg. Chem., 2013, 52, 10846 CrossRef PubMed;
(c) Y. Tokoro, A. Nagai and Y. Chujo, Macromolecules, 2010, 43, 6229 CrossRef CAS;
(d) F. Jäkle, Chem. Rev., 2010, 110, 3985 CrossRef PubMed;
(e) F. Jäkle, Coord. Chem. Rev., 2006, 250, 1107 CrossRef;
(f) D. Li, H. Zhang and Y. Wang, Chem. Soc. Rev., 2013, 42, 8416 RSC.
-
(a) A. Loudet and K. Burgess, Chem. Rev., 2007, 107, 4891 CrossRef CAS PubMed;
(b) G. Ulrich, R. Ziessel and A. Harriman, Angew. Chem., Int. Ed., 2008, 47, 1184 CrossRef CAS PubMed;
(c) D. Frath, J. Massue, G. Ulrich and R. Ziessel, Angew. Chem., Int. Ed., 2014, 53, 2290 CrossRef CAS PubMed.
-
(a) D. Frath, S. Azizi, G. Ulrich and R. Ziessel, Org. Lett., 2012, 14, 4774 CrossRef CAS PubMed;
(b) Q. Hou, L. Zhao, H. Zhang, Y. Wang and S. Jiang, J. Lumin., 2007, 126, 447 CrossRef CAS;
(c) D. Frath, S. Azizi, G. Ulrich, P. Retailleau and R. Ziessel, Org. Lett., 2011, 13, 3414 CrossRef CAS PubMed;
(d) J. A. Riddle, S. P. Lathrop, J. C. Bollinger and D. Lee, J. Am. Chem. Soc., 2006, 128, 10986 CrossRef CAS PubMed.
- CCDC number for SB-1: 1456040; SB-2: 1456041.
- M. Shortreed, R. Kopelman, M. Kuhn and B. Hoyland, Anal. Chem., 1996, 68, 1414 CrossRef CAS PubMed.
- M. J. Frisch, G. W. Trucks, H. B. Schlegel, G. E. Scuseria, M. A. Robb, J. R. Cheeseman, G. Scalmani, V. Barone, B. Mennucci, G. A. Petersson, H. Nakatsuji, M. Caricato, X. Li, H. P. Hratchian, A. F. Izmaylov, J. Bloino, G. Zheng, J. L. Sonnenberg, M. Hada, M. Ehara, K. Toyota, R. Fukuda, J. Hasegawa, M. Ishida, T. Nakajima, Y. Honda, O. Kitao, H. Nakai, T. Vreven, J. A. Montgomery Jr J. E. Peralta, F. Ogliaro, M. Bearpark, J. J. Heyd, E. Brothers, K. N. Kudin, V. N. Staroverov, R. Kobayashi, J. Normand, K. Raghavachari, A. Rendell, J. C. Burant, S. S. Iyengar, J. Tomasi, M. Cossi, N. Rega, J. M. Millam, M. Klene, J. E. Knox, J. B. Cross, V. Bakken, C. Adamo, J. Jaramillo, R. Gomperts, R. E. Stratmann, O. Yazyev, A. J. Austin, R. Cammi, C. Pomelli, J. W. Ochterski, R. L. Martin, K. Morokuma, V. G. Zakrzewski, G. A. Voth, P. Salvador, J. J. Dannenberg, S. Dapprich, A. D. Daniels, O. Farkas, J. B. Foresman, J. V. Ortiz, J. Cioslowski and D. J. Fox, Gaussian 09, Revision A.02, Gaussian, Inc., Wallingford CT, 2009 Search PubMed.
Footnotes |
| † Electronic supplementary information (ESI) available. CCDC 1456040 and 1456041. For ESI and crystallographic data in CIF or other electronic format see DOI: 10.1039/c6ra17863d |
| ‡ J. S, K. R and G. S contributed equally. |
|
| This journal is © The Royal Society of Chemistry 2016 |
Click here to see how this site uses Cookies. View our privacy policy here.