Scaling of mixing time for droplets of different sizes traveling through a serpentine microchannel

Yogesh M. Harshe , Michael J. van Eijk, Chris R. Kleijn, Michiel T. Kreutzer and Pouyan E. Boukany*
Department of Chemical Engineering, Delft University of Technology, van der Maasweg, 9, 2629 HZ Delft, The Netherlands. E-mail: P.E.Boukany@tudelft.nl; Fax: +31 15 278 5006; Tel: +31 15 27 89981

Received 11th July 2016 , Accepted 9th October 2016

First published on 10th October 2016


Abstract

Here, we investigate separately the dependence of the mixing time on the size and velocity of micro-droplets moving through serpentine channels. We find that the mixing time scales linearly with droplet size. All experimental data collapse on a master-line, when the convective time scale is multiplied by the dimensionless droplet size.

Microfluidic systems are popular (bio-)chemical reactors for reducing sample size and carrying out high-throughput measurements for screening and kinetic studies.1–4 In microfluidic systems, liquid flow is typically laminar over a wide range of flow rates, due to the micron-sized channels, characterized by a low Reynolds number (Re). Hence, fluid mixing across adjacent lamellae is purely dependent on diffusion, which, due to its random walk origin, is a slower and less efficient process than convective transport.5–7 Droplets moving through serpentine channels exhibit much better mixing.3,5,7–15 Firstly, droplets introduce internal circulating flow. Secondly, alternating between right and left bends repeatedly breaks centerline symmetry in opposite directions, leading to chaotic (i.e. exponentially fast) mixing as in repeated baker’s transformations.

The possibility of chaotic streamlines inside droplets in the presence of a steady internal flow (at low Re) was first identified theoretically by Bajer and Moffatt.16 Motivated by their observation, several theoretical works have further demonstrated that under such a scenario, mixing inside droplets17,18 and mass transfer from droplets19 is enhanced significantly. Later, Song et al.15 developed winding microchannels to accelerate mixing inside droplets via chaotic flow generated by the serpentine geometry. Both theoretical20–22 and experimental23 efforts, and also recently a combined4 approach, have extended this work to quantify the process of chaotic advective mixing inside droplets. According to Song et al.,23 in serpentine microfluidics the chaotic advection process leads to stretching, folding, and reorienting, analogous to the baker’s transformation, and chaotic mixing in general,1,23–26 of small fluid volumes to exponentially decrease the striation length. Thus, mixing can be very efficient for reducing the time required for diffusion across two adjacent lamella.25,26

Song et al.23 proposed a scaling law for mixing time inside droplets as τmix ∼ (aw/U)ln(Pe), where, w is the microchannel width, a is the dimensionless droplet length relative to w, U is the average velocity of the droplets, and Pe = wU/D is the Péclet number, where D is the diffusion coefficient of a tracer inside the droplet. In addition, Song et al.23 performed mixing experiments to corroborate this scaling argument by independently varying each of the parameters w, U, and D, without specifically controlling the droplet size. All their experimental data points, when plotted in terms of τmix versus (w/U)ln(Pe), collapsed onto a single line. The predicted linear dependency on droplet length a and other geometric channel parameters, however, was not addressed experimentally, and explicitly left for future work.

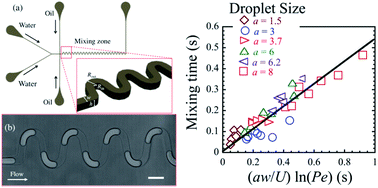
To fill this gap, we designed a serpentine microchannel similar to the work of Song et al.23 (Fig. 1(a)). We used a classical soft lithography technique to fabricate our microfluidic devices. As can be seen in Fig. 1(a) the device has two aqueous phase and two oil phase (10 cSt Silicone oil, Sigma-Aldrich) inlets. The droplets are produced at the cross junction between the water and oil phase inlets which is then followed by the windings (as shown in the inset of Fig. 1(a)), where advective mixing takes place. In Fig. 1(b) water droplets separated by the oil phase traveling through the serpentine section for one typical case are shown. It can be seen from the figure that the droplets are equidistantly separated and are of a similar size. For most of the experiments, we used a microfluidic design with dimensions as discussed in Fig. 1(b), but for a small subset we used a design with a different curvature (full details are provided in the ESI).


image file: c6ra17728j-f1.tif
Fig. 1 (a) A schematic illustration of the microfluidic device used in this work to produce droplets. Separated droplets are produced when two immiscible liquids (oil and water) are introduced into micro-channels in a controlled manner. The droplets are mixed in the serpentine channel shown in the inset. (b) Individual droplets pass through the serpentine channel (with geometrical dimensions of height h = 100 μm, width w = 100 μm, arm length Larm = 150 μm, inner and outer radius of bend = 50 and 150 μm, and angle bend = 160°) which allows for efficient mixing. Scale bar is 200 μm.

To distinguish between the effects of velocity and size on the advective mixing time within a droplet, we produced different droplet sizes at a constant overall velocity. Using the droplet size theory of van Steijn et al.,27 this was accomplished by altering the ratio of the flow rates of the continuous oil phase Qc, and the dispersed water phase Qd (see Fig. S1 in the ESI). Coflowing two streams of different aqueous concentrations of Lucifer yellow fluorescent dye (catalogue number: L0144, Sigma-Aldrich) at C1 = 2 mM and C2 = 0.5 mM produced droplets that consisted of a bottom half with high fluorescence intensity and an upper half with low fluorescence intensity, such that the entire droplet volume was clearly visible. Images of the droplets were captured using a high speed camera (Vision Research Phantom 9.1), and the resulting images were processed (see Fig. S2 and S3) to map the intensity to a scalar I, such that I = 0 corresponds to 0.5 mM and I = 1 corresponds to 2 mM. The outer rims of the top-view images were excluded from the analysis. Thus, the remaining pixels correspond to the flattened part of the droplet touching the channel walls, where the path-length of light absorption is constant, such that the intensity can be directly related to the concentration (see Fig. S4 and S5). To express the extent of mixing, the homogeneity factor was calculated from the pixels contained in the aura-removed droplet. The homogeneity factor, as defined by eqn (1), is simply the ratio of the standard deviation over the mean value of the intensity distribution of the measured pixels. As a consequence, a value of zero would correspond ideally to a completely-mixed droplet. The homogeneity factor is also known as the intensity of segregation, as the term was coined by Danckwerts,28 and it is calculated as:

 
image file: c6ra17728j-t1.tif(1)
where M [-] is the number of pixels presented in the image of an individual droplet, In [-] is the intensity corresponding to each of the pixel point in the droplet image (after removal of the rim), and Ī is the mean value of the intensity distribution image file: c6ra17728j-t2.tif. For each location in the channel, estimated by the center of mass of the droplet, an average homogeneity factor was determined from ∼150 droplets analyzed in each experiment.

Fig. 2(a) shows a processed image of droplets moving through the serpentine channel, where the left-most droplet, just entering the serpentine geometry, has a non-uniform intensity distribution, and the droplets further downstream have increasingly uniform distributions of intensity.


image file: c6ra17728j-f2.tif
Fig. 2 Fluid mixing in droplets moving through a serpentine channel. (a) Colour mapped image of droplets (a = 3) showing concentration distributions (scale bar is 300 μm). The evolution of mixing inside the droplets (b) with a = 3.0 (formed at Qd/Qc = 0.5) and (c) with a = 8.0 (formed at Qd/Qc = 2.0). Droplets were traveling at Qtotal = 10 μl min−1. Left: microphotographs of droplets at different locations and residence times (scale bars: 150 μm). Right: the evolution of the normalized intensity inside the droplets with time from when the droplets entered into the serpentine channel (approximately 150 droplets were analyzed for each set of operating conditions). The small gap in the data in (c) was due to incomplete imaging of the channel.

We now discuss two experiments, where the droplet size was changed (a = 3.0 and 8.0) while keeping the other parameters constant showing the homogeneity factor as a function of the residence time in the serpentine channel, as shown in Fig. 2(b) and (c), respectively (see ESI Movie S1 and S2). As predicted by theory,23 the time required for complete mixing is longer for the larger droplet than for the smaller droplet. The oscillations observed for θ in both figures are due to the sudden change in the direction of the flow inside the droplet along the curves of the serpentine channel, highlighting the sudden increase in the mixing rate immediately following a symmetry-breakup. The three lines in the plots correspond to the average (black line) and number averaged standard deviations (green and red lines) of the homogeneity factor at different times. For both cases, a very small standard deviation at different locations was found.

Wang et al. analyzed mixing in serpentine channels using computational-fluid-dynamics simulations.22 Their results showed that the mixing efficiency is a complex interplay of circulating flows in straight sections combined with stretch-and-fold, reorientation and symmetry breaking in curved sections. They found that mixing was fastest when a ∼ 1 and that mixing became slower with increasing a. In particular, the reorientation became insignificant for large a.

We defined the mixing time of the droplet (τmix) as the residence time where the average θ was within 10% of the steady-state value. In this particular case, for short and long droplets, respectively shown in Fig. 2(b) and (c) (right), the residence time needed to achieve complete mixing was found to be (τmix) = 0.064 and 0.22 seconds, respectively. It can be concluded that for the same overall droplet velocity, the mixing time for a droplet can be greatly altered by only changing the size of the droplet.

Next, we measured the mixing time τmix for these two droplet sizes, a = 3.0 and 8.0, now varying the average droplet velocity. Following the work of Song et al.,23 we have plotted τmix vs. image file: c6ra17728j-t3.tif (see Fig. 3). It can be clearly seen that for a = 3.0 and 8.0, two lines with distinct slopes emerge. This indicates that for the same average droplet velocity, the mixing time is dependent on the droplet size. This convincingly shows the independent effects of the droplet size and its velocity on the mixing time, in addition to the experimental dependence on the channel width reported by Song et al.23


image file: c6ra17728j-f3.tif
Fig. 3 Scaling law for the mixing time of two droplets corresponding to a = 3.0 (circles) and 8.0 (squares). The data are fitted linearly using least square linear regression. The experimental data for a = 3.0 are fitted by image file: c6ra17728j-t4.tif (solid line), and a = 8.0 are fitted by image file: c6ra17728j-t5.tif (dashed line).

Finally, we investigated the scaling of mixing time with droplet aspect ratio (a) and droplet velocity (U) by employing serpentine channels with different curvature ratios of the bends (the geometrical dimensions are shown in Fig. S6), in addition to the cases discussed in detail before. We chose three separate microfluidic devices having the same channel width and height, and a similar serpentine geometry, with different curvatures to study the mixing time inside droplets with different a values ranging from 1.5 to 8.0. For a ∼ 3.7 and 6.2, we employed a slightly larger radius ratio of the inner and outer wall of the bend (Rin/Rout = 100/200, instead of 50/150). The experimental data for a ∼ 1.5 and 6.0 have been obtained on a T-junction micro-fluidic device having a similar serpentine geometry with a sharper bend (outer radius of bend = 100 μm, and inner radius of bend is close to zero). As is shown in Fig. 4, all data points collapse on a single master-line when the convective time scale is multiplied by the dimensionless droplet size for all the data sets, as predicted by Song et al.23 Thus, it can be concluded that the effect of channel curvature is negligible or, at least, small compared to the effect of droplet size and droplet velocity in our three cases.


image file: c6ra17728j-f4.tif
Fig. 4 Scaling relationship between the mixing time inside droplets with a ranging from 1.5 to 8.0 traveling in three serpentine microfluidic channels (with Rin/Rout = 100/200, 50/150, and ∼0/100). All experimental data collapse on a master-line, when the mixing time τmix is plotted against image file: c6ra17728j-t6.tif. The experimental data are fitted linearly by the relationship image file: c6ra17728j-t7.tif, represented by the solid line.

In this work, we investigated separately the dependence of the mixing time on the size and velocity of micro-droplets traveling in a microfluidic serpentine channel. We have produced droplets of the same size but traveling at different average velocities and vice versa, to assess how the droplet size and its velocity influences the scaling of the mixing time independently. The mixing time for droplets of similar size scaled inversely with their average velocity. We observed that when the mixing time was plotted against the specific time scale suggested by Song et al.,23 a linear dependence was obtained from the slope governed by the droplet size. For similar serpentine geometries, a master-line, irrespective of flow conditions and geometric details, was obtained when the droplet size was embedded in the scaling argument appropriately. Thus, by knowing the constraints of the time required for certain processes or measurements involving micro-droplets, a particular mixing time can be accomplished with such an approach.

Acknowledgements

This research was supported by NanoNextNL, a Micro and Nanotechnology Consortium of the Government of the Netherlands and 130 partners and the European Research Council under the European Union’s Seventh Framework Programme (FP/2007-2013)/ERC Grant, agreement no. 337820 (to P. E. B.). We are grateful to Volkert van Steijn and Barbara Kampa for fruitful discussions. The authors thank the assistance of Durgesh Kawale in drawing a schematic illustration of the device.

References

  1. J. M. Ottino and S. Wiggins, Philos. Trans. R. Soc., A, 2004, 362, 923 CrossRef PubMed.
  2. D. R. Reyes, D. Iossifidis, P. Auroux and A. Manz, Anal. Chem., 2002, 74, 2623 CrossRef CAS PubMed.
  3. H. Song, D. Chen and R. Ismagilov, Angew. Chem., Int. Ed. Engl., 2006, 12, 3263 Search PubMed.
  4. L. Jiang, Y. Zeng, H. Zhou, J. Y. Qu and S. Yao, Biomicrofluidics, 2012, 6, 012810 CrossRef PubMed.
  5. C. Lee, C. Chang, Y. N. Wang and L. Fu, Int. J. Mol. Sci., 2011, 12, 3263 CrossRef CAS PubMed.
  6. L. Capretoo, W. Cheng, l. M. Hil and X. Zhang, Microfluidics, 2011, 304, 27 Search PubMed.
  7. V. Hessel, H. Lowe and F. SchÃűnfeld, Chem. Eng. Sci., 2005, 60, 2479 CrossRef CAS.
  8. Y. K. Suh and S. Kang, Micromachines, 2010, 1, 82 CrossRef.
  9. H. Song and R. F. Ismagilov, J. Am. Chem. Soc., 2003, 125, 14613 CrossRef CAS PubMed.
  10. H. Wang, P. Iovenitti, E. C. Harvey and S. Masood, Proc. SPIE, 2003, 4982, 282–289 CrossRef.
  11. H. Aref, J. Fluid Mech., 1984, 143, 1 CrossRef.
  12. R. O. Grigoriev, M. F. Schatz and V. Sharma, Lab Chip, 2006, 6, 1369–1372 RSC.
  13. M. R. Bringer, C. J. Gerdts, H. Song, J. D. Tice and R. F. Ismagilov, Philos. Trans. R. Soc., A, 2004, 362, 1087–1104 CrossRef CAS PubMed.
  14. R. O. Grigoriev, Phys. Fluids, 2005, 17, 033601 CrossRef.
  15. H. Song, J. D. Tice and R. F. Ismagilov, Angew. Chem., Int. Ed. Engl., 2003, 42, 768 CrossRef CAS PubMed.
  16. K. Bajer and H. Moffatt, J. Fluid Mech., 1990, 212, 337 CrossRef.
  17. H. A. Stone, A. Nadim and S. H. Strogatz, J. Fluid Mech., 1991, 232, 629 CrossRef CAS.
  18. D. Kroujiline and H. Stone, Phys. Nonlinear Phenom., 1999, 130, 105–132 CrossRef.
  19. M. Bryden and H. Brenner, J. Fluid Mech., 1999, 379, 319 CrossRef CAS.
  20. J. Sivasamy, Z. Z. Che, T. N. Wong, N. T. Nguyen and L. Yobas, Chem. Eng. Sci., 2010, 65, 5382 CrossRef CAS.
  21. Z. B. Stone and H. A. Stone, Phys. Fluids, 2005, 17, 063103 CrossRef.
  22. J. Wang, J. Wang, L. Feng and T. Lin, RSC Adv., 2015, 5, 104138–104144 RSC.
  23. H. Song, M. R. Bringer, J. D. Tice, C. J. Gerdts and R. F. Ismagilov, Appl. Phys. Lett., 2003, 83, 4664 CrossRef CAS PubMed.
  24. J. M. Ottino, The kinematics of mixing: stretching, chaos, and transport, Cambridge University Press, Cambridge, 1989 Search PubMed.
  25. A. D. Stroock, S. K. Dertinger, A. Ajdari, I. Mezic, H. A. Stone and G. M. Whitesides, Science, 2002, 295, 647 CrossRef CAS PubMed.
  26. J. M. Ottino, Chem. Eng. Sci., 1994, 49, 4005 CrossRef CAS.
  27. V. van Steijn, C. R. Kleijn and M. T. Kreutzer, Lab Chip, 2010, 10, 2513 RSC.
  28. P. V. Danckwerts, Appl. Sci. Res., Sect. A, 1952, 3, 279 Search PubMed.

Footnotes

Electronic supplementary information (ESI) available: Additional data, additional methods, data analysis and movies. See DOI: 10.1039/c6ra17728j
Present address: Nestlé Research Centre, Vers-chez-les-Blanc, 1000 Lausanne 26, Switzerland.

This journal is © The Royal Society of Chemistry 2016