
 Open Access Article
 This Open Access Article is licensed under a Creative Commons Attribution-Non Commercial 3.0 Unported Licence
Highly stable and biocompatible gold nanorod–DNA conjugates as NIR probes for ultrafast sequence-selective DNA melting†
Verena
Baumann
ac,
Peter Johan
Friedrich Röttgermann
bc,
Frederik
Haase‡
ac,
Katalin
Szendrei‡
ac,
Priyanka
Dey
ac,
Katja
Lyons
ac,
Regina
Wyrwich
e,
Matthias
Gräßel
acd,
Joachim
Stehr
d,
Lars
Ullerich
d,
Federico
Bürsgens
d and
Jessica
Rodríguez-Fernández
*ac
aPhotonics and Optoelectronics Group, Department of Physics and Center for NanoScience (CeNS), Ludwig-Maximilians-Universität München, Amalienstr. 54, 80799 Munich, Germany. E-mail: jessica.rodriguez@lmu.de
bSoft Condensed Matter Group, Department of Physics and Center for NanoScience (CeNS), Ludwig-Maximilians-Universität München, Geschwister-Scholl-Platz, 1, 80539 Munich, Germany
cNanosystems Initiative Munich (NIM), Schellingstr. 4, 80799 Munich, Germany
dGNA Biosolutions GmbH, Am Klopferspitz 19, 82152 Martinsried, Germany
eDepartment of Chemistry, Ludwig-Maximilians-Universität München, Butenandtstr. 5-13 (E), 81377 Munich, Germany
First published on 26th October 2016
Abstract
Here, we have prepared DNA-functionalized gold nanorods (Au NRs@HS-DNA) through a combination of stepwise ligand exchange, involving a sequential aqueous–organic–aqueous transfer, and subsequent oligonucleotide grafting. The as-prepared Au NRs@HS-DNA display a high and long-term colloidal stability in high ionic strength media, and they are proved very stable and biocompatible in cell culture media. We discuss important aspects in order to obtain a high DNA loading and to ensure colloidal stability during the functionalization process. We also demonstrate the high biocompatibility (>95% viability, low ROS activity, normal cell growth rate) of the DNA-functionalized Au NRs, which is mainly ascribed to the efficient removal of cetyltrimethylammonium bromide (CTAB) from their surface and to their high stability. These Au NR–DNA conjugates can be selectively addressed with a laser beam in a binary sample mixture comprising clusters of self-assembled DNA-functionalized spherical Au nanoparticles (NPs) and clusters of self-assembled DNA-functionalized Au NRs. We demonstrate that each colloidal cluster can be selectively disassembled by exciting the NPs close to their respective plasmon resonance maxima with microsecond laser pulses at 532 nm (for the spherical Au NPs) or 1064 nm (for the Au NRs). To the best of our knowledge this is the first report of an assay that allows optical induction of the selective DNA melting of different sequences within one solution, regardless of their respective melting temperatures. As a proof of concept, we demonstrate that the Au NR–DNA conjugates can be used as NIR-addressable probes and mediators for ultrafast and selective DNA melting and, in turn, for the selective detection of DNA.
Introduction
The fast-paced development of nanoparticle-based nanoscience and biotechnology1 has strongly benefitted from advances in the synthesis, understanding and control over the functional properties of several nanoparticle types.2–5 Metal and semiconductor nanoparticles have played a remarkable role herein, especially those with near-infrared (NIR) plasmon resonances.6–10 Gold nanorods stand out in this context and thanks to their plasmonic properties they have raised interest for metamaterials,11,12 sensing,13 light-triggered actuation/release,14–17 as photothermal agents,18–20 and for in vitro/in vivo imaging,21,22 among others. Of special interest is their deployment in the biomedical field, which requires rendering them biocompatible and colloidally stable in the high ionic strength conditions inherent to biological buffers and body fluids.23 This can be achieved by interfacing their surface with biocompatible polymers, such as polyethyleneglycol (PEG),24–26 or with biomolecules.23,27 Here, DNA is particularly advantageous due to its sequence-specific recognition capability that can be used to obtain nanoparticle assemblies of varying complexity and with optimized or new properties.28–35Spherical gold nanoparticles can be easily functionalized with DNA oligonucleotides by direct grafting of thiol-ending oligonucleotides36 or by direct adsorption of unmodified oligonucleotides37–39 due to the accessibility of their surface and the straightforward displacement of citrate ions. In contrast, functionalization of gold nanorods with DNA is more challenging due to the stabilizing CTAB bilayer on their surface, needed for their growth.40,41 If NR functionalization is intended for DNA-directed self-assembly with other nanoparticles42–44 or DNA nanostructures43,45–50 containing complementary strands, it is plausible to functionalize the CTAB-capped Au NRs through direct grafting of thiol-ending oligonucleotides on their surface. This typically requires the addition of negatively charged surfactants (e.g. sodium dodecyl sulfate, SDS),42,45 non-ionic surfactants (e.g. Tween), Tween/polyethyleneglycol mixtures,41 or negatively charged molecules with a hydrophobic aromatic region (e.g. 5-bromosalicylic acid)51 prior to the actual DNA grafting step so as to not disrupt NR stability during the process. These approaches have been proven successful and certain improvements, such as a significant reduction in DNA grafting time at low pH,42 have been reported. However, their main disadvantage is that the cationic surfactant can only be partially removed by the several washing cycles performed. Since CTAB monomers are primarily responsible for the toxic effect of gold nanorods,52 surfactant removal is essential if the Au NR–DNA conjugates are intended for biomedical applications. Wijaya et al. demonstrated that CTAB-free DNA-functionalized Au NRs can be prepared by using a round-trip phase transfer process.40 This approach consists of the extraction of CTAB-capped Au NRs from water into a dodecanethiol phase, followed by redispersion in a non-polar organic solvent (toluene) and subsequent back-transfer to water for oligonucleotide grafting. Here, the very strict experimental conditions needed for the direct exchange of CTAB molecules by the alkanethiol lead quite often to irreversible aggregation, as observed by our and other groups.3,53 This makes it difficult to reproducibly prepare surfactant-free Au NR–DNA conjugates.
In order to overcome this issue, here we show that biocompatible and highly stable DNA-functionalized Au NRs with a tailorable density of oligonucleotides can be routinely and reproducibly prepared through the combination of an aqueous–organic–aqueous transfer and subsequent oligonucleotide grafting. The introduction of an intermediate PEG layer prior to redispersion in an organic polar solvent (THF) is found to be critical to ensure NR stability during the CTAB-removal process, while still enabling an efficient grafting of thiol-ending oligonucleotides in the subsequent steps. We discuss important key aspects to obtain Au NR–DNA conjugates, and demonstrate their long-term stability in stringent buffer conditions and cell culture media, as well as their biocompatible character (>95%). We also show that the ssDNA on the Au NRs retains its hybridization capacity. This is demonstrated by selectively addressing with a NIR laser nanoparticle clusters comprising DNA-functionalized Au NRs. As a proof of concept we demonstrate that these NIR-addressable probes can be used for the ultrafast detection of single-stranded DNA.
Experimental
Chemicals
Hydrogen tetrachloroaurate trihydrate (HAuCl4·3H2O), sodium borohydride (NaBH4), silver nitrate (AgNO3) and cetyltrimethylammonium bromide (CTAB, >98%) were purchased from Sigma-Aldrich. Magnesium chloride (MgCl2, >99%) was procured from Roth, polyethylene glycol (PEG) α-methoxy-ω-mercapto (HS-PEG-OMe, MW 5000 Da), from Rapp Polymere and sodium oleate, from TCI America. Tetrahydrofuran (THF, >99.9%) was ordered from Merck. 6-Carboxyfluorescein (6-FAM) modified (5′-thiol-C6-TTTTTTTTTTTTTTTTTT-3′-6-FAM) and non-modified (5′-thiol-C6-TTTTTTTTTTTTTTTTTT-3′) thiolated DNA oligonucleotides (hereafter HS-DNA; 200 μM in water) were procured from Biomers.net. Tris–borate–EDTA buffer (1× TBE, pH 8.0) and tris–acetate–EDTA buffer (1× TAE, pH 8.0) were also used. All chemicals were used without further purification. In all preparations ultrapure Milli-Q water (H2O, 18.2 MΩ cm) was used.Synthesis of Au NRs
Short aspect ratio (AR = 3.96) Au NRs with a length × width = 64 × 12 nm and with a longitudinal plasmon resonance centered at 821 nm were synthesized by a seed-mediated growth method.54,55 To prepare the Au seed solution in a total volume of 5 mL, 300 μL NaBH4 were added at once to a stirring solution containing 9.94 μL HAuCl4 0.1257 M and 4.7 mL CTAB 0.1 M. After 2 min of vigorous stirring the solution was incubated in a water bath at 25 °C. In the meanwhile a growth solution consisting of 0.994 mL HAuCl4 0.1257 M, 250 mL CTAB 0.1 M and 4.65 mL HCl 1 M was prepared. This mixture was kept at 27 °C for 15 min. To induce Au nanorod formation the growth solution was first mixed with 300 μL AgNO3 0.1 M, then with 2 mL ascorbic acid 0.1 M and last with 600 μL of the Au seed solution. The mixture was incubated overnight at 30 °C. Chemicals from the synthesis were removed by centrifuging for 50 min at 7232 × g and redispersing with the same volume of CTAB 0.1 M. Sample washing was carried out twice. Finally the 250 mL sample was centrifuged additionally two times and redispersed with water in order to obtain gold nanorods with final concentrations of [Au] = 0.920 mM (2.56 × 10⁻⁹ moles of particles per L) and [CTAB] = 0.75 mM. Thereafter, the brown-colored dispersion was stored in a water bath at 27 °C for later use.High AR (6.65) Au NRs with a length × width = 93 × 14 nm, and with a longitudinal plasmon resonance centered at 1080 nm were synthesized by the seed-mediated growth approach described by Ye et al.56 using a binary surfactant mixture consisting of CTAB and sodium oleate. First, the Au seeds were prepared by mixing 5 mL of HAuCl4·3H2O solution (0.5 mM, in water) and 5 mL of an aqueous CTAB solution (0.2 M), followed by the addition of 1 mL of a freshly prepared NaBH4 solution (0.6 mL of 0.01 M of NaBH4 were diluted to 1 mL with water) under vigorous stirring. After two minutes the stirring was stopped and the seed solution was allowed to age for 30 minutes in a water bath at 27 °C. For the growth solution, 3.5 g CTAB and 617 mg sodium oleate were dissolved in 125 mL warm water (∼50 °C). When the solution was cooled down to 30 °C, AgNO3 (4 mM, 12 mL) was added and the solution was kept undisturbed for 15 minutes at 30 °C. Then, an aqueous HAuCl4·3H2O solution (1 mM, 125 mL) was added. The solution turned colorless after 90 minutes of moderate stirring. Subsequently, 3.111 mL of HCl (32 wt% in water) were added and the moderate stirring was continued for additional 15 min. Thereafter, 0.625 mL ascorbic acid 64 mM were added and the solution was stirred vigorously for 30 s. In the last step 0.4 mL of the seed solution were added to the growth solution. After stirring for additional 30 s, the reaction mixture was stored overnight in a water bath at 30 °C to allow for gold nanorod formation. The Au NRs were finally purified by centrifugation at 7000 rpm for 30 min (2×) and redispersed in 125 mL of a 5 mM CTAB solution.
DNA functionalization of Au NRs
Here we provide a thorough experimental description of the experimental steps and conditions to functionalize the short AR (3.96) Au NR sample. The process is identical for the high AR (6.65) sample previous adjustment of the relative concentrations of Au NRs and grafting molecules according to the molecular grafting densities indicated below.For DNA functionalization of Au NRs@MHA, the reduced HS-DNA was added to a dispersion of 1.786 mM (5 × 10⁻⁹ moles of particles per L) Au NRs in 1× TBE containing 0.001% Tween 80 so as to theoretically functionalize the particles with 1 DNA strand/Au nm2. After incubation for 15 min, charge screening was performed. In a typical experiment yielding 194 DNA strands/Au NR (0.05 DNA strands/Au nm2), charge screening was performed in four salting steps until a final [NaCl] = 0.08 M was achieved (value taken from Zhang et al.58) by using a 2 M NaCl stock solution in 1× TBE containing 0.001% Tween 80. After each salting step the sample was sonicated for 15 s and subsequently allowed to stand undisturbed for 30 min. Once the last salting step was finished it was kept undisturbed overnight (17 h) at room temperature. To remove free HS-DNA oligonucleotides, the sample was centrifuged (1207 × g, 40 min) and resuspended in 1× TAE, pH 8.0 containing 0.001% Tween 80. The same centrifugation/redispersion cycles were repeated two additional times.
Quantification of DNA oligonucleotides on the Au NR surface
The extinction spectra of the DNA functionalized Au NRs do not give information on the actual number of DNA strands bound to the Au NR surface. Hence, we used a DNA quantification method based on the work of Demers et al.,59 to determine the total number of DNA strands bound to the Au NR surface by fluorescence spectroscopy.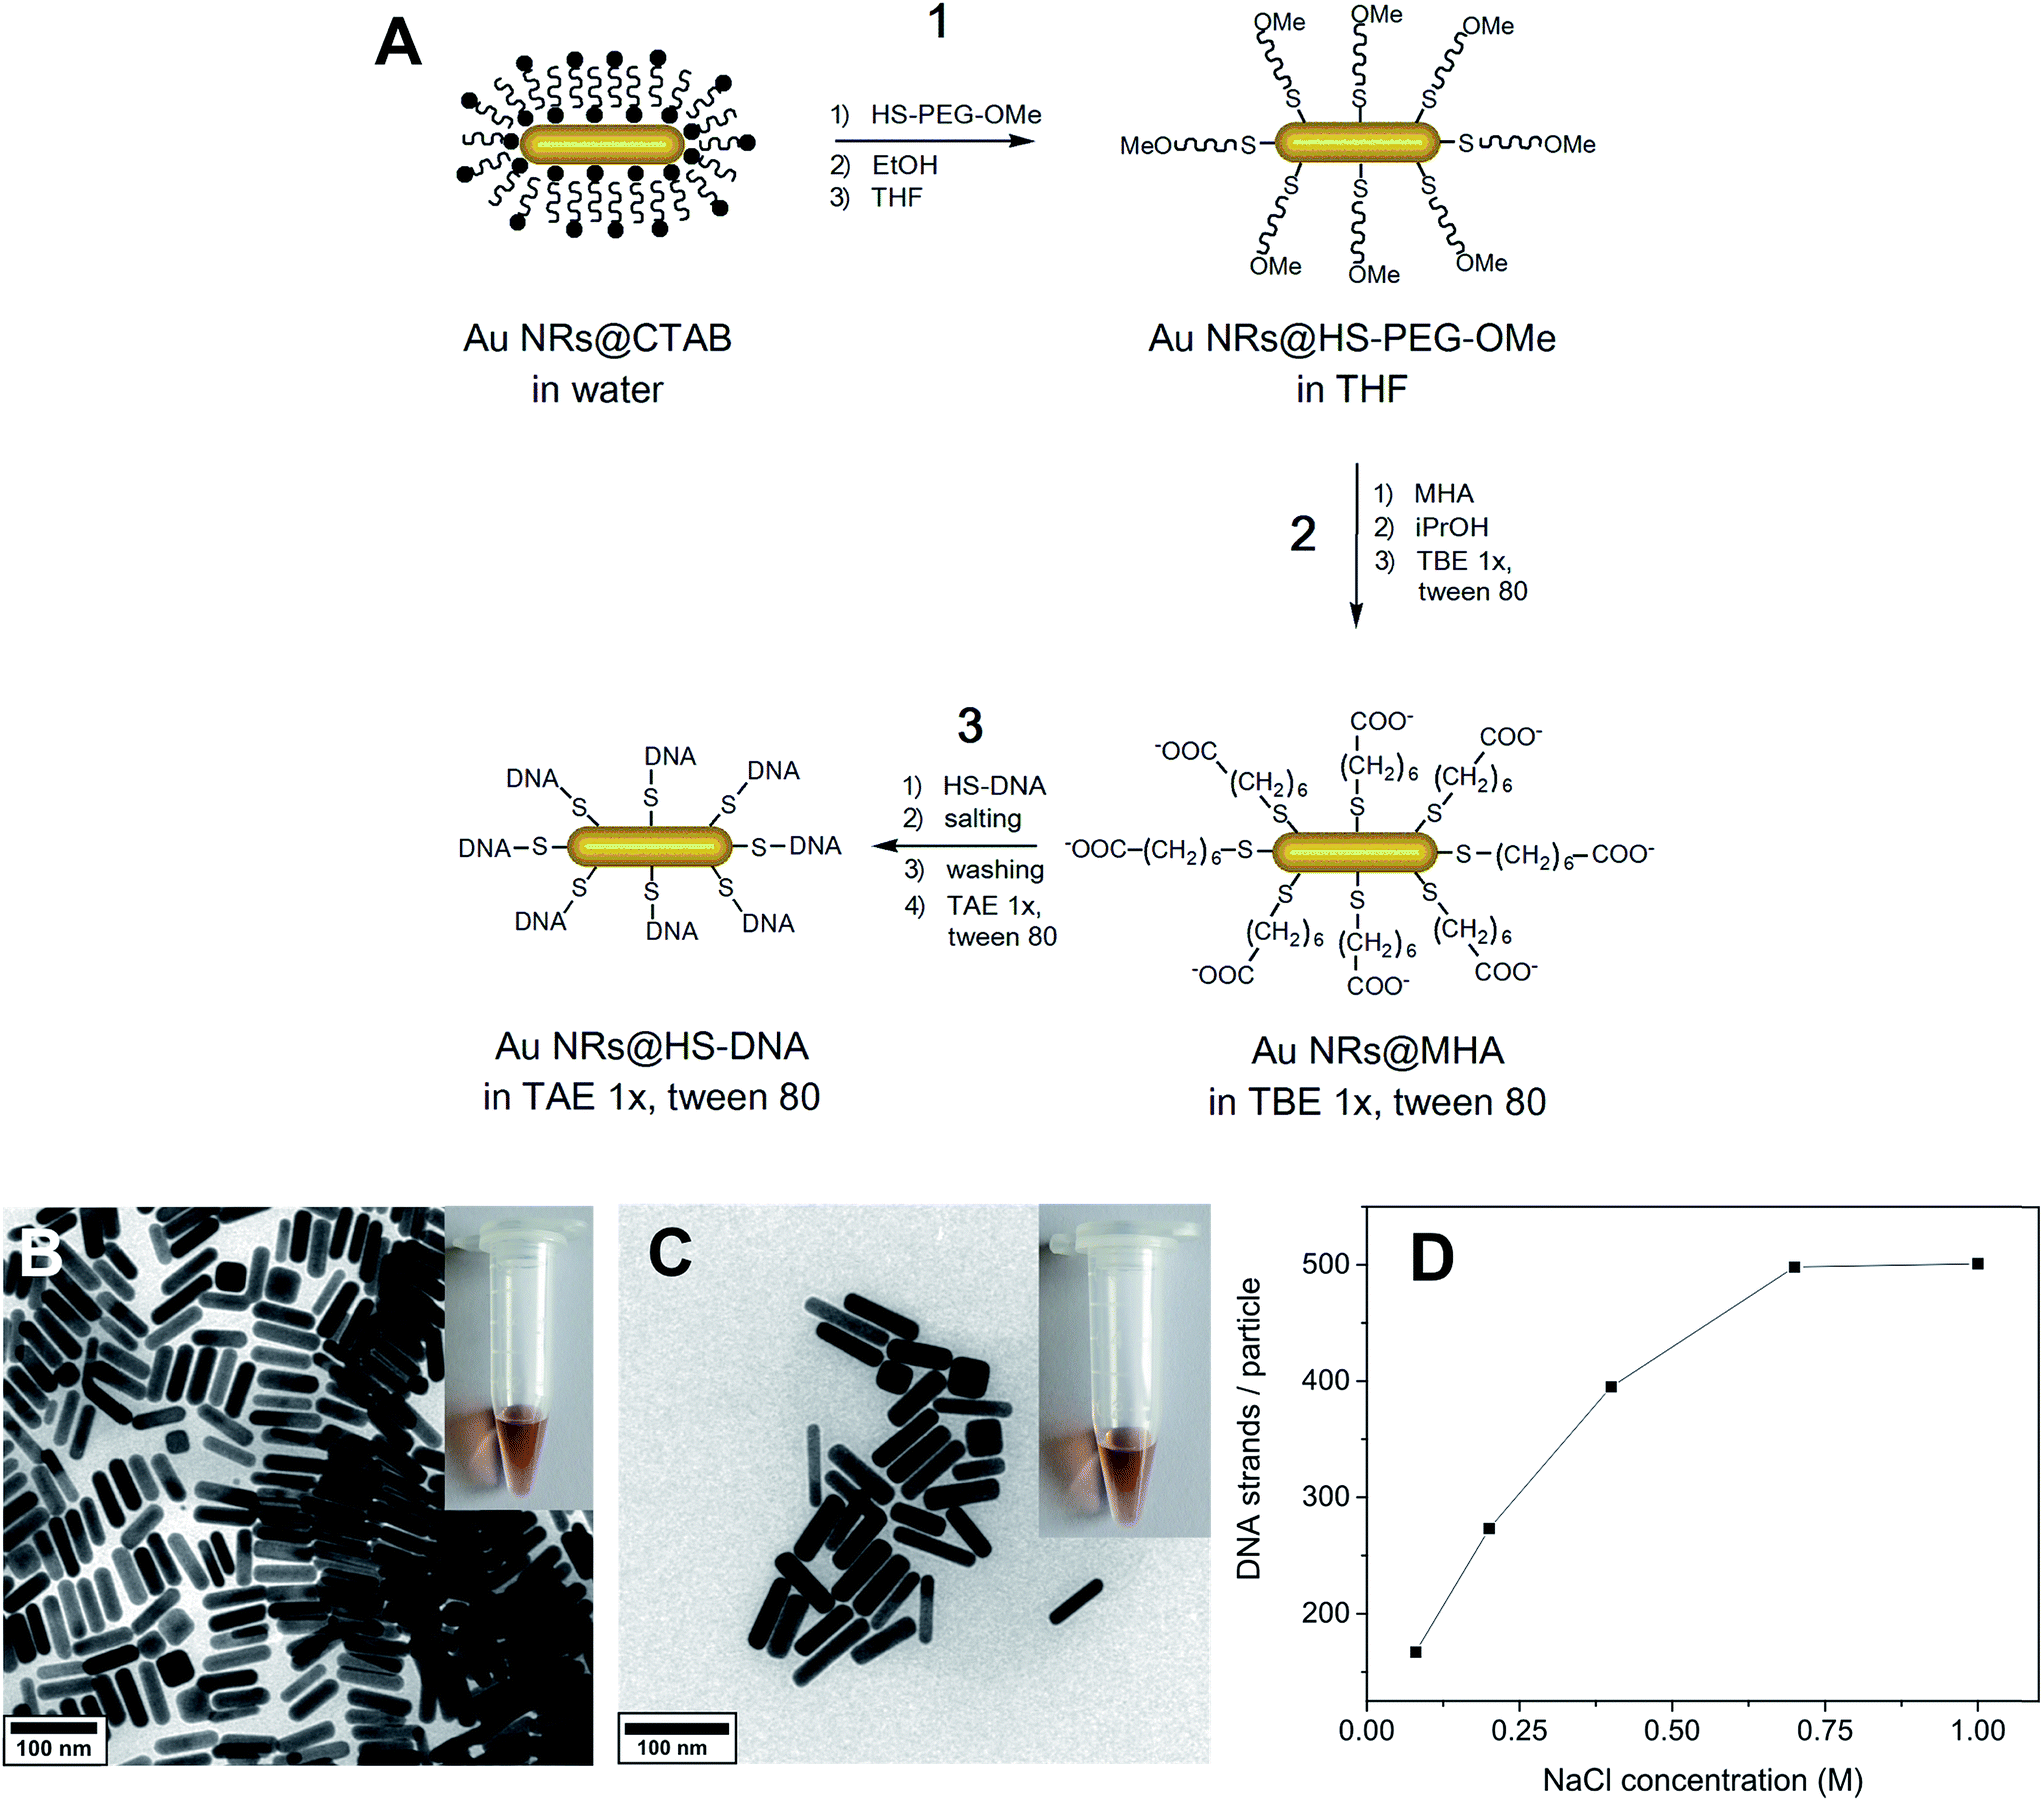 | ||
| Fig. 1 (A) Schematic representation of the stepwise surface functionalization of Au NRs with HS-DNA. Step 1: partial displacement of CTAB molecules by HS-PEG-OMe and transfer into organic medium, namely THF. Step 2: modification of the Au NR's surface with MHA, ionization of the terminal carboxylic acid group by isopropanol addition, and redispersion in buffer medium. Step 3: DNA functionalization via charge screening followed by 3× washing, and redispersion in buffer. (B) TEM micrograph of the CTAB-stabilized Au NRs (L × W = 64 × 16 nm). The inset shows the photograph of the corresponding dispersion. (C) TEM micrograph of the same Au NRs functionalized with HS-DNA (here 5′-thiol-C6-T18-3′) and redispersed in 1× TAE buffer containing 0.001% Tween 80. The inset shows the photograph of the corresponding dispersion. (D) Influence of the final [NaCl] used during charge screening on the number of DNA strands loaded per Au NR. DNA functionalization was performed at room temperature in the presence of 0.001% Tween 80. | ||
Assessment of the time stability and DNA desorption of DNA-functionalized Au NRs in high ionic strength media
We studied the stability of Au NRs@HS-DNA-6-FAM in 1× TAE containing 0.001% Tween 80 as a function of the medium ionic strength and time (for a total of 56 days). Specifically, we followed the spectral evolution (by means of vis-NIR spectroscopy) of Au NRs@HS-DNA-6-FAM in the presence of a final salt concentration of 5 mM MgCl2, 2 M NaCl, and no salt.In order to determine the occurrence of HS-DNA-6-FAM desorption from the Au NR surface, from the samples described above aliquots were taken after 0, 1, 2, 6, 14, 28, and 56 days, and oxidized as explained above. Ultimately, we determined the number of DNA strands grafted on the Au NRs by fluorescence spectroscopy.
Biocompatibility Tests
The biocompatibility of the DNA-functionalized Au NRs was investigated through four different tests: a viability assay on cell population and viability/membrane leakage assay, reactive oxygen species (ROS) activity assay, and a proliferation assay on single cell level.For the assay, adherent lung carcinoma A549 (from the Leibniz Institute DSMZ – German Collection of Microorganisms and Cell Cultures) cells were seeded in a flat-bottom 96 multi-well plate by adding in each well 200 μL of a 5 × 10⁴ live cells/mL solution (containing DMEM with 10% fetal calf serum, FCS), and incubating at 37 °C in a 5% CO2 atmosphere for 24 h. The wells in the periphery were filled with complete cell culture medium without cells, in order to prevent edge effects.
After a cell monolayer was formed in each well, 100 μL of the DNA functionalized Au NRs (sequence: 5′-thiol-C6-TTTTTTTTTTTTTTTTTT-3′-6-FAM) were added to the cells in five serial dilutions in triplicate (1, 10, 25, 50 and 100 μg mL−1). For background measurements, wells were filled with the same volume of medium but in the absence of cells. Other wells containing cells, but no Au NRs, were used as a positive control with staurosporine (2 μM, STS) from Sigma Aldrich. After incubation for 24 h, the medium was removed and 120 μL of the MTS reagent was added into each well. The cell plate was transferred into the incubator and left for 1 h at 37 °C in a humidified, 5% CO2 atmosphere. Thereafter, the absorbance of formazan at 490 nm was recorded using a microtiter plate reader (FLUOstar OPTIMA from BMG Labtech).
Analysis of the absorbance measurements was carried out by subtraction of the average background value from each single replicate. Normalization to the average absorbance of the cells without Au NRs was performed in order to obtain the percentage of cell survival as shown in eqn (1).
 | (1) |
A549 cells were seeded in an ibitreat 8 well slide (ibidi GmbH) at a concentration of 6000 cells per well. After 16 h, cells were exposed to the different Au NRs@HS-DNA doses, to a negative control (only cell culture medium) and to 1 μM STS. After 24 h, the cells were treated with 0.5 μM c12-resazurin and 10 nM SYTOX green in 200 μL PBS at 37 °C and 5% CO2 for 15 min, according to the manufacturer instructions. As a second additional control, ethanol (EtOH) was added to CCM to induce cell membrane permeabilization. Cells were imaged with an inverted TI Eclipse microscope (Nikon) and a fluorescence lamp SOLA LED (Lumencor) with 20× resolution. The fluorescence of c12-resorufin was recorded with a PI filter (Ex. 540 nm/Em. 630 nm), and the SYTOX green, with an eGFP filter (Ex. 470 nm/Em. 525 nm). Approximately 1000 cells were analyzed per exposure condition. The percentage of damaged cells was calculated by the ratio of total cell number to the number of nucleus-stained cells.
A549 cells were seeded in an ibitreat 8 well slide (ibidi GmbH) at a concentration of 6000 cells per well. After seeding for 16 h, the cells were exposed to the different doses of Au NRs@HS-DNA, to a negative control (CCM), and to a positive control (75 μM menadione, Alfa Aesar). After 24 h, 100 nM CellROX orange and 100 nM Hoechst 33342 (Thermo Fisher) in DMEM + 10% FCS was incubated at 37 °C and 5% CO2 atmosphere for 30 min.
The fluorescence of CellROX orange was recorded with a PI filter (Ex. 540 nm/Em. 630 nm), and the Hoechst 33342, with a DAPI filter (Ex. 377 nm/Em. 447 nm). For image analysis, regions of interest (ROI) for each single cell were extracted from the location of the stained nuclei. The ROIs were then applied to the CellROX fluorescence images and the mean fluorescence of each ROI was then calculated. Few hundred cells were analyzed per exposure condition.
Laser-assisted DNA melting experiments
A thorough description of the experimental setup devised for the ultrafast laser-assisted melting and detection of DNA upon disassembly of clusters of spherical or rod-like DNA-functionalized Au NPs is provided in the discussion associated with Fig. 5.Characterization
Optical absorption spectra were measured with a Cary 5000 UV-vis-NIR spectrophotometer in a 2 mm quartz cuvette. Photoluminescence measurements were performed with a Cary Eclipse Fluorescence Spectrometer in a 2 mm quartz fluorescence cuvette. For transmission electron microscopy characterization, we employed a JEOL JEM-1011 microscope operating at 100 kV. Zeta potential measurements were performed on a Zetasizer Nano S (Malvern Instruments, Malvern UK) with a 4 mW He–Ne laser operating at 633 nm and a detection angle of 173°. XPS measurements were carried out on an X-ray photoelectron spectrometer equipped with a VSW TA10 X-ray source and a VSW HA100 hemispherical analyser. To sputter clean the surface of the Au NRs@HS-DNA sample, a VSW AS10 argon ion gun was used. The samples for XPS analysis were prepared by drop-casting a dispersion of Au NRs@CTAB and a dispersion of Au NRs@HS-DNA bearing 700 DNA strands/NR (i.e., 0.126 DNA strands/Au nm2) on a silicon wafer.Results and discussion
CTAB-capped Au NRs (64 ± 12 nm length (L), 16 ± 3 nm width (W) and 3.96 ± 0.76 aspect ratio (L/W)) were functionalized through a combination of stepwise ligand exchange, involving a sequential aqueous–organic–aqueous transfer, and subsequent oligonucleotide grafting. Our approach was inspired by the method from Wijaya et al.40 with modifications for the aqueous–organic–aqueous transfer and subsequent steps, as we describe further below (see overview in Fig. 1A). It comprises a ligand exchange process involving three main steps. In the first one (aqueous-to-organic transfer), CTAB-stabilized Au NRs are transferred from water to THF via a gradual decrease in solvent polarity as described by Thierry et al.53 The transfer is enabled by PEGylation with HS-PEG-OMe (step 1.1), subsequent redispersion in ethanol (step 1.2), and ultimately redispersion in THF (step 1.3). This process is known to allow a complete removal of the cytotoxic surfactant CTAB,53 which is demonstrated further below. In the second step (organic-to-aqueous transfer), the Au NRs@HS-PEG-OMe in THF are functionalized with mercaptohexanoic acid (MHA, step 2.1). The ionization of the terminal carboxylic acid group of MHA is promoted by addition of a protic solvent (isopropanol in our case, step 2.2), as reported elsewhere.57 This allows the redispersion of Au NRs@MHA in buffer medium, namely 1× TBE buffer containing 0.001% Tween 80 (step 2.3, see discussion below for details on the role and importance of Tween). Finally, in step 3 the Au NRs@MHA are functionalized with thiolated oligonucleotides (HS-DNA) upon incubation for 15 min first (step 3.1). This is followed by overnight charge screening with NaCl (step 3.2), removal of the NaCl excess and of unbound HS-DNA oligonucleotides (step 3.3), and final redispersion in 1× TAE containing 0.001% Tween 80 (step 3.4, see details below).The functionalization described here involves several steps. This makes it more time consuming than other DNA functionalization approaches reported recently,41,42 which are well-suited for hybridization experiments. However, one important advantage of our approach relates to its robustness in terms of high reproducibility and tailored DNA grafting. Furthermore, the Au NR–DNA conjugates obtained in this way offer several advantages with respect to other conjugates reported previously, especially with regard to their potential deployment in the biomedical field: they do not contain CTAB, they are very stable under stringent buffer and cell culture media conditions and, importantly, they are highly biocompatible. All these aspects will be discussed in detail throughout the manuscript.
Fig. 1B depicts a TEM micrograph of the short aspect ratio CTAB-capped Au NRs, synthesized by a seed-mediated growth method described elsewhere.17,54,55Fig. 1C shows a micrograph of the same Au NRs after functionalization with single-stranded HS-DNA, consisting in this case of a 5′-thiol-C6-T18-3′ sequence (the sequence used as default throughout this work, unless otherwise indicated). Comparison of the TEM micrographs and photos of each colloidal dispersion (see insets) indicates that the NRs preserve their original morphology and dimensions, and that no aggregation occurs during the functionalization, as confirmed by the vis-NIR spectra shown in Fig. S2 (ESI†). By adjusting the concentration of [NaCl] (step 3.2), it is possible to fine-tune the number of DNA strands loaded on the Au NRs (see Fig. 1D and discussion below).
In the following, we highlight and discuss key experimental aspects to consider for the successful functionalization and stability of the Au NRs (Fig. 1A).
Step 1: aqueous-to-organic transfer via PEGylation
The first step consists of a partial PEGylation of the Au NRs@CTAB (step 1.1, Fig. 1A). PEGylation was performed to enable a gradual aqueous-to-organic phase transfer first (step 1) and subsequent back transfer to aqueous medium (step 2, see below). In this way, a complete CTAB removal from the Au NRs' surface is possible, as previously demonstrated by Thierry et al. via XPS analysis.53 We have demonstrated the efficient removal of the surfactant in the final Au NRs@HS-DNA sample by XPS (see discussion further below). HS-PEG-OMe binds to the Au surface through the thiol groups and acts as a steric barrier stabilizing the Au NRs during the gradual transfer from water to ethanol first (step 1.2, Fig. 1A), and ultimately to THF (step 1.3, Fig. 1A). We performed the PEGylation in order to obtain a partial coverage of the Au NR surface without surface saturation, so that further functionalization with MHA (step 2) and HS-DNA (step 3) is more likely. Thus, as a compromise between partial surface coverage and colloidal stability in a low dielectric constant solvent such as THF, we found that a dose of 20 molecules of HS-PEG-OMe per nm2 of Au is optimal. The colloidal stability provided by lower doses was found to be low, while higher ones tend to ‘block’ the Au NRs' surface, thus leading to lower HS-DNA loadings in step 3 (see Fig. S3 and Table S1, ESI†).Step 2: organic-to-aqueous transfer via MHA functionalization
To transfer the PEGylated Au NRs from THF into an aqueous, high ionic strength, medium (needed for HS-DNA functionalization, step 3), the Au NRs@HS-PEG-MeO in THF were incubated with MHA, soluble in THF as well. MHA is a short chain thiolated carboxylic acid that binds to the gold surface through the thiol group. Upon grafting, the MHA-modified Au NRs (Au NRs@MHA) gradually flocculate (see vis-NIR spectrum, red curve, in Fig. S4A†). Subsequent addition of a protic solvent such as isopropanol to the flocculated NRs facilitates their redispersion in a high ionic strength medium,40 1× TBE in our case. The longitudinal plasmon band of the Au NRs@MHA in 1× TBE (blue curve, Fig. S4A†) shows a significant inhomogeneous broadening, indicating that a non-negligible amount of Au NRs aggregate upon redispersion in buffer. We found that by increasing the number of MHA molecules added to the Au NRs@HS-PEG-MeO in THF, the Au NRs@MHA could be redispersed in 1× TBE with no significant aggregation occurring, as determined from vis-NIR spectroscopy. However, if the number of MHA molecules added was too high (>300 molecules/Au nm2), they blocked the Au surface for further functionalization with HS-DNA (step 3) in such a way that almost no HS-DNA could graft on the surface (results not shown). Consequently, it is important to carry out the MHA modification step as a compromise, (i) yielding an MHA-modified surface, whose polar properties suffice for Au NR redispersion in buffer without significant aggregation, but (ii) without inhibiting subsequent DNA grafting due to the presence of a too densely packed MHA monolayer on the Au NRs. Our experimental results revealed that functionalization with a dose of 300 molecules MHA/Au nm2 yielded the best results fulfilling both requirements. Under those experimental conditions we also found that the inhomogeneous broadening of the longitudinal plasmon band of Au NRs@MHA in 1× TBE (see Fig. S4A,† blue curve) can be significantly decreased when the nonionic surfactant Tween 80 is present during redispersion in the buffer medium (Fig. S4A,† green and orange curves). This stabilizing effect of nonionic surfactants, prior to modification with DNA oligonucleotides, was also reported previously for 13 and 40 nm citrate-capped spherical Au nanoparticles.64 Since the Au NR surface is not fully blocked by MHA ligands the surfactant can physisorb and, therefore, stabilize the Au NRs against aggregation resulting in much narrower longitudinal plasmon bands, even when present in a concentration as low as 0.001%.Step 3: DNA functionalization
For DNA functionalization (step 3, Fig. 1A), Au NRs@MHA in 1× TBE containing 0.001% Tween 80 were mixed with HS-DNA oligonucleotides (5′-thiol-C6-T18-3′ in the example shown here) in order to render their surface with a theoretical number of 1 HS-DNA strand/Au nm2 (see Table S2,† which summarizes the effect of the HS-DNA/Au NR molar ratio on the final DNA loading capacity). The particles were first incubated with the oligonucleotides for 15 min (red curve, Fig. S4B†), and then charge screening was performed to overcome the electrostatic repulsion between the negatively charged MHA carboxylic groups and the negatively charged DNA backbone. In a typical DNA functionalization experiment, we incubated the thiolated DNA and the Au NRs@MHA for 17 h in the presence of 0.08 M NaCl (concentration reached in four salting steps). These conditions are similar to the ones reported by Hurst et al. for DNA functionalization of citrate-capped spherical Au nanoparticles.36 Nevertheless, we found that performing a 15 s sonication after each salting step is important to enhance DNA grafting (see Table S3†). We observed no sign of loss in colloidal stability during the salting process (see Fig. S4B and S5†). Following removal of the NaCl excess and of the unbound HS-DNA strands, the Au NRs@HS-DNA were finally redispersed in 1× TAE containing 0.001% Tween 80. It is worth noting that 3 centrifugation/redispersion cycles are needed in order to ensure the efficient removal of unbound oligonucleotides (see Table S4† and further details in the Materials and methods section). Effective DNA grafting was confirmed by zeta potential (ξ) measurements in water. The positive ξ = +48.8 mV of the original CTAB-capped Au NRs changed to ξ = −7.1 mV for the Au NRs@HS-PEG-MeO, to ξ = −10.1 mV for the Au NRs@MHA, and to highly negative (ξ = −29.9 mV) for the Au NRs@HS-DNA.In order to fine-tune the amount of DNA strands loaded on the Au NRs' surface, we evaluated the influence of temperature and [NaCl]. Performing DNA grafting at 50 °C vs. room temperature (23 °C) leads to a higher DNA loading (see Table S5, ESI†). However, it also results in a partial reshaping of the Au NRs as indicated by a small blue-shift of their longitudinal plasmon band (see extinction spectra in Fig. S6†), in agreement with previous works.65,66 Alternatively, performing charge screening at high NaCl concentrations provides a much better control over DNA loading without affecting the morphology and stability of the NRs, as shown in Fig. 1D. DNA loading increases ∼three-fold, from 167 DNA strands/Au NR (0.04 DNA strands/Au nm2) to 501 DNA strands/Au NR (0.14 DNA strands/Au nm2) by increasing the [NaCl] from 0.08 M to 1.0 M. Between 0.08 M and 0.7 M NaCl, we observe a gradual increase in the number of loaded DNA strands per Au NR due to an effective charge screening of the repulsive forces between the negatively charged DNA backbones. However, above 0.7 M NaCl the charges are fully screened. Therefore, an additional increase in [NaCl] does not induce any further DNA loading on the Au NRs, thus achieving a plateau of maximum DNA loading, ∼501 DNA strands/Au NR in this case. A similar saturation effect above 0.7 M NaCl was reported by Hurst et al.36 for 15 nm spherical Au NPs. The gel electrophoresis results shown in Fig. S7† show that, regardless of their loading, all DNA-functionalized Au NRs run towards the positive electrode. However, the narrower and better defined bands obtained for the Au NRs with higher DNA loadings, indicate that more homogeneous coatings are obtained when higher NaCl concentrations are used during the salting step. We also found that the utilization of an aged Au NRs@MHA sample can have a positive impact in terms of DNA loading (see Fig. S8 and Table S6†).
One of the most remarkable features of our Au NRs@HS-DNA relates to their high and long-term colloidal stability in high ionic strength media. Fig. 2 illustrates this by showing the spectral changes occurring on Au NR–DNA conjugates loaded with 194 DNA strands/Au NR (i.e., with 0.05 DNA strands/Au nm2) after storage for 56 days in the absence (Fig. 2A) or in the presence of high concentrations of a divalent (5 mM MgCl2, Fig. 2B) or of a monovalent (2 M NaCl, Fig. 2C) salt. In all cases, the longitudinal plasmon band of the DNA-modified Au NRs remains practically unchanged, indicating that all samples remain highly stable over time despite the high ionic strength of the salt-containing media. In the absence of extra salt added, no significant spectral changes occur, just a small improvement in terms of a slight narrowing, symmetry and intensity increase of the longitudinal plasmon band with increasing storage time. This is probably due to a significant DNA desorption over time for this sample (see Fig. S9, ESI†). Upon DNA desorption it is likely that Tween physisorbs further on the surface of the DNA-functionalized AuNRs, thus increasing slightly the overall stability of the sample. On the other hand, when the nanorods are incubated in a buffer medium containing 5 mM MgCl2, a small inhomogeneous broadening at ca. 1000 nm starts to become evident after 56 days (see Fig. 2B). This is ascribed to a non-negligible DNA desorption, which is far less pronounced in this sample as compared to the sample with no extra salt added (see Fig. S9†). However, in this case Tween physisorption seems to not suffice in providing a similar stabilization effect (see Fig. S10†). The van der Waals attraction between the nanorods is favored by the high ionic strength of the medium and, hence, it is likely that the stabilizing effect of Tween cannot compensate for this effect, thus resulting in a slight broadening of the longitudinal plasmon band. The spectra shown in Fig. 2C illustrate the high stability of our Au NRs@HS-DNA-6-FAM in 2 M NaCl after 56 days incubation, despite the higher ionic strength (I,  with ci being the concentration of the ion i and zi, its charge) of this solution (I = 2 M) vs. I = 0.015 M for the 5 mM MgCl2 solution. While all these results are quite promising, the deployment of AuNRs@HS-DNA in the biomedical field requires redispersing them in complex biological media. In the presence of serum proteins, particles become coated by a protein corona and can form aggregates of up to micrometer size.67–69 Therefore, we tested the stability of our Au NRs-DNA conjugates upon redispersion in DMEM cell culture medium containing 10% FCS. The spectrum is shown in Fig. 2D and further confirms the colloidal robustness of our DNA-modified Au NRs.
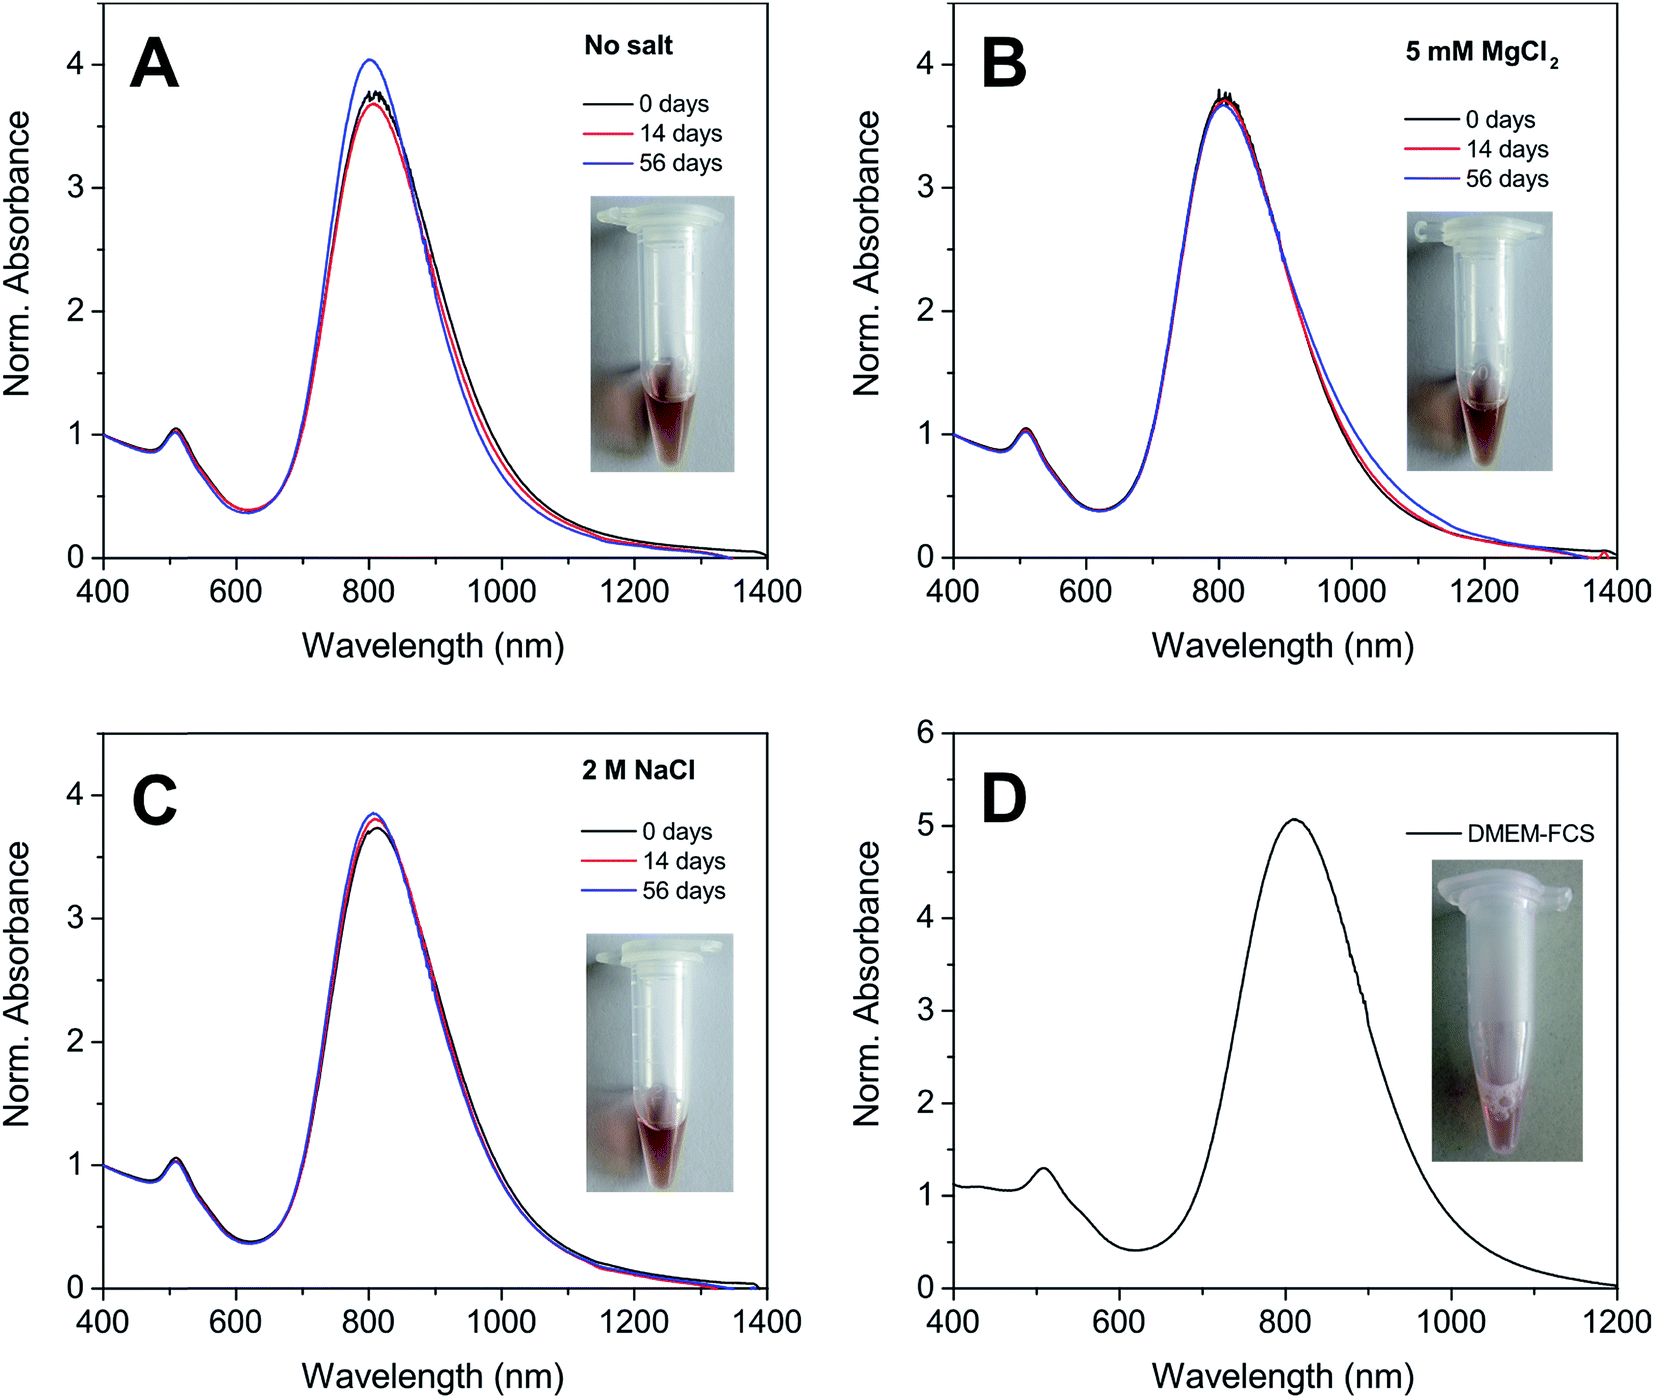 | ||
| Fig. 2 Vis-NIR spectra of Au NRs@HS-DNA-6-FAM (grafting density: 194 DNA strands/Au NR, i.e., 0.05 DNA strands/Au nm2) in 1× TAE containing 0.001% Tween 80. Note that 6-FAM tagged HS-DNA oligonucleotides were used in order to enable DNA quantification. In (A) no extra salt was added (reference sample), while in (B) and (C) 5 mM MgCl2 and 2 M NaCl were added, respectively. Panels A–C show the spectra measured directly after DNA functionalization (0 days, black curves), after 14 days (red curves), and after 56 days (blue curves). The insets show photographs of the corresponding samples after 56 days incubation. (D) Vis-NIR spectrum of a different Au NRs@HS-DNA-6-FAM sample (Au NR length × width = 72 × 19 nm; grafting density: 221 DNA strands/Au NR, i.e., 0.046 DNA strands/Au nm2) after redispersion in DMEM containing 10% FCS. A photograph of this sample is shown in the inset. All spectra were normalized at 400 nm. | ||
As mentioned earlier, the main advantage of performing an aqueous–organic–aqueous transfer of the Au NRs prior to oligonucleotide grafting lies in the efficient removal of the cationic CTAB surfactant.53 Free CTAB molecules are known to induce cytotoxicity.70,71 We verified that CTAB is effectively not present in our Au NRs@HS-DNA. This was confirmed by the absence of the characteristic Br 3d peak in the XPS spectrum of Au NRs@HS-DNA (see XPS spectra in Fig. S11, S12 and Table S7†). Given this positive result, we decided to test the cytotoxicity of the DNA-functionalized Au NRs on adherent lung carcinoma A549 cells in a concentration series after 24 h. Viability for the cell population was assessed by the MTS assay, whose results are shown in Fig. 3A. Increasing concentrations of the Au NRs@HS-DNA (expressed as Au atom concentrations) from 1 μg mL−1 (5 × 10⁻³ mM) up to 100 μg mL−1 (0.5 mM) had no effect on cell viability, which remained >95% in the whole concentration range examined. Note that, since the MTS assay measures absorption, Au NRs incorporated in the cells, as well as Au NRs adsorbed on the surface of the well plate, lower the absorbance intensity. Therefore, the viability is in fact even closer to 100%.
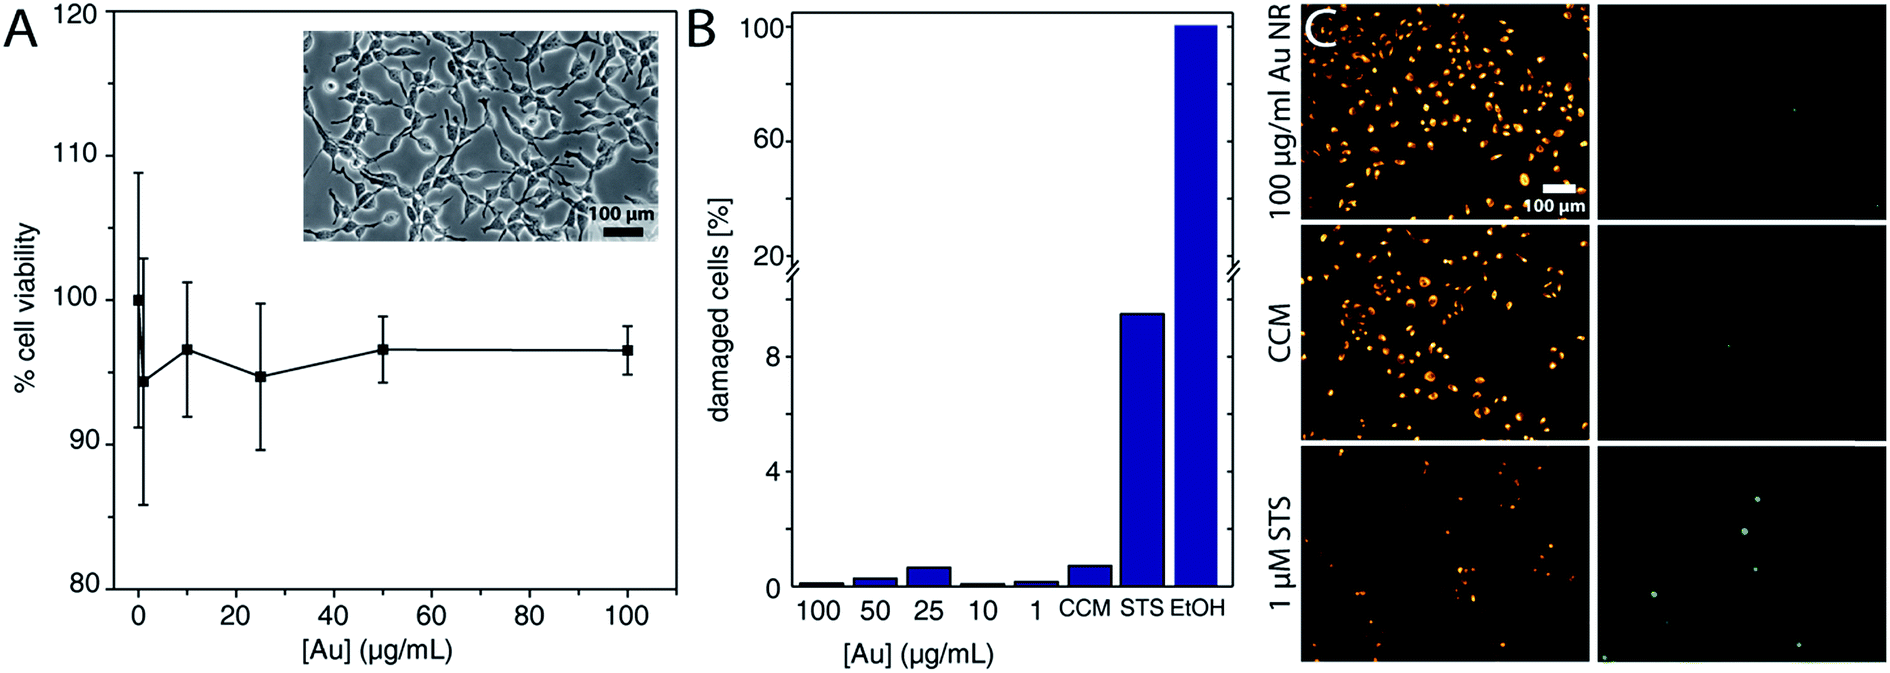 | ||
| Fig. 3 Cell viability. (A) Graph depicting the viability of lung carcinoma A549 cell population in DMEM with 10% FCS upon incubation for 24 h with the indicated doses of DNA-functionalized Au NRs (Au NRs' length × width = 64 × 12 nm, DNA grafting density = 0.063 strands/Au nm2). Note that the concentration is expressed as atomic Au concentration. The HS-DNA sequence used herein was 5′-thiol-C6-T18-3′-6-FAM. The inset contains a representative phase contrast microscopy image of viable cells after incubation for 24 hours. (B) Bar graph depicting the viability and the membrane integrity of single cells using c12-resazurin and SYTOX green. (C) Exemplary microscopy fluorescence images for the highest Au NRs@HS-DNA dose employed (100 μg mL−1), for the negative (CCM), and for the positive (1 μM STS) control. Healthy cells display an orange fluorescence, but no green fluorescence from the nucleus. Cells with a stained (green) nucleus indicate membrane leakage. The Au NRs@HS-DNA used for the experiments in panels (B) and (D) had a length × width = 72 × 19 nm and a DNA grafting density = 0.046 DNA strands/Au nm2. | ||
Beside the cell population-based viability assays, we assessed the viability, as well as the membrane leakage, at the single cell level using c12-resazurin and an impermanent nucleic acid dye. Healthy cells should show only a fluorescence signal from the metabolized c12-resazurin, but no signal from the nucleus. Cells with a compromised membrane should show additional fluorescence of the nucleus, and dead cells only the fluorescence from the nucleus. In Fig. 3B the percentage of damaged cells is displayed in a bar graph. The number of cells with a compromised membrane or dead lies below 1% for all Au NRs@HS-DNA doses tested. In contrast, for the positive control with 1 μM STS, this percentage is ca. 10%, while for EtOH it is 100%. Fig. 3C depicts some exemplary fluorescence microscopy images for the highest Au NRs@HS-DNA dose and for the controls, with the fluorescence of the c12-resorufin in the left column and the nucleus staining, in the right column. The cells exposed to Au NRs@HS-DNA show the same fluorescence behavior as the CCM control.
The viability tests only give a rough indication about the toxicity of a given nanomaterial. Therefore, more sensitive measurements are necessary. Measuring the ROS activity, for example, can provide direct information about the stress level of a cell. Thus, we checked the ROS activity for all Au NRs@HS-DNA doses after 24 h exposure. Fig. 4A shows three exemplary fluorescence images of the ROS activity for the highest Au NRs@HS-DNA dose tested, for a negative, and for a positive control. Whereas hardly any fluorescence signal is detected for the Au NRs@HS-DNA and the negative control, the cells treated with menadione have an increased ROS level. The normalized frequency distribution of the single cells as a function of their measured ROS level, is displayed in Fig. 4B for the different exposure conditions. Compared to the negative control (CCM), the distribution for all Au NRs@HS-DNA doses are very similar, remaining at low ROS levels. In contrast, the ROS activity for the menadione treatment is noticeably higher.
 | ||
| Fig. 4 ROS level and cell growth. (A) Exemplary fluorescence images of the red fluorescent CellROX marker and bright field images (as inset) for the highest Au NRs@HS-DNA dose (top), for the negative (CCM, center), and positive control (75 μM menadione, bottom). The fluorescence of the marker correlates directly to the ROS level. (B) Frequency distribution of single cells for the ROS level. No ROS activity was detected for any of the Au NRs@HS-DNA doses tested. In contrast, the positive control menadione induced ROS activity. (C) Growth rate of A549 cells over 60 h in the presence of the as-indicated Au NRs@HS-DNA doses. The cell growth in percentage for the negative control (dotted curve) and for the different doses tested (solid curves) shows the same proliferation rate. | ||
In summary, all these results for viability, ROS activity, and cell proliferation indicate that functionalizing Au NRs with single-stranded DNA as described above yields highly biocompatible Au NR–DNA conjugates. The negligible cytotoxicity is mainly ascribed to the efficient removal of CTAB, but also to their high colloidal stability, since colloidal aggregates are also known to promote cytotoxic effects.52
So far we have shown that highly stable and biocompatible DNA-functionalized Au NRs can be obtained. Up to now the focus was set on Au NRs with an aspect ratio ∼ 4 and functionalized with a thiolated multi-T DNA sequence. Nevertheless, functionalization of higher aspect ratio Au NRs with other DNA sequences works equally well with the described approach. This is particularly advantageous for applications where the plasmonic potential of the NIR-tunable longitudinal plasmon band of the Au NRs is to be exploited, as will be shown below. In order to test the DNA hybridization potential of the Au NR–DNA conjugates and to assess the possibility of driving their selective DNA melting with a NIR laser, we shift our focus in the following to higher aspect ratio gold nanorods displaying a significant plasmon absorption at 1064 nm. For this we functionalized two aliquots of an Au NR batch with dimensions L × W = 93 × 14 nm (A.R. = 6.65) with two different single-stranded DNA sequences, namely with a 5′-thiol-C6-A20GGTTCAGGCACAGCACATCAA-3′-6-FAM sequence, and with a 5′-thiol-C6-A10CTGTGCC-3′-6-FAM. Note that both sequences are complementary through the sequences marked in bold and with the multi-A sequence serving as a spacer. The extinction spectra of both samples are shown in Fig. S13 and S14.† Self-assembled clusters of Au NRs@HS-DNA show a melting temperature of 48.1 °C for the specific buffer conditions used in the subsequent experiments (see Fig. S15†).
Au NPs are very efficient in converting light into heat if they are excited with high intensity light of a frequency near their plasmon resonance frequency.72–74 In addition, the heat of the Au NPs quickly dissipates into the surrounding medium, but under suitable excitation conditions a small volume around the NPs can be locally heated to a temperature sufficient to denature DNA, while the bulk solution remains essentially at the initial temperature.75 This frequency-dependent local heating effect can be used to melt clusters of DNA-functionalized Au NPs that are interconnected through complementary DNA strands, and to selectively address Au NPs with different plasmon resonance frequencies in the same sample solution by using laser light whose frequency matches that of the different plasmon resonances. For the laser-assisted DNA melting experiments we used the setup schematically sketched in Fig. 5A, which is a modification of the one reported by Stehr et al.76,77 in order to accommodate a NIR Nd:YAG cw-laser (1064 nm wavelength, CNI Lasers, Model: OEM-H-1064nm-3W) in addition to a frequency-doubled Nd:YAG cw-laser (532 nm wavelength, CNI Lasers, Model:OEM-F-532nm-2W). The light paths of the two laser beams were combined through a dichroic mirror. Both beams were expanded by a factor of approximately 3 and focused by a 100 mm lens into a sample. The sample (20 μL) was loaded into polystyrene microtiter strips cut out from common 384 well plates (Greiner Bio One Int.) and whose transparent bottom ensures laser light transmission. The laser beam could be moved in two dimensions in the focus plane across the sample via a galvanometer mounted on a translation stage. A transimpedance amplified photodetector (detector I) registered the laser light passing through the sample. An identical second detector (detector II) recorded the fluctuations of the laser light intensity by measuring the reflections of the laser light from a glass plate before the beam passed through the sample.
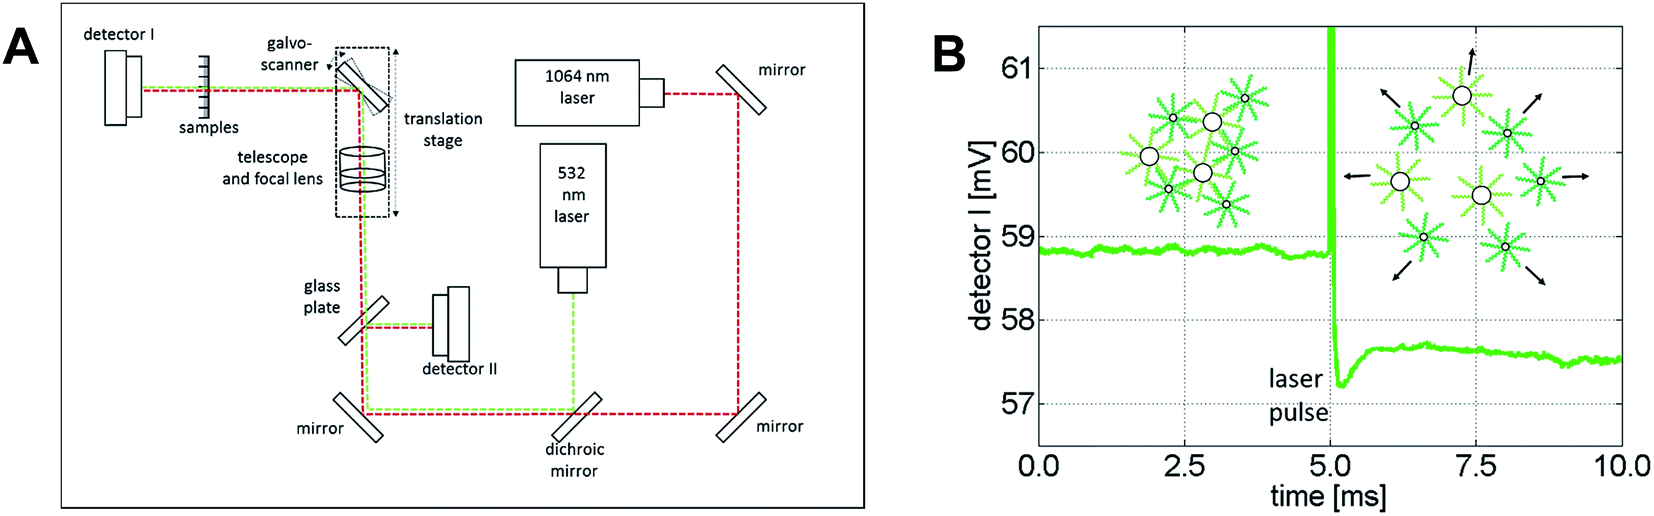 | ||
| Fig. 5 (A) Sketch of the experimental setup used for the selective laser-assisted disassembly of clusters consisting of Au NPs self-assembled with complementary DNA strands. (B) Temporal evolution of the laser light transmission at 532 nm passing through a sample containing clusters of 60 nm and 10 nm spherical Au NPs. The green curve shows the voltage output of detector I (average over 1000 transients), which is proportional to the intensity of the light passing through the sample. Upon illumination of the sample with the high intensity laser pulse (100 μs pulse after 5 ms), the NPs convert the energy of the laser light into heat and the dsDNA interconnecting the NPs inside the clusters can dehybridize. NP disassembly leads to an increased extinction at 532 nm, which is detected as a decrease in the transmitted light (for times > 5.1 ms). | ||
The DNA melting experiments comprise three consecutive phases. The first one involves measuring the transmission of a sample by setting one of the lasers to emit a moderate amount of power (<50 mW). At this power level, the transmission can be measured without causing significant warming of the nanoparticles. In the second phase, the actual laser heating step, the same laser is operated at maximum power for 100 μs. At a maximum power of 2.3 W, the green laser reaches a power density of 4.5 kW mm−2 in the focal spot in the sample, while the NIR laser reaches a power density of 6.2 kW mm−2 at 2.0 W maximum power. If the sample contains clusters of DNA-self-assembled Au NPs with a plasmon frequency matching the wavelength of either laser, such irradiation leads to sufficient light-to-heat conversion to melt the interconnecting DNA strands and, hence, to disassemble the clusters. In the third phase, the transmission is measured once again with the same laser set again to moderate power (<50 mW). If in the previous heating step, DNA melting results in cluster disassembly, it leads to a change in the extinction of the sample that can be observed as a transmission change on detector I. Fig. 5B illustrates the transmission change for a sample containing clusters of spherical Au NPs (10 nm and 60 nm diameter) measured and heated at 532 nm. The detectable change in the extinction is typically on the order of 0.1–2%. This moderate change can be explained by the focal geometry of our laser focus, which is characterized by a Rayleigh length of approximately 600 μm. This length can be assumed to be roughly equivalent to the optical path length that effectively experiences sufficient intensity to melt the DNA, and thus to cause a disintegration of the clusters and a change in extinction. Furthermore, the focal volume can be estimated to be on the order of 1 nL and, therefore, each raw measurement results in DNA melting of only a minute fraction of the sample (ca. 1 nL/20 μL = 0.005%). Because of this, it is not possible to experimentally measure in situ the spectral shifts occurring as a result of laser-induced melting of the irradiated clusters.¶ Nevertheless, a comparison of the observed change in transmission upon melting at the two respective laser wavelengths with that of an analog melting experiment of the bulk solution (see Fig. S15, ESI†) is qualitatively consistent.
As each measurement from the tiny volume excited by the laser leads to a small signal change (0.1–1%), all our DNA melting experiments comprised the recording and averaging of a multitude of heating pulses and transmission changes for each sample. This opportunity to conduct many melting experiments in one reaction vessel with several measurements per second is a unique advantage of this approach. For each heating pulse, the change in the transmission of the sample was recorded by detector I, while fluctuations of the laser intensity were recorded by detector II. The raw data were recorded from both detectors at a sampling rate of 120 kS s−1 (16 Bit ADC, National Instruments USB-6011). By evaluating the median value of 6000 data points before and after the heating pulse for each detector the change in transmission could be approximately obtained by calculating

Finally, the 60 individual measurements per sample of ΔTrans were added to the median extinction change  .
.
Fig. 6 shows a comparison of the selective melting experiments, displaying the median transmission change  at 532 and 1064 nm induced upon laser heating at the same wavelength. Specifically, the samples examined contained clusters of hybridized 10 and 60 nm spherical Au NPs (Fig. 6, sample A), of hybridized high aspect ratio (93 × 15 nm) Au NRs (described above, Fig. 6, sample B), and of a binary mixture containing a 1
![[thin space (1/6-em)]](https://www.rsc.org/images/entities/char_2009.gif) :1 mixture of samples A and B (Fig. 6, sample C). The 10 nm and 60 nm spherical Au NPs were functionalized with two different single-stranded DNA sequences, namely with a 5′-thiol-A35-triethylene glycol2-TGGAGATAAGAGTGAGGTTTGG-3′ on the 10 nm spherical Au NPs and a 5′-thiol-A25GAACCTCA-3′- dideoxycytidine sequence on the 60 nm spherical Au NPs. Both sequences are complementary through the sequences marked in bold. The multi-A sequences and triethylene glycols serve as spacers, while dideoxycytidine serves as a 3′ chain terminator. Self-assembled clusters of such spherical Au NPs show a melting temperature of 54.7 °C for the specific buffer conditions used in subsequent experiments (see Fig. S15†). The DNA sequences on the spherical Au NPs and on the Au NRs (see above) only allowed pure clusters of either spherical Au NPs or of Au NRs to form under the experimental conditions used for the transmission experiments. Conventional melting experiments (not shown here) confirmed that under the given conditions mixed clusters do not form. In all three cases the NPs were allowed to hybridize for 60 minutes at room temperature in a PBS buffer containing 5 mM phosphate and 210 mM NaCl. Sample A only shows a significant transmission change when the 532 nm laser is used for the experiment, while for the 1064 nm laser the transmission change is negligible. The transmission change at 532 nm indicates that the double-stranded DNA that keeps the spherical gold nanoparticles self-assembled in sample A melts upon illumination with a 532 nm laser due to the significant light absorption of the clusters at this wavelength. In contrast, at 1064 nm their absorption is negligible, and thus, illumination with a 100 μs laser pulse at this wavelength does not induce a significant light-to-heat conversion that suffices to reach the melting temperature of the double-stranded DNA. The results are analogous for sample B, though in this case laser-assisted DNA melting (NP disassembly) is attained with a 1064 nm laser due to the strong light absorption of the clusters at this wavelength, and is almost negligible for the 532 nm one. Importantly, the results obtained for a 1:1 mixture of both cluster types (sample C) confirm that in such a binary mixture it is possible to selectively address (melt) the dsDNA of the spherical gold nanoparticle clusters or the dsDNA of the Au NR clusters by selecting a suitable laser wavelength. With the 532 nm laser, only the clusters consisting of the spherical Au nanoparticles disassemble, while with the 1064 nm laser only the clusters comprised of the Au NRs undergo disassembly. These measurements show, that different dsDNAs can be selectively addressed and optothermally dehybridized within one solution, regardless of their respective melting temperature. Even though in our experiments the clusters solely composed of spherical Au NPs have a higher melting temperature (TM = 54.7 °C, see Fig. S15†) than those composed of only Au NRs (TM = 48.1 °C), they can be selectively melted without affecting the latter ones.|| In an earlier work Poon et al. demonstrated that the predominant photothermal release mechanism of DNA from gold nanoparticles occurs via denaturation of the double-stranded DNA at laser intensities in the order of 130 kW mm−2 rather than via the thermolysis of the Au–S bonds.78 The laser intensities that we used in our experiments are much lower than 130 kW mm−2 (namely, 4.5–6.2 kW mm−2) and, hence, it can be assumed that Au–S bond breaking is negligible in our case. Moreover, we also found (data not shown) that even after applying tens of thousands of laser pulses, i.e., after having irradiated each nanoparticle in the sample several times, they still maintain their ability to self-assemble. If a substantial Au–S bond breaking had occurred, such a reversible self-assembly would not be possible.
:1 mixture of samples A and B (Fig. 6, sample C). The 10 nm and 60 nm spherical Au NPs were functionalized with two different single-stranded DNA sequences, namely with a 5′-thiol-A35-triethylene glycol2-TGGAGATAAGAGTGAGGTTTGG-3′ on the 10 nm spherical Au NPs and a 5′-thiol-A25GAACCTCA-3′- dideoxycytidine sequence on the 60 nm spherical Au NPs. Both sequences are complementary through the sequences marked in bold. The multi-A sequences and triethylene glycols serve as spacers, while dideoxycytidine serves as a 3′ chain terminator. Self-assembled clusters of such spherical Au NPs show a melting temperature of 54.7 °C for the specific buffer conditions used in subsequent experiments (see Fig. S15†). The DNA sequences on the spherical Au NPs and on the Au NRs (see above) only allowed pure clusters of either spherical Au NPs or of Au NRs to form under the experimental conditions used for the transmission experiments. Conventional melting experiments (not shown here) confirmed that under the given conditions mixed clusters do not form. In all three cases the NPs were allowed to hybridize for 60 minutes at room temperature in a PBS buffer containing 5 mM phosphate and 210 mM NaCl. Sample A only shows a significant transmission change when the 532 nm laser is used for the experiment, while for the 1064 nm laser the transmission change is negligible. The transmission change at 532 nm indicates that the double-stranded DNA that keeps the spherical gold nanoparticles self-assembled in sample A melts upon illumination with a 532 nm laser due to the significant light absorption of the clusters at this wavelength. In contrast, at 1064 nm their absorption is negligible, and thus, illumination with a 100 μs laser pulse at this wavelength does not induce a significant light-to-heat conversion that suffices to reach the melting temperature of the double-stranded DNA. The results are analogous for sample B, though in this case laser-assisted DNA melting (NP disassembly) is attained with a 1064 nm laser due to the strong light absorption of the clusters at this wavelength, and is almost negligible for the 532 nm one. Importantly, the results obtained for a 1:1 mixture of both cluster types (sample C) confirm that in such a binary mixture it is possible to selectively address (melt) the dsDNA of the spherical gold nanoparticle clusters or the dsDNA of the Au NR clusters by selecting a suitable laser wavelength. With the 532 nm laser, only the clusters consisting of the spherical Au nanoparticles disassemble, while with the 1064 nm laser only the clusters comprised of the Au NRs undergo disassembly. These measurements show, that different dsDNAs can be selectively addressed and optothermally dehybridized within one solution, regardless of their respective melting temperature. Even though in our experiments the clusters solely composed of spherical Au NPs have a higher melting temperature (TM = 54.7 °C, see Fig. S15†) than those composed of only Au NRs (TM = 48.1 °C), they can be selectively melted without affecting the latter ones.|| In an earlier work Poon et al. demonstrated that the predominant photothermal release mechanism of DNA from gold nanoparticles occurs via denaturation of the double-stranded DNA at laser intensities in the order of 130 kW mm−2 rather than via the thermolysis of the Au–S bonds.78 The laser intensities that we used in our experiments are much lower than 130 kW mm−2 (namely, 4.5–6.2 kW mm−2) and, hence, it can be assumed that Au–S bond breaking is negligible in our case. Moreover, we also found (data not shown) that even after applying tens of thousands of laser pulses, i.e., after having irradiated each nanoparticle in the sample several times, they still maintain their ability to self-assemble. If a substantial Au–S bond breaking had occurred, such a reversible self-assembly would not be possible.
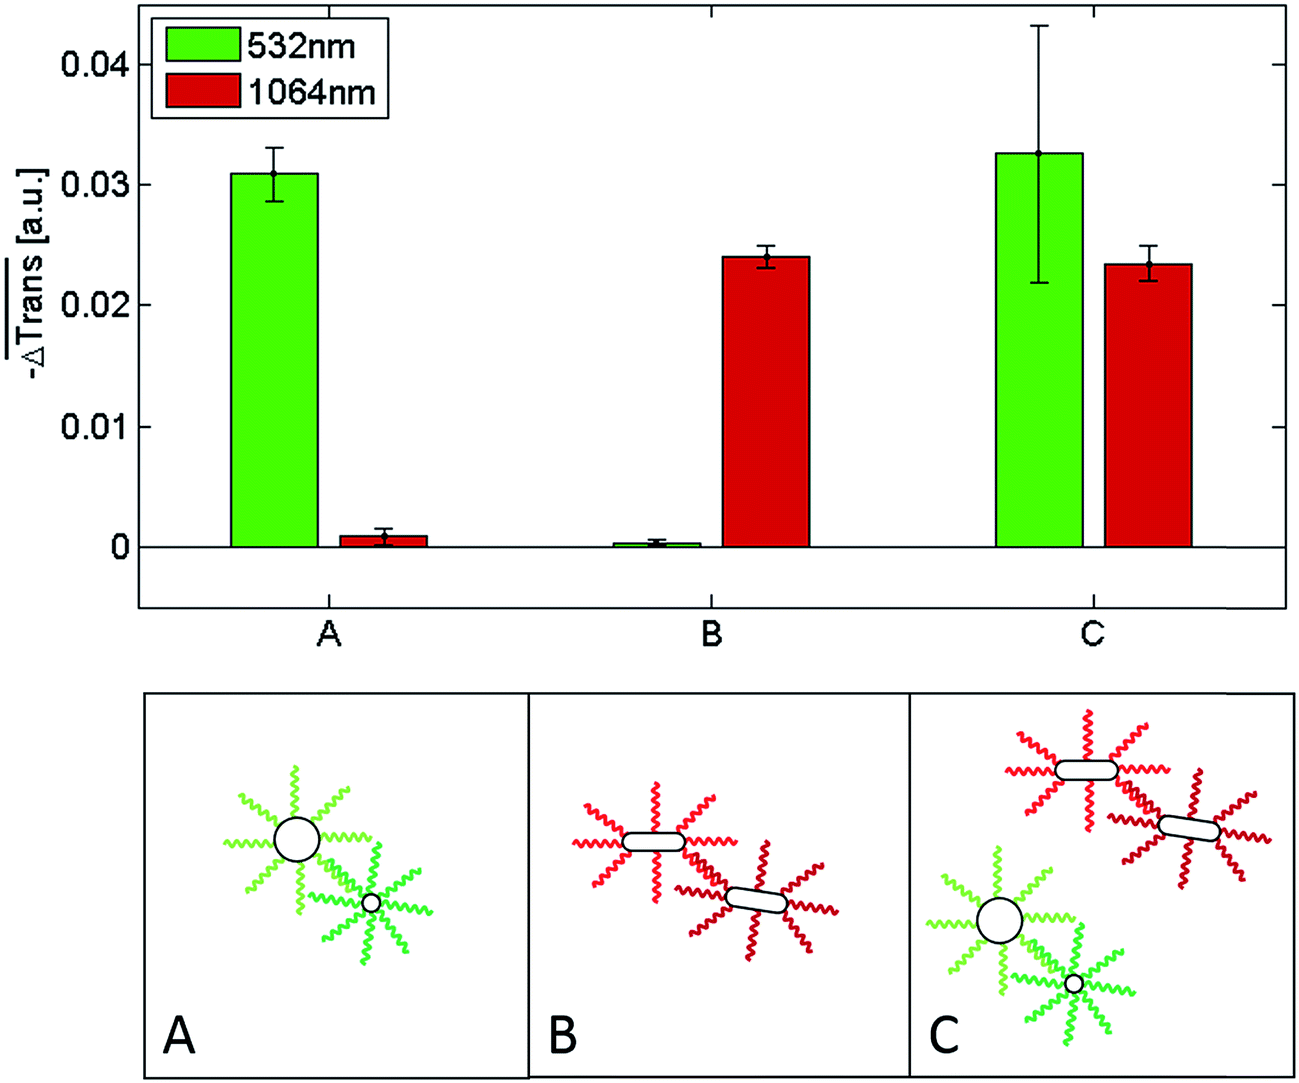 | ||
Fig. 6 Top:  for samples A, B and C upon 100 μs laser heating and transmission detection at 532 nm (green bar) and 1064 nm (red bar). The data correspond to the median over 60 single measurements, while the error bars show the standard error of the median values. Bottom: schematic illustration of the NP configurations in samples A, B and C before laser heating. Note that in reality, clusters can reach sizes of hundreds or thousands of individual NPs. for samples A, B and C upon 100 μs laser heating and transmission detection at 532 nm (green bar) and 1064 nm (red bar). The data correspond to the median over 60 single measurements, while the error bars show the standard error of the median values. Bottom: schematic illustration of the NP configurations in samples A, B and C before laser heating. Note that in reality, clusters can reach sizes of hundreds or thousands of individual NPs. | ||
Having shown that it is possible to selectively induce the ultrafast melting of the dsDNA that allows self-assembly of either all-spherical or all-rod-like gold nanoparticles, we investigated the potential of DNA-functionalized Au NRs as NIR-addressable probes for the detection of an ssDNA target in binary nanoparticle mixtures analogous to that of sample C in Fig. 6. For the detection of the ssDNA target a competitive assay was designed. The role of the ssDNA target was to saturate the ‘capture’ oligonucleotides on one of the NP types (either the spheres or the rods) in order to prevent cluster formation and, thus, suppress the corresponding transmission change upon laser heating. For this purpose, the NPs functionalized with DNA complementary to the target DNA were first incubated with the ssDNA target for 15 minutes at room temperature in order to inactivate them for clustering. Thereafter, the remaining NPs (spheres and rods) were added to the solution, allowing the NPs bearing complementary DNA sequences to hybridize for 45 minutes. The results of these experiments are summarized in Fig. 7. In sample A we added an ssDNA target complementary to the 60 nm Au nanoparticles (dark green strand). As a result of hybridization, the target blocked the assembly of the 60 nm Au nanoparticles with the 10 nm ones. Hence, in the mixture only the Au NRs could form clusters by means of DNA hybridization. As shown in Fig. 7, a significant transmission change at 1064 nm occurs after irradiation with a 1064 nm laser pulse, while for irradiation with 532 nm pulses, the transmission change at this wavelength is negligible. This result confirms that in this scenario only the Au NRs can form clusters. On the other hand, addition of an ssDNA target complementary to the capture sequences on the Au NRs (sample B in Fig. 7) prevents their self-assembly with the Au NRs functionalized with the complementary strands. Therefore, no variation in extinction at 1064 nm occurs upon irradiation with 1064 nm laser pulses. However, since the DNA strands of the 60 and 10 nm Au NPs can hybridize, DNA melting can be triggered upon irradiation with a 532 nm laser (see corresponding transmission change in Fig. 7). The results for sample C, where no target DNA is present, illustrate that both cluster types (all-spherical and all rod-like) can form and, thus, disassemble upon laser irradiation, since no target DNA hinders the formation of either of them. The results presented here demonstrate that both the spherical Au NPs and the Au NRs can be used as laser-addressable probes for multiplex DNA assays, or for ultrafast and selective DNA melting assays. While the detection assay works equally well for both NP types, the NIR-addressability of the high aspect ratio Au NR–DNA conjugates used herein offers a competitive advantage. They can provide access to the biological window and, therefore, this makes them highly attractive for the interrogation of clinical samples. In this regard, and given their biocompatible character, they could also potentially be used for DNA detection in in vivo environments.
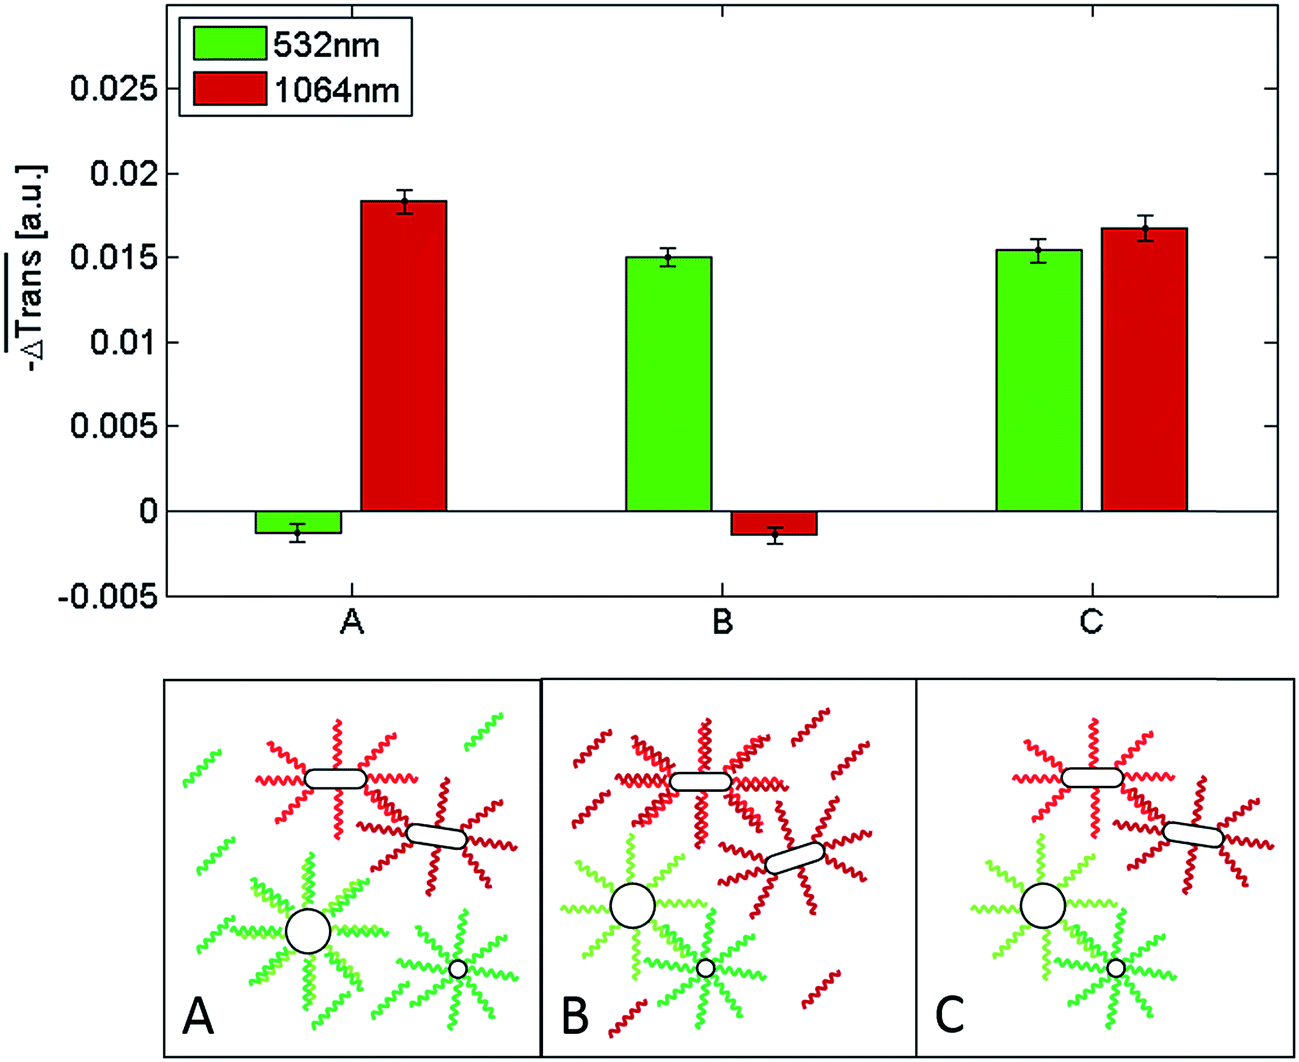 | ||
Fig. 7 Top:  for samples A, B and C upon 100 μs laser heating and transmission detection at 532 nm (green bar) and 1064 nm (red bar). The data displayed are the median over 60 single measurements. The error bars show the standard error of the median values. Bottom: schematic illustration of the NP configurations and target DNA in samples A, B and C before laser heating. Note that, in reality, the clusters can reach sizes of hundreds or thousands of individual NPs. Sample C serves as a control, since no target DNA was added to this sample. Note that the slightly smaller transmission change in this sample vs. that of sample C in Fig. 6 may be attributed to the 15 minutes shorter hybridization time (45 vs. 60 min.). Longer hybridization times lead to larger clusters which, in turn, lead to larger transmission changes. for samples A, B and C upon 100 μs laser heating and transmission detection at 532 nm (green bar) and 1064 nm (red bar). The data displayed are the median over 60 single measurements. The error bars show the standard error of the median values. Bottom: schematic illustration of the NP configurations and target DNA in samples A, B and C before laser heating. Note that, in reality, the clusters can reach sizes of hundreds or thousands of individual NPs. Sample C serves as a control, since no target DNA was added to this sample. Note that the slightly smaller transmission change in this sample vs. that of sample C in Fig. 6 may be attributed to the 15 minutes shorter hybridization time (45 vs. 60 min.). Longer hybridization times lead to larger clusters which, in turn, lead to larger transmission changes. | ||
Conclusion
In summary, we have shown that through a careful aqueous-to-organic phase transfer, involving partial PEGylation, subsequent back-transfer to buffer, and oligonucleotide grafting, Au NRs of different aspect ratios can be functionalized with single-stranded thiol-ending DNA. The process is highly reproducible and yields Au NR–DNA conjugates with a controlled number of DNA strands per particle and long-term stability in high ionic strength and cell culture media. A MTS, membrane leakage, ROS activity, and cell proliferation assay with adherent lung carcinoma A549 cells indicated a high biocompatibility of the Au NR–DNA conjugates, ascribed to the efficient CTAB removal during the functionalization process and to their high colloidal stability. The Au NR–DNA conjugates undergo self-assembly with nanoparticles functionalized with complementary oligonucleotides and, importantly, they can be selectively addressed with a NIR laser in a mixture containing clusters of hybridized DNA-functionalized spherical Au NPs and clusters of hybridized Au NRs. This is enabled by the distinctive NIR plasmonic absorption of the Au NR–DNA conjugates, which through an efficient light-to-heat conversion upon illumination with a NIR laser (1064 nm, microsecond pulses) leads to the ultrafast and selective melting of the dsDNA that keeps the Au NR–DNA clusters together. The data presented here are a first proof of concept and demonstrate that two different DNA sequences (even with similar or identical melting temperatures) can be selectively addressed and thermally melted in a single sample container. To the best of our knowledge, no other concept exists that allows to do the same. With our approach one can optothermally address and denature different types of DNA sequences independently. This opens new opportunities for, e.g., gene expression studies or, perhaps, for conducting a multiplex PCR with different protocols for each sequence. We have demonstrated that Au NR–DNA conjugates can serve as NIR-addressable probes and mediators for ultrafast DNA melting. Furthermore, given their biocompatibility and the access they grant to the biological window, they are ideally suited for in vivo DNA detection or for applications in in vitro diagnostics.Acknowledgements
We acknowledge the Federal Ministry of Economics and Technology (Germany) for funding of the ZIM project KF2260002AJ1. We thank Dr Madathumpady Abubaker Habeeb Muhammed for the synthesis of the high aspect ratio Au NR sample and Christoph Hohmann (NIM) for graphical support.Notes and references
- B. Pelaz, S. Jaber, D. J. de Aberasturi, V. Wulf, T. Aida, J. M. de la Fuente, J. Feldmann, H. E. Gaub, L. Josephson, C. R. Kagan, N. A. Kotov, L. M. Liz-Marzán, H. Mattoussi, P. Mulvaney, C. B. Murray, A. L. Rogach, P. S. Weiss, I. Willner and W. J. Parak, ACS Nano, 2012, 6, 8468–8483 CrossRef CAS PubMed.
- E. C. Dreaden, A. M. Alkilany, X. Huang, C. J. Murphy and M. A. El-Sayed, Chem. Soc. Rev., 2012, 41, 2740–2779 RSC.
- A. Sánchez-Iglesias, M. Grzelczak, J. Pérez-Juste and L. M. Liz-Marzán, Angew. Chem., Int. Ed., 2010, 49, 9985–9989 CrossRef PubMed.
- X. Gao, Y. Cui, R. M. Levenson, L. W. K. Chung and S. Nie, Nat. Biotechnol., 2004, 22, 969–976 CrossRef CAS PubMed.
- J. Rongchao, C. YunWei, C. A. Mirkin, K. L. Kelly, G. C. Schatz and J. G. Zheng, Science, 2001, 294, 1901–1903 CrossRef PubMed.
- I. Kriegel, C. Jiang, J. Rodríguez-Fernández, R. D. Schaller, D. V. Talapin, E. da Como and J. Feldmann, J. Am. Chem. Soc., 2012, 134, 1583–1590 CrossRef CAS PubMed.
- I. Kriegel, J. Rodríguez-Fernández, A. Wisnet, H. Zhang, C. Waurisch, A. Eychmueller, A. Dubavik, A. O. Govorov and J. Feldmann, ACS Nano, 2013, 7, 4367–4377 CrossRef CAS PubMed.
- A. J. Blanch, M. Doeblinger and J. Rodríguez-Fernández, Small, 2015, 11, 4550–4559 CrossRef CAS PubMed.
- M. A. H. Muhammed, M. Doeblinger and J. Rodríguez-Fernández, J. Am. Chem. Soc., 2015, 137, 11666–11677 CrossRef CAS PubMed.
- W. Li, R. Zamani, P. Rivera-Gil, B. Pelaz, M. Ibáñez, D. Cadavid, A. Shavel, R. A. Álvarez-Puebla, W. J. Parak, J. Arbiol and A. Cabot, J. Am. Chem. Soc., 2013, 135, 7098–7101 CrossRef CAS PubMed.
- A. Guerrero-Martínez, B. Auguié, J. L. Alonso-Gómez, Z. Džolić, S. Gómez-Graña, M. Žinić, M. M. Cid and L. M. Liz-Marzán, Angew. Chem., Int. Ed., 2011, 50, 5499–5503 CrossRef PubMed.
- Q. Liu, Y. Cui, D. Gardner, X. Li, S. He and I. I. Smalyukh, Nano Lett., 2010, 10, 1347–1353 CrossRef CAS PubMed.
- H. J. Parab, H. M. Chen, T. C. Lai, J. H. Huang, P. H. Chen, R. S. Liu, M. Hsiao, C. H. Chen, D. P. Tsai and Y. K. Hwu, J. Phys. Chem. C, 2009, 113, 7574–7578 CAS.
- T. R. Kuo, V. A. Hovhannisyan, Y. C. Chao, S. L. Chao, S. J. Chiang, S. J. Lin, C. Y. Dong and C. C. Chen, J. Am. Chem. Soc., 2010, 132, 14163–14171 CrossRef CAS PubMed.
- T. Kawano, Y. Niidome, T. Mori, Y. Katayama and T. Niidome, Bioconjugate Chem., 2009, 20, 209–212 CrossRef CAS PubMed.
- T. S. Hauck, T. L. Jennings, T. Yatsenko, J. C. Kumaradas and W. C. W. Chan, Adv. Mater., 2008, 20, 3832–3838 CrossRef CAS.
- J. Rodríguez-Fernández, M. Fedoruk, C. Hrelescu, A. A. Lutich and J. Feldmann, Nanotechnology, 2011, 22, 245708 CrossRef PubMed.
- X. H. Huang, I. H. El-Sayed, W. Qian and M. A. El-Sayed, J. Am. Chem. Soc., 2006, 128, 2115–2120 CrossRef CAS PubMed.
- E. B. Dickerson, E. C. Dreaden, X. H. Huang, I. H. El-Sayed, H. H. Chu, S. Pushpanketh, J. F. McDonald and M. A. El-Sayed, Cancer Lett., 2008, 269, 57–66 CrossRef CAS PubMed.
- W. I. Choi, J. Y. Kim, C. Kang, C. C. Byeon, Y. H. Kim and G. Tee, ACS Nano, 2011, 5, 1995–2003 CrossRef CAS PubMed.
- L. Tong, Q. Wei, A. Wei and J.-X. Cheng, Photochem. Photobiol., 2009, 85, 21–32 CrossRef CAS PubMed.
- H. F. Wang, T. B. Huff, D. A. Zweifel, W. He, P. S. Low, A. Wei and J. X. Cheng, Proc. Natl. Acad. Sci. U. S. A., 2005, 102, 15752–15756 CrossRef CAS PubMed.
- M. Tebbe, C. Kuttner, M. Männel, A. Fery and M. Chanana, ACS Appl. Mater. Interfaces, 2015, 7, 5984–5991 CAS.
- H. W. Liao and J. H. Hafner, Chem. Mater., 2005, 17, 4636–4641 CrossRef CAS.
- T. B. Huff, M. N. Hansen, Y. Zhao, J. X. Cheng and A. Wei, Langmuir, 2007, 23, 1596–1599 CrossRef CAS PubMed.
- A. Gole and C. J. Murphy, Langmuir, 2005, 21, 10756–10762 CrossRef CAS PubMed.
- V. Baumann, M. A. Habeeb Muhammed, A. J. Blanch, P. Dey and J. Rodríguez-Fernández, Isr. J. Chem., 2016, 56, 195–213 CrossRef CAS.
- C. A. Mirkin, R. L. Letsinger, R. C. Mucic and J. J. Storhoff, Nature, 1996, 382, 607–609 CrossRef CAS PubMed.
- Z. D. Wang, J. Q. Zhang, J. M. Ekman, P. J. A. Kenis and Y. Lu, Nano Lett., 2010, 10, 1886–1891 CrossRef CAS PubMed.
- Z. D. Wang, L. H. Tang, L. H. Tan, J. H. Li and Y. Lu, Angew. Chem., Int. Ed., 2012, 51, 9078–9082 CrossRef CAS PubMed.
- L. Y. Zhang, C. X. Guo, Z. M. Cui, J. Guo, Z. L. Dong and C. M. Li, Chem.–Eur. J., 2012, 18, 15693–15698 CrossRef CAS PubMed.
- X. Q. Liu, F. Wang, R. Aizen, O. Yehezkeli and I. Willner, J. Am. Chem. Soc., 2013, 135, 11832–11839 CrossRef CAS PubMed.
- L. H. Tan, H. Xing and Y. Lu, Acc. Chem. Res., 2014, 47, 1881–1890 CrossRef CAS PubMed.
- D. K. Lim, K. S. Jeon, J. H. Hwang, H. Kim, S. Kwon, Y. D. Suh and J. M. Nam, Nat. Nanotechnol., 2011, 6, 452–460 CrossRef CAS PubMed.
- J. Do, R. Schreiber, A. A. Lutich, T. Liedl, J. Rodríguez-Fernández and J. Feldmann, Nano Lett., 2012, 12, 5008–5013 CrossRef CAS PubMed.
- S. J. Hurst, A. K. R. Lytton-Jean and C. A. Mirkin, Anal. Chem., 2006, 78, 8313–8318 CrossRef CAS PubMed.
- X. Zhang, B. Liu, M. R. Servos and J. Liu, Langmuir, 2013, 29, 6091–6098 CrossRef CAS PubMed.
- B. Liu, E. Y. Kelly and J. Liu, Langmuir, 2014, 30, 13228–13234 CrossRef CAS PubMed.
- W. Zhou, F. Wang, J. Ding and J. Liu, ACS Appl. Mater. Interfaces, 2014, 6, 14795–14800 CAS.
- A. Wijaya and K. Hamad-Schifferli, Langmuir, 2008, 24, 9966–9969 CrossRef CAS PubMed.
- J. Li, B. Zhu, Z. Zhu, Y. Zhang, X. Yao, S. Tu, R. Liu, S. Jia and C. J. Yang, Langmuir, 2015, 31, 7869–7876 CrossRef CAS PubMed.
- D. Shi, C. Song, Q. Jiang, Z.-G. Wang and B. Ding, Chem. Commun., 2013, 49, 2533–2535 RSC.
- Z. Li, Z. Zhu, W. Liu, Y. Zhou, B. Han, Y. Gao and Z. Tang, J. Am. Chem. Soc., 2012, 134, 3322–3325 CrossRef CAS PubMed.
- W. Ma, H. Kuang, L. Xu, L. Ding, C. Xu, L. Wang and N. A. Kotov, Nat. Commun., 2013, 4, 2689 Search PubMed.
- S. Pal, Z. Deng, H. Wang, S. Zou, Y. Liu and H. Yan, J. Am. Chem. Soc., 2011, 133, 17606–17609 CrossRef CAS PubMed.
- C. Zhou, X. Duan and N. Liu, Nat. Commun., 2015, 6, 8102 CrossRef CAS PubMed.
- A. Kuzyk, R. Schreiber, H. Zhang, A. O. Govorov, T. Liedl and N. Liu, Nat. Mater., 2014, 13, 862–866 CrossRef CAS PubMed.
- Z. Chen, X. Lan, Y.-C. Chiu, X. Lu, W. Ni, H. Gao and Q. Wang, ACS Photonics, 2015, 2, 392–397 CrossRef CAS.
- C. Shen, X. Lan, X. Lu, W. Ni and Q. Wang, Chem. Commun., 2015, 51, 13627–13629 RSC.
- X. Lan, X. Lu, C. Shen, Y. Ke, W. Ni and Q. Wang, J. Am. Chem. Soc., 2015, 137, 457–462 CrossRef CAS PubMed.
- J. H. Joo and J.-S. Lee, Anal. Chem., 2013, 85, 6580–6586 CrossRef CAS PubMed.
- H. Takahashi, Y. Niidome, T. Niidome, K. Kaneko, H. Kawasaki and S. Yamada, Langmuir, 2006, 22, 2–5 CrossRef CAS PubMed.
- B. Thierry, J. Ng, T. Krieg and H. J. Griesser, Chem. Commun., 2009, 1724–1726 RSC.
- B. Nikoobakht and M. A. El-Sayed, Chem. Mater., 2003, 15, 1957–1962 CrossRef CAS.
- M. Z. Liu and P. Guyot-Sionnest, J. Phys. Chem. B, 2005, 109, 22192–22200 CrossRef CAS PubMed.
- X. Ye, C. Zheng, J. Chen, Y. Gao and C. B. Murray, Nano Lett., 2013, 13, 765–771 CrossRef CAS PubMed.
- A. Wijaya, S. B. Schaffer, I. G. Pallares and K. Hamad-Schifferli, ACS Nano, 2009, 3, 80–86 CrossRef CAS PubMed.
- J. Zhang, S. P. Song, L. H. Wang, D. Pan and C. H. Fan, Nat. Protoc., 2007, 2, 2888–2895 CrossRef CAS PubMed.
- L. M. Demers, C. A. Mirkin, R. C. Mucic, R. A. Reynolds, R. L. Letsinger, R. Elghanian and G. Viswanadham, Anal. Chem., 2000, 72, 5535–5541 CrossRef CAS PubMed.
- E. Dulkeith, M. Ringler, T. A. Klar, J. Feldmann, A. M. Javier and W. J. Parak, Nano Lett., 2005, 5, 585–589 CrossRef CAS PubMed.
- D. V. Guzatov, S. V. Vaschenko, V. V. Stankevich, A. Y. Lunevich, Y. F. Glukhov and S. V. Gaponenko, J. Phys. Chem. C, 2012, 116, 10723–10733 CAS.
- N. R. Jana, L. Gearheart, S. O. Obare and C. J. Murphy, Langmuir, 2002, 18, 922–927 CrossRef CAS.
- J. Rodríguez-Fernández, J. Pérez-Juste, P. Mulvaney and L. M. Liz-Marzán, J. Phys. Chem. B, 2005, 109, 14257–14261 CrossRef PubMed.
- S. M. Xu, H. Yuan, A. Xu, J. Wang and L. J. Wu, Langmuir, 2011, 27, 13629–13634 CrossRef CAS PubMed.
- M. B. Mohamed, K. Z. Ismail, S. Link and M. A. El-Sayed, J. Phys. Chem. B, 1998, 102, 9370–9374 CrossRef CAS.
- Y. Horiguchi, K. Honda, Y. Kato, N. Nakashima and Y. Niidome, Langmuir, 2008, 24, 12026–12031 CrossRef CAS PubMed.
- B. Díaz, C. Sánchez-Espinel, M. Arruebo, J. Faro, E. de Miguel, S. Magadán, C. Yagüe, R. Fernández-Pacheco, M. R. Ibarra, J. Santamaría and Á. González-Fernández, Small, 2008, 4, 2025–2034 CrossRef PubMed.
- A. Petri-Fink, B. Steitz, A. Finka, J. Salaklang and H. Hofmann, Eur. J. Pharm. Biopharm., 2008, 68, 129–137 CrossRef CAS PubMed.
- Z. E. Allouni, M. R. Cimpan, P. J. Høl, T. Skodvin and N. R. Gjerdet, Colloids Surf., B, 2009, 68, 83–87 CrossRef CAS PubMed.
- T. Niidome, M. Yamagata, Y. Okamoto, Y. Akiyama, H. Takahashi, T. Kawano, Y. Katayama and Y. Niidome, J. Controlled Release, 2006, 114, 343–347 CrossRef CAS PubMed.
- A. M. Alkilany, P. K. Nagaria, C. R. Hexel, T. J. Shaw, C. J. Murphy and M. D. Wyatt, Small, 2009, 5, 701–708 CrossRef CAS PubMed.
- A. O. Govorov, W. Zhang, T. Skeini, H. Richardson, J. Lee and N. A. Kotov, Nanoscale Res. Lett., 2006, 1, 84–90 CrossRef.
- A. O. Govorov and H. H. Richardson, Nano Today, 2007, 2, 30–38 CrossRef.
- G. Baffou, R. Quidant and F. Javier Garcia de Abajo, ACS Nano, 2010, 4, 709–716 CrossRef CAS PubMed.
- P. Keblinski, D. G. Cahill, A. Bodapati, C. R. Sullivan and T. A. Taton, J. Appl. Phys., 2006, 100, 054305 CrossRef.
- J. Stehr, C. Hrelescu, R. A. Sperling, G. Raschke, M. Wunderlich, A. Nichtl, D. Heindl, K. Kürzinger, W. J. Parak, T. A. Klar and J. Feldmann, Nano Lett., 2008, 8, 619–623 CrossRef CAS PubMed.
- C. Hrelescu, J. Stehr, M. Ringler, R. A. Sperling, W. J. Parak, T. A. Klar and J. Feldmann, J. Phys. Chem. C, 2010, 114, 7401–7411 CAS.
- L. Poon, W. Zandberg, D. Hsiao, Z. Erno, D. Sen, B. D. Gates and N. R. Branda, ACS Nano, 2010, 4, 6395–6403 CrossRef CAS PubMed.
Footnotes |
| † Electronic supplementary information (ESI) available: Vis-NIR spectra at the different steps of the DNA functionalization process; tables showing the effect of the number of centrifugation cycles on the amount of unbound DNA left in solution and the effect of temperature on the number of DNA strands grafted on the Au NRs' surface; effect of additional parameters/substances on the DNA loading capacity of the Au NRs; time evolution of DNA desorption in different media; XPS spectra; UV-vis-NIR spectra of high aspect ratio Au NRs functionalized with DNA; and melting curves for clusters of Au NRs and clusters of spherical Au NPs, as well as their respective vis-NIR spectra at different temperatures. See DOI: 10.1039/c6ra17156g |
| ‡ Current address: Max Planck Institute for Solid State Research, Heisenberg str. 1, 70569 Stuttgart, Germany. |
| § Our experimental results showed that the presence of 6-FAM in the HS-DNA sequence did not affect the Au NR stability during functionalization: the UV-vis-NIR spectra of Au NRs@HS-DNA and Au NRs@HS-DNA-6-FAM are identical. |
| ¶ Even if thousands of shots are accumulated in such a way that a meaningful portion of the solution gets excited by the laser for several minutes, a comparison of the spectra of the bulk solution would still not be appropriate. In this case, the nanoparticles within a sub-volume, and already hit by the laser, would rehybridize while the laser continues processing new sub-volumes. |
| || In conventional hybridization and melting experiments in bulk, it was confirmed that no mixed clusters comprising spherical and rod-like NPs form under our experimental conditions (data not shown). |
| This journal is © The Royal Society of Chemistry 2016 |