DOI:
10.1039/C6RA16957K
(Paper)
RSC Adv., 2016,
6, 77673-77681
Block copolymer and organic salts in forming aqueous biphases: a platform to identify molecular interactions in aqueous medium†
Received
1st July 2016
, Accepted 8th August 2016
First published on 9th August 2016
Abstract
An aqueous solution of a tri-block copolymer PPG–PEG–PPG has been used with two organic salts, sodium acetate and sodium citrate, to create new aqueous biphasic systems (ABS). Well defined phase diagrams with suitable tie-lines were obtained by a turbidometric titration method at 303 K. The tie-line lengths and slopes of the tie lines were calculated and the results were validated using Othmer–Tobias and Bancroft equations. The binodals indicate that sodium citrate offers a larger biphasic region with the polymer than the acetate salt. The aggregation number of the pure polymer solution and that separated from ABS, determined by a fluorescence quenching method, clearly indicate a hike due to reorganization of the polymer chains upon phase separation. The newly designed systems have been used to extract three different vitamins, thiamine (B1), riboflavin (B2) and cholecalciferol (D3), together with the biomolecule caffeine. These studies indicate that caffeine interferes with the extraction of cholecalciferol. Possible interactions between the two biomolecules, caffeine and cholecalciferol, thus identified, were further verified by gathering different spectral evidence like absorption, emission, 1H NMR, and mass spectra and from confocal microscopic studies. Therefore results of binary extractions of two components in an ABS can act as an indicator of molecular interactions much a priori to confirmation by sophisticated analytical techniques.
Introduction
Aqueous Biphasic Systems (ABS) formed from two mutually incompatible aqueous solutions of polymers,1 or a polymer and a salt,2 or two salts3 are upcoming cleaner alternatives for several analytical processes.4 The driving force for the formation of two distinct phases above a critical concentration and temperature is the salting out strength of the components, hydrophilic and hydrophobic interactions and other thermodynamic parameters. Aqueous biphasic extraction is a gentle method as compared to the conventional solvent extraction methods generally employed for the extraction of proteins/enzymes and other biomolecules.5 ABSs have been widely used in biotechnological applications as non-denaturing and green separation media.6,7 ABS retain all the practical advantages of liquid–liquid extraction in addition to their unique qualities of being nonflammable, nontoxic and nonvolatile. The components are inexpensive and have favorable phase separation and mass transfer characteristics that are compatible with conventional solvent extraction equipment. Moreover, they provide mild conditions that do not denature unstable biomolecules as the interfacial stress is far too low than water–organic solvent systems causing less damage to the molecule to be extracted. The polymer layers stabilize the extracted biomolecules, favoring a higher concentration of the desired protein in one of the phases resulting in an effective extraction.
Vitamins are essential components of food, which are necessary in the diet for maintenance of body cell and normal metabolic functions.8–11 Only a limited literature reports are available on the aqueous extraction of thiamine and riboflavin. Tabrizi12 employed a simple cloud point extraction of thiamine in nonionic surfactant Triton-X-114 micelles. The procedure proposed the oxidation of thiamine with ferricyanide to form thiochrome and its subsequent spectrofluorimetric determination in human urine. Sabah Shiri et al.13 used aqueous two phase systems composed of polyethylene glycol and Na2SO4/Na2CO3 to determine riboflavin in urine and pharmaceutical samples by spectrophotometric method. To the best of our knowledge, no report on the extraction of vitamin D using ABS is available in literature.
Caffeine is a central nervous system stimulant of the methylxanthine class of psychoactive drugs. Caffeine stimulates cardiac muscle, relaxes smooth muscle and increases metabolic rate.14 But caffeine can be a very dangerous drug that can have a detrimental effect on health if taken inappropriately. It can interfere with digestion and vitamin absorption. Consuming too much of caffeine can cause the depletion of some of the nutrients essential for well being. The current and commercially available methods for extracting caffeine (for instance, decaffeinated black tea) are solvent-based extraction techniques that use ethyl acetate, methylene chloride, or supercritical carbon dioxide.15 For uses other than human consumption, the extraction of caffeine from aqueous solution is carried out with chloroform and methylene chloride solvents. Caffeine is usually quantified with spectroscopic or mass spectrometry methods, such as the Fourier transform infrared (FTIR) spectroscopy.16 Extraction of caffeine in an aqueous two phase system was observed earlier using ionic liquid based ABS.17,18
Interactions between biologically active molecules viz., drugs, enzymes, vitamins, proteins, etc., have become an intensified field of study as they lead to several advantageous as well as harmful effects on living systems.19 For instance, cinacalcet (CIN) used for hyperparathyroidism when co-administered with propranolol (PPN), a β-blocker used for the treatment of hypertension causes side effects like anxiety, diarrhea, and asthenia.20 An intensified research is therefore required to identify such interactive species which would otherwise cause undesirable consequences. Literature reports on drug–drug interactions,21 drug–biomolecule interactions,22,23 inter biomolecular interactions,24 etc., have energized the use of sophisticated instruments for the identification and analysis of the chemical aspects of such interactions. Simple chemical systems are therefore urgently solicited to identify such interactive entities.
In this work, aqueous solution of a tri-block copolymer has been used against two organic salts to create new aqueous biphasic systems. The polymer comprises of polypropylene glycol (PPG)–polyethylene glycol (PEG)–polypropylene glycol (PPG). The salts used here are sodium acetate and tri-sodium citrate. We have chosen organic salts over the popularly used inorganic sulfate or phosphate salts because at higher concentration even these salts are toxic in nature. So the proposed ABS, PPG–PEG–PPG/acetate and PPG–PEG–PPG/citrate will provide mild environment to carry out extraction and separation processes. We have characterized the polymer–salt two phase systems with their corresponding phase diagrams. The binodal curves are plotted and correlated with Merchuk equation. The liquid–liquid equilibrium data for the investigated systems were determined and correlated with the Othmer–Tobias and Bancroft equations. The aggregation number of PPG–PEG–PPG solution from different biphasic systems were determined by fluorescence quenching method and compared with the pure copolymer solution to verify the change of molecular association and extent of micellization. The newly designed systems have been used to extract vitamins B1, B2, D3 and the biomolecule caffeine. Interaction of caffeine with vitamin D3 was suspected from the results of aqueous biphasic extractions which were confirmed by spectroscopic techniques like absorption, emission, NMR mass spectra and confocal microscopy.
Experimental
Materials
Polypropylene glycol-block-polyethylene glycol-block-polypropylene glycol (PPG–PEG–PPG) (Sigma), thiamine (Loba Chemie), riboflavin (SRL), vitamin D3 or cholecalciferol granules D-360 (Elder pharmaceuticals), caffeine (Merck, >99%), sodium acetate, tri-sodium citrate (Merck, >99%), fluorescein (Sigma) were used as received. All other chemicals used were of analytical grade.
Apparatus
The UV visible spectra were obtained using an Agilent 8453 diode array spectrophotometer. A digital pH meter Systronics (type no. 335) was used to measure and adjust the pH of different solutions. Centrifugation was done using Hermle microprocessor controlled universal refrigerated high speed table top centrifuge (model Z 36 K). A Mettler Toledo digital balance correct up to fourth decimal place was used for measuring the weights. Leica, TCS SP8 laser based confocal microscope using 404 nm laser source. Electrospray ionization mass spectra (ESI-MS) were recorded in a WATERS Xevo G2-SQTof. NMR spectra were obtained on a 300 MHz Bruker spectrometer using D2O solvent.
Construction of the phase diagrams
A simple turbidometric titration method was employed to construct the phase diagrams for our newly designed polymer–salt ABSs.25,26 Data points on the binodal curve were obtained by preparing different sets from biphasic compositions of the aqueous solutions of PPG–PEG–PPG (60%) against C2H3NaO2 (3 M) and PPG–PEG–PPG (30%) against Na3C6H5O7 (1 M) systems. The experimental procedure followed herein is described in detail in our earlier reports.25,26 Binodal curves were obtained by plotting weight percentages of PPG–PEG–PPG and the organic salts.
Tie-line determination
The experimental binodal curves were further correlated to the following equation proposed by Merchuk et al.27| |
Y = A![[thin space (1/6-em)]](https://www.rsc.org/images/entities/char_2009.gif) exp[(BX0.5) − (CX3)] exp[(BX0.5) − (CX3)]
| (1) |
where, Y and X are the mass fraction percentages of PPG–PEG–PPG and the salts respectively. A, B, and C are constants obtained by the regression of the experimental binodal data.
The tie-lines associated with the binodal curves were determined by a simple gravimetric method.28 Ternary mixtures composed of PPG–PEG–PPG + salt + water were prepared gravimetrically by mixing the corresponding weight fractions. The mixture was then vigorously shaken in BOD shaker, and then left to equilibrate and settle for 24 h at (303 ± 0.5) K, for a complete separation of the coexisting phases. Both phases were then carefully separated and individually weighed. The equations used for the tie line determination are shown in the ESI.†
Aggregation number
Aggregation number of the copolymer was determined by fluorescence quenching method. A typical experiment to determine the mean aggregation number in a surfactant system would involve the use of a luminescent probe, a quencher and a known concentration of the surfactant.29 For our experiment the copolymer solution is a self-assembled luminescent probe (>1.5% v/v)30 and we used potassium dichromate solution as the quencher.31 For the determination of the aggregation number of the block copolymer, its 30% solution was prepared and the fluorescence intensity was measured. Then with gradual addition of 10 mM K2Cr2O7 solution, the quenching of fluorescence was recorded. Same experiment was carried out with the top phase (polymer rich phase) separated from the polymer/salt biphasic system. Aggregation number was calculated using the following equation:29| | |
ln(I0/I) = CqNagg/[C] − CMC
| (2) |
where, I0 is the fluorescence intensity of the copolymer solution, I is the change in intensity in presence of quencher, Cq and [C] are the concentrations of the quencher and the polymer (mM) respectively. CMC is the critical micelle concentration of the copolymer. From the plot of ln(I0/I) vs. Cq, aggregation number of the polymer (Nagg) was calculated.
Extraction of vitamins in the ABS
We performed the extraction study of vitamin B1, B2 and cholecalciferol in our proposed PPG–PEG–PPG/citrate and PPG–PEG–PPG/acetate systems. Calibration was done in the polymer medium with 1 mM thiamine, 0.5 mM riboflavin and 0.5 mM cholecalciferol using their absorption spectrum. The characteristic λmax for thiamine solution was at the wavelength 240 nm and that of riboflavin and cholecalciferol were at 450 nm and 280 nm respectively. The biphase was prepared by mixing 3 mL solutions of each of the two phases. Different sets of aqueous two-phase systems were prepared for different pHs of the acetate and citrate salts solution (pH 5, 5.5, 6.5, 7.5 and 8.5). For extraction studies in ABS, 0.1 mL (1 mM) thiamine, 0.3 mL (0.5 mM) of riboflavin and 0.1 mL (0.5 mM) of cholecalciferol were added individually to the biphase for their respective extractions. The sets were then shaken well in a BOD shaker at 220 rpm for 10 minutes and centrifuged at 6000 rpm for 10 minutes. The phases were then separated for absorption spectral studies. The percentage extractions (% E) of the vitamins were calculated using the following equation:| |
 | (3) |
where [x]top phase and [x]bottom phase indicate the concentration of the analyte in the top and bottom phase respectively.
Extraction of caffeine in the ABS
We performed an extraction study of caffeine in our proposed PPG–PEG–PPG/acetate and PPG–PEG–PPG/citrate ABSs. A characteristic absorption peak was obtained for caffeine in PPG–PEG–PPG medium at the wavelength 274 nm. A calibration was done using increasing concentrations of a 1 mM solution of caffeine in the polymer medium. 0.1 mL of 1 mM solution of caffeine was taken in the ABSs at different pHs of the salt rich phase and extractions were performed in the usual way as described earlier. The polymer rich phase was separated and analyzed for its absorbance. The percent extraction was calculated as before using eqn (3).
Molecular interaction studies of caffeine with the vitamins
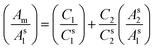
(a) Absorption spectroscopy. We investigated the extraction of vitamins in presence caffeine in our newly designed PPG–PEG–PPG/sodium citrate aqueous biphasic system using absorption spectroscopic methods. From the absorbance values we calculated the percentage extraction of the vitamins and caffeine individually. Since thiamine and riboflavin has different positions of λmax with respect to caffeine there was no spectral overlap and we found that both the vitamins were exclusively extracted in the polymer rich phase in presence of caffeine. Hence caffeine has no influence on the extraction of water soluble vitamin in ABS. However, we found a spectral overlap of cholecalciferol and caffeine since the wavelengths of absorption maxima of these two are at 280 nm and 274 nm respectively. We resolved the spectrophotometric estimation of the two components using multi-wavelength linear regression analysis by using the following equation:32| |
 | (4) |
where As1, As2 are the standard solutions of the pure components of molar concentrations Cs1 and Cs2 and Am is the absorbance of the mixture. From the plot of (Am/As1) vs. (As2/As1), individual component concentrations in the mixture were obtained.
(b) Fluorescence spectroscopy. The interaction of the vitamins with caffeine in the polymer medium was further supported by the fluorescence quenching studies. In a pure polymer solution, the vitamins were added and fluorescence intensity was measured, then caffeine was added in increasing concentrations and the resulting intensities were recorded. The type of fluorescence quenching of the vitamins in presence of caffeine was determined by the Stern–Volmer equation:where, F0 is the fluorescence intensity of the vitamin and F is the quenched intensity in presence of caffeine, Q is the concentration of the quencher and KSV is the Stern–Volmer constant.
(c) Confocal microscopy. For confocal microscopy, the aqueous solutions of the three vitamins and caffeine extracted in polymer rich phase of the ABS were spiked with a small volume of fluorescein solution prepared in methanol. A drop of this solution was placed on a glass slide with a cover-slip and observed under the confocal microscope and the images were recorded.
(d) NMR studies. To study the molecular interaction of caffeine with cholecalciferol, 1H NMR spectra of the individual samples were taken. 5 mg samples of caffeine, cholecalciferol and a mixture of the two biomolecules were dissolved in 0.6 mL of D2O solvent and chemical shifts were noted in a 300 MHz NMR spectrometer.
(e) ESI MS studies. Both caffeine and cholecalciferol were dissolved in MS grade water in the concentration range ∼10−6 μM to detect their base peaks and molecular fragmentation in ESI-MS study. All the spectra were recorded in the positive mode and the scan time were recorded in the m/z range 100–1200 Da.
Result and discussion
Phase diagram and the tie-lines
The phase diagram is a blueprint to determine the active working area of a particular aqueous two phase system. The best suitable concentrations of the two phase forming components that lead to equal separation can only be obtained from the phase diagram at a particular temperature and this is very important to ascertain preliminary partitioning. By joining the data points obtained from the titration procedure a binodal curve is generated, which separates a zone of component concentrations that will form two immiscible aqueous phases on mixing (the region above the curve) from those that will form a homogenous single phase (the region below the curve). The phase diagrams of the PPG–PEG–PPG/sodium acetate and PPG–PEG–PPG/sodium citrate systems were obtained at 303 K and the details of final compositions are tabulated in Table 1. The system compositions represent the mass fractions of the individual components at the beginning, i.e., before the addition of water during turbidometric titrations. Similarly, final compositions represent the mass fractions at the point of disappearance of the two phase i.e., at the end point of turbidometric titration.33
Table 1 Experimental (liquid + liquid) equilibrium mass fractions (binodal curve data) for the systems salt (x1) + PPG–PEG–PPG (x2) in water at temperature T = 303 ± 0.5 K, pressure p = 0.1 MPaa
| Final composition of sodium acetate + PPG–PEG–PPG |
Final composition of sodium citrate + PPG–PEG–PPG |
| x1 |
x2 |
x1 |
x2 |
| Standard uncertainties u are u(T) = 0.5 K, u(p) = 10 kPa, u(x) = 0.01. |
| 11.32 |
45.98 |
7.34 |
24.04 |
| 12.37 |
43.26 |
7.70 |
21.65 |
| 13.52 |
39.74 |
7.90 |
19.70 |
| 14.58 |
37.01 |
8.16 |
18.40 |
| 15.75 |
34.73 |
8.32 |
16.99 |
| 16.90 |
32.48 |
8.74 |
15.40 |
| 17.97 |
30.19 |
9.19 |
14.06 |
| 19.13 |
28.12 |
9.75 |
13.01 |
| 19.91 |
25.51 |
10.16 |
11.85 |
| 20.84 |
23.42 |
10.72 |
10.63 |
| 21.93 |
21.49 |
11.22 |
9.56 |
| 23.02 |
19.49 |
11.65 |
8.61 |
| 23.74 |
17.44 |
12.01 |
8.16 |
| 24.85 |
15.65 |
12.47 |
7.37 |
| 26.18 |
13.99 |
13.07 |
6.69 |
| 27.57 |
12.43 |
13.56 |
6.49 |
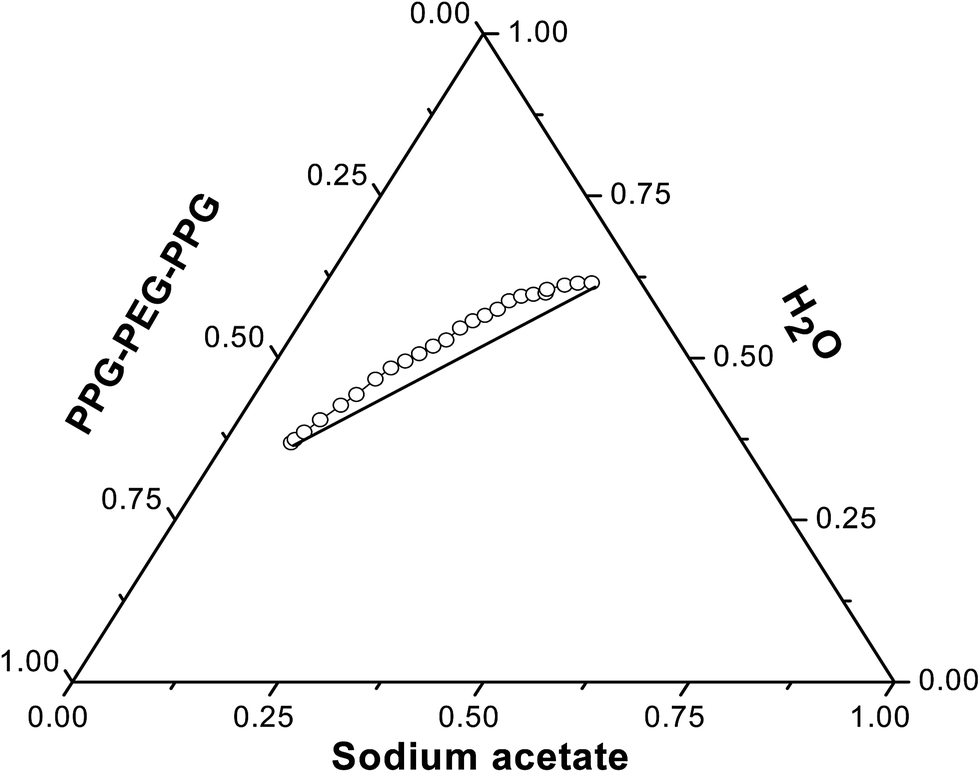
The ternary phase diagrams of PPG–PEG–PPG + water + sodium acetate and PPG–PEG–PPG + water + sodium citrate along with suitable tie lines are shown in Fig. 1 and 2 respectively. Tie-lines are obtained by joining two nodes on the binodal curve. Each point on the tie line represents the final concentrations of the phase forming components in the top and bottom phases. With increasing tie line length the polymer concentration in the top phase increases and the bottom phase becomes richer in salt. All the tie line lengths were calculated using eqn (S1)–(S4)† and are presented in Tables 2 and 3 for PPG–PEG–PPG/Na-acetate and PPG–PEG–PPG/sodium citrate systems respectively. Fitting parameters, A, B, C and R2 values are given in Table 4.
 |
| | Fig. 1 Ternary phase diagram with a suitable tie line for water–PPG–PEG–PPG–sodium acetate system drawn at 303 ± 0.5 K. Weight fractions of sodium acetate, water and PPG–PEG–PPG are shown in the three coordinates. | |
 |
| | Fig. 2 Ternary phase diagram with a suitable tie line for water–PPG–PEG–PPG–sodium citrate system drawn at 303 ± 0.5 K. Weight fractions of sodium citrate, water and PPG–PEG–PPG are shown in the three coordinates. | |
Table 2 Experimental (liquid + liquid) equilibrium data for the system sodium acetate (x1) + PPG–PEG–PPG (x2) in water for mass fractions and tie-line length (TLL) at the temperature T = 303 ± 0.5 K, pressure p = 0.1 MPaa
| Feed composition |
Top phase |
Bottom phase |
TLL |
STL |
| x1 |
x2 |
x1 |
x2 |
x1 |
x2 |
| Standard uncertainties u are u(T) = 0.5 K, u(x) = 0.01, u(p) = 10 kPa. |
| 20.75 |
29.51 |
6.05 |
54.93 |
32.37 |
8.15 |
54.55 |
−2.02 |
| 19.12 |
31.89 |
7.73 |
54.19 |
30.75 |
8.38 |
51.56 |
−2.07 |
| 17.69 |
34.00 |
9.47 |
52.50 |
29.29 |
8.93 |
47.60 |
−2.11 |
| 16.30 |
35.94 |
11.95 |
49.61 |
27.47 |
9.93 |
41.54 |
−2.14 |
Table 3 Experimental (liquid + liquid) equilibrium data for the system sodium citrate (x1) + PPG–PEG–PPG (x2) in water for mass fractions and tie-line length (TLL) at the temperature T = 303 ± 0.5 K, pressure p = 0.1 MPaa
| Feed composition |
Top phase |
Bottom phase |
TLL |
STL |
| x1 |
x2 |
x1 |
x2 |
x1 |
x2 |
| Standard uncertainties u are u(T) = 0.5 K, u(x) = 0.01, u(p) = 10 kPa. |
| 20.59 |
30 |
2.15 |
63.83 |
36.93 |
0.00005 |
72.69 |
−1.83 |
| 19.21 |
32 |
2.14 |
64.00 |
36.28 |
0.00009 |
72.53 |
−1.87 |
| 17.84 |
34 |
2.11 |
64.51 |
36.36 |
0.00020 |
73.04 |
−1.88 |
| 16.47 |
36 |
2.17 |
63.49 |
35.20 |
0.00023 |
71.57 |
−1.92 |
Table 4 Fitting parameters of the binodal curves and Othmer–Tobias and Bancroft equations
| System parameters |
Sodium acetate + PPG–PEG–PPG |
Sodium citrate + PPG–PEG–PPG |
| A |
125.716 |
225.623 |
| B |
−0.28196 |
−0.85969 |
| C |
4.2173 × 10⁻⁵ |
1.995 × 10⁻⁴ |
| R2 |
0.997 |
0.998 |
| n |
0.660 |
0.576 |
| K1 |
0.65 |
1.28 |
| r |
0.696 |
1.350 |
| K2 |
1.64 |
0.76 |
| R12 |
0.982 |
0.993 |
| R22 |
0.940 |
0.997 |
As evident from Fig. 3, the change of the anion produced an evident modification in the phase diagram. PPG–PEG–PPG/sodium citrate system shows higher heterogeneous region than the PPG–PEG–PPG/Na-acetate system. This means that a lower concentration of citrate is required to obtain the ABS than the acetate salt. So, citrates are more effective than acetates in formation of this block copolymer based ABS. The tendency of the anions to induce the formation of ABS is closely connected to the position of the anion in the Hofmeister series.34 Trivalent anion citrate competes more strongly for water, so the salting-out of the polymer will be facilitated. This behavior can be explained also from the ΔGhyd values of the anions. The extent of ionic species hydration (ΔGhyd) depends upon the valence of the ion. In general, the ΔGhyd is more negative for the anions with a high charge density. It was observed that the higher the valence of the anion, the lower the concentration required for obtaining a biphasic system.35 The more negative ΔGhyd value for citrate indicates that this anion has a larger hydration shell and consequently the salting-out of the block copolymer is achieved using a lower salt concentration.
 |
| | Fig. 3 Phase diagrams of the PPG–PEG–PPG block copolymer ABS at 303 ± 0.5 K against sodium acetate and sodium citrate salt rich phase showing the effect of anions. | |
The tie-line compositions were fit to equations given by Othmer–Tobias, eqn (6) and Bancroft equation, eqn (7):36
| |
 | (6) |
| |
 | (7) |
where
Wt1 is the mass fraction of PPG–PEG–PPEG in the top phase;
Wb2 is the mass fraction of the salt in the bottom phase;
Wb3 and
Wt3 are the mass fractions of water in the salt rich phase and polymer rich phases, respectively.
K1,
n,
K2 and
r are the fitting parameters. Linearized form of log(1 −
Wt1)/
Wt1 against log(1 −
Wb2)/
Wb2 as well as log(
Wb3/
Wb2) against log(
Wt3/
Wt1) also indicate a good fitting property of the experimental results to
eqn (6) and
(7) as well as good reliability of the calculation method and the corresponding tie-line data. All the parameters were obtained from the respective Othmer Tobias plots shown in Fig. S1 and S3 and the Bancroft plots shown in Fig. S2 and S4
† respectively. The fitting parameters are given in
Table 4.
Aggregation number
Aggregation number portrays the number of molecules present in a micelle once the critical micelle concentration (CMC) has been reached. The solution of the block copolymer is also reported to show fluorescence emission upon excitation at 300 nm which arise out of micellar aggregations in the polymer solution after a certain concentration (CMC).30 We have calculated the aggregation number of the pristine polymer solution (30% v/v) and the polymer rich phases (the top phase) collected from the two biphasic systems. The fluorescence spectral changes and the lnI0/I vs. Cq plots are shown in Fig. S5–S10.† Fig. S5, S7 and S9† show the fluorescence quenching of block copolymer, PPG–PEG–PPG solution in different conditions in presence of K2Cr2O7. The aggregation numbers were found to increase from 27 to 30 and 40 in the polymer solutions collected from the top phase of the biphasic systems from acetate and citrate respectively than the pristine polymer solutions. This result may be attributed to the increased hydrophobicity of the polymer due to salt out inducing capacity of the salts and hence the increase in number of molecules in the micelles. It is also a supporting fact in favor of enhanced extraction behavior in aqueous biphasic systems over monophasic extractions in micellar medium of the polymer. Due to the micellar growth in ABS, extraction capability as well as solubilization capacity of the polymer increases and it would be capable of extracting larger biomolecules.
Extraction of vitamins in the ABS
Polymers are capable of dissolving large scale of water soluble and/insoluble molecules owing to their amphiphilic behavior. Thiamine (vitamin B1) and riboflavin (vitamin B2) are water soluble vitamins whereas cholecalciferol (vitamin D3) is fat soluble. The characteristic absorption spectra of the vitamins in block copolymer medium are shown in Fig. S11–S13.† We performed the extraction study of thiamine, riboflavin and cholecalciferol using our newly designed PPG–PEG–PPG based aqueous two phase system (PPG–PEG–PPG + sodium acetate/sodium citrate). After phase separation, UV-visible spectra of both the phases were taken. We found that both water soluble thiamine, riboflavin and fat soluble cholecalciferol were exclusively extracted (100%) in PPG–PEG–PPG rich phase at all the pHs of the two organic salt solutions. So type of salt and pH has no effect on the extraction profile of these vitamins. The percentage extractions of the vitamins in the PPG–PEG–PPG rich phase were calculated using suitable calibration curves. The extraction of vitamins may be attributed to the specific hydrophilic interaction of the large water soluble vitamin B-complexes, thiamine and riboflavin with the polymer. The reverse effect i.e. hydrophobic interaction of fat soluble cholecalciferol with the hydrophobic chain of the polymer is responsible for the purpose.
Extraction of caffeine in the ABS
Caffeine, an alkaloid of the methylxanthine family, 1,3,7-trimethylxanthine, forms complex formulations, such as those composed of caffeine and fatty acids which increases its insecticide activity due to the hydrogen-bonding between the carboxylic acid and the caffeine imidazole ring.17 We therefore studied the extraction of caffeine in the developed ABS and found that it is exclusively (100%) extracted in the PPG–PEG–PPG rich phase at all the different pHs of both the salt rich phases. The characteristic absorption spectrum for caffeine is shown in Fig. S14.† Caffeine showed a preference for the top phase (polymer rich phase) due to strong micellar interaction with the block copolymer. Evidences of molecular interactions of caffeine with other biomolecules prompted us to study the extraction of the vitamins in presence of caffeine, all of which otherwise show quantitative extractions in the polymer rich phase. This was done to anticipate probable molecular interactions between caffeine and the vitamins which were expected to show alterations in their extraction patterns in the ABS.
Molecular interaction studies of caffeine with the vitamins
(a) Absorption spectroscopy. In contrast to the water soluble vitamins, a profound effect on the extraction of vitamin D was observed in presence of caffeine (Fig. 4). The results of multi-wavelength linear regression analysis shows that vitamin D extraction diminishes to below 10% at pH 5 in presence of caffeine and that of caffeine itself falls to ∼60%. At higher pHs, the extraction of vitamin D slightly increases though that of caffeine falls to even lower values. Overall, there is a prominent loss in the extraction of both the components to the polymer rich phase. The reasons could be attributed to molecular interactions between the two concerned species. We therefore tried to establish this mere indication of the possible interactions using different techniques described in the following sections. The multi wavelength linear regression plots at different pHs are shown in Fig. S15–S19.†
 |
| | Fig. 4 Extraction profile of vitamin D in presence of caffeine in PPG–PEG–PPG/citrate ABS with varying pH of the salt rich phase. | |
(b) Fluorescence spectroscopy. Cholecalciferol has a characteristic fluorescence emission wavelength at 441 nm (λex = 280 nm), whose intensity decreases regularly with addition of increasing concentration of caffeine (Fig. 5). The Stern Volmer plot indicates the nature of interaction of caffeine with cholecalciferol (Fig. 6). The curved nature of the plot suggests both ground state and excited state interactions. The association constant (Ka) and quenching constant (Kq) was calculated by using the modified Stern–Volmer equation:37| | |
(F0/F − 1)/Q = Ka + Kqτ0 + KaKqτ0Q
| (8) |
where τ0 is the average lifetime of cholecalciferol solution. A plot of (F0/F − 1)/Q vs. Q will give a straight line from where Ka and Kq can be calculated. The values are tabulated in Table 5.
 |
| | Fig. 5 Fluorescence quenching plot of vitamin D with increasing concentrations of caffeine (λex = 280 nm). | |
 |
| | Fig. 6 Stern Volmer plot of fluorescence interactions of vitamin D with caffeine. | |
Table 5 Association and quenching constant values
| τ0 |
Ka |
Kq |
| 1.85 ns |
1.63 × 10² M−1 |
2.03 × 10⁹ M−1 s−1 |
(c) Confocal microscopy. Fluorescein being an organic molecule prefers to accumulate at the amphiphilic micellar centres of the polymer containing solutions. Hence it can be thought of as a coloring agent to see the actual micellar aggregation under the confocal microscope. The fact that the size of polymeric aggregations is affected due to intermolecular association and subsequent encapsulation can be prominently visualized from the confocal microscopic images (Fig. 7a–e). The micellar aggregations size upto 20 ± 5 μm in 30% v/v solutions of PPG–PEG–PPG taken from ABS. The size remains unaltered upon extraction of thiamine/riboflavin/cholecalciferol/caffeine individually. However, when a mixture of cholecalciferol and caffeine is extracted, there is a large enhancement in the micellar size. The length of the aggregation increases to ∼125 μm together with a subtle increase in the width also. This observation indicates that the ensuing molecular interactions can change the associated chemical environment and the organization of the medium.
 |
| | Fig. 7 Confocal microscopic image of (a) 30% v/v solution of PPG–PEG–PPG. (b) 30% v/v solution of PPG–PEG–PPG treated with thiamine. (c) 30% v/v solution of PPG–PEG–PPG treated with riboflavin (d) 30% v/v solution of PPG–PEG–PPG treated with vitamin D (e) 30% v/v solution of PPG–PEG–PPG treated with vitamin D and caffeine. | |
(d) NMR. Intermolecular interactions between different biomolecules had been reported in the literature using various sophisticated techniques, NMR being one of them. Study of the literature, particularly a review based on the NMR studies of interaction of proteins and polypeptides in vesicular medium,38 highlights the molecular movements in the membrane bound environment of vesicles. The interacting molecules show changes in the chemical shift and respond to the NMR timescale. In such cases, the movement of the vesicles coupled with the interacting molecules' mobility makes the detection of sharp resonances under liquid NMR conditions possible. In this particular case, the absorption and emission spectral changes due to intermolecular interactions become prominent in micellar medium. In our study, NMR was taken in D2O solution which shows small changes in the chemical shift indicating possible intermolecular interactions.
1H NMR (300 MHz, D2O) caffeine. The molecular interactions between caffeine and cholecalciferol were further justified by 1H NMR spectra. A small but sharp peak at 7.59 ppm arises due to the single aromatic H. Three sets of methyl protons (all as singlets) attached with the nitrogen atoms appear at δ values 3.61, 3.14 and 2.97 ppm respectively. The methyl protons attached to N1 is most deshielded due to the electron-withdrawing effect of the two adjacent carbonyl groups as compared to N2 and N3 methyl protons. The methyl protons linked with N2 is attached with one adjacent keto group compared to the N3 methyl. These effects are very well reflected in their consecutive chemical shift positions in the NMR spectrum (Fig. S20a,† nitrogens being numbered as 1, 2 and 3 for convenience).
1H NMR (300 MHz, D2O) cholecalciferol. The olefinic proton attached to C1 is the most deshielded with δ value 4.94 (J = 3.6 Hz). The olefinic proton attached to C2 appears next with δ value 4.38 (J = 7.8 Hz). The chemical shift for the ![[double bond, length as m-dash]](https://www.rsc.org/images/entities/char_e001.gif) CH2 protons attached to C3 appear at 4.17 (J = 7.8 Hz). A multiplet arises due to the aliphatic and ring protons present in the cholecalciferol molecule in the range 3.69–3.00 ppm (Fig. S20b,† carbon atoms being numbered as 1, 2 and 3 for convenience).
1H NMR (300 MHz, D2O) (caffeine + cholecalciferol). In agreement with the previous experiments, 1H NMR data also indicates that caffeine interacts with cholecalciferol. The changes in the δ values are more prominent for caffeine as compared to cholecalciferol after their intermolecular interactions. This is probably because of a higher polarity of the caffeine molecule owing to the presence of highly polar N atoms in it. All the four class of protons in the caffeine molecule including one aromatic and three methyl protons attached with the N atoms are deshielded. The change in the δ values corresponding to the aromatic proton and the methyl groups attached with N1, N2 and N3 are 0.01, 0.02, 0.03 and 0.03 ppm respectively clearly reflect a downfield shift of the overall caffeine protons which probably enters the paramagnetic deshielding field of the conjugated diene system of the cholecalciferol. The effect on cholecalciferol is however not observable in the NMR spectrum owing to its rigid structural integrity (Fig. S20c†).
CH2 protons attached to C3 appear at 4.17 (J = 7.8 Hz). A multiplet arises due to the aliphatic and ring protons present in the cholecalciferol molecule in the range 3.69–3.00 ppm (Fig. S20b,† carbon atoms being numbered as 1, 2 and 3 for convenience).
1H NMR (300 MHz, D2O) (caffeine + cholecalciferol). In agreement with the previous experiments, 1H NMR data also indicates that caffeine interacts with cholecalciferol. The changes in the δ values are more prominent for caffeine as compared to cholecalciferol after their intermolecular interactions. This is probably because of a higher polarity of the caffeine molecule owing to the presence of highly polar N atoms in it. All the four class of protons in the caffeine molecule including one aromatic and three methyl protons attached with the N atoms are deshielded. The change in the δ values corresponding to the aromatic proton and the methyl groups attached with N1, N2 and N3 are 0.01, 0.02, 0.03 and 0.03 ppm respectively clearly reflect a downfield shift of the overall caffeine protons which probably enters the paramagnetic deshielding field of the conjugated diene system of the cholecalciferol. The effect on cholecalciferol is however not observable in the NMR spectrum owing to its rigid structural integrity (Fig. S20c†).All the results agree with each other regarding the interactions. This further establishes that a small indication by a sophisticated instrumental method can be largely magnified if performed in micellar arrangement offered by the ABSs.
(e) ESI MS. The change in molecular fragmentation pattern resulting from the interactions of caffeine with cholecalciferol was qualitatively observed in ESI MS. The electrospray mass ionization spectrum of pure caffeine shows a prominent unperturbed mass peak at 195 Da which corresponds to the molecular mass of the caffeine itself (M + H). The cholecalciferol obtained from local pharmacy shows mass peaks at 365 Da and 362 Da which probably originate due to dehydration (M − H2O) and further dehydrogenation of the resulting species. Upon combination of the two chemical entities in aqueous medium, the individual peaks at 195 Da (from caffeine) and 362 and 365 Da (from cholecalciferol) appear in addition to a prominent peak at 533 Da. The base peak of cholecalciferol at 365 Da diminishes as compared to that of 362 Da in the mixture which is due to molecular interactions of the two species (Fig. S21a–c†). A loss of 27 Da from the combination (195 + 365) is due to a possible elimination of –NCH group from caffeine after interactions during the electrospray. The mass fragments of the three samples are tabulated in Table 6.
Table 6 The mass fragments of the interacting compounds as obtained from ESI MS
| Compound |
Mass (Da) |
| Cholecalciferol |
365, 362 |
| Caffeine |
195 |
| Cholecalciferol + caffeine |
365, 362, 195, 533 |
Conclusion
We have designed two new aqueous biphasic systems composed of a tri-block copolymer PPG–PEG–PPG vs. two organic salts sodium acetate and sodium citrate. These polymer–salt ABSs form sustainable media for analytical extractions and separation of important biomolecules as well as a platform to identify molecular interactions. The aggregation number of the pristine block copolymer solution and the polymer rich phase separated from ABS were determined by fluorescence quenching method. In presence of salts, the top phase becomes more concentrated resulting in higher micellar aggregation of the polymer rich phase. The polymer rich phase was found to be an efficient medium for the extractions of three different vitamins thiamine, riboflavin, cholecalciferol and the biomolecule caffeine. Caffeine affects the aqueous biphasic extraction behavior of cholecalciferol in polymer rich phase. This may be due to a chemical interaction between caffeine and cholecalciferol. Decrease in fluorescence intensity of cholecalciferol on addition of gradually increasing concentration of caffeine suggests an association of these two molecules. The results are in agreement with the results of confocal microscopy, ESI-MS and NMR spectral studies which also provide evidences in favor of intermolecular interactions between the two species.
Acknowledgements
We gratefully acknowledge Department of Science and Technology (Fast Track Sanction No. SR/FT/CS-105/2011) for funding. One of the authors, AC thanks DST Fast Track for providing necessary fellowship. We are also thankful to Dr Aupam Banerjee (Leica) for obtaining confocal microscopic images.
References
- M. L. Moody, H. D. Willauer, S. T. Griffin, J. G. Huddleston and R. D. Rogers, Ind. Eng. Chem. Res., 2005, 44, 3749–3760 CrossRef CAS.
- O. Rodrıguez, S. C. Silverio, P. P. Madeira, J. A. Teixeira and E. A. Macedo, Ind. Eng. Chem. Res., 2007, 46, 8199–8204 CrossRef.
- F. J. Deive, A. Rodrıguez, A. B. Pereiro, J. M. M. Araujo, M. A. Longo, M. A. Z. Coelho, J. N. C. Lopes, J. M. S. S. Esperanc, L. P. N. Rebelo and I. M. Marrucho, Green Chem., 2011, 13, 390–396 RSC.
- J. Chen, Y. Wang, Q. Zeng, X. Ding and Y. Huang, Anal. Methods, 2014, 6, 4067–4076 RSC.
- H. Walter, D. E. Brooks and D. Fisher, Partitioning in aqueous two phase systems, Academic Press, Orlando, FL, 1985 Search PubMed.
- Partition of cell particles and macromolecules, ed. P. Å. Albertsson, John Wiley & Sons Inc., New York, 1971 Search PubMed.
- H. Walter, D. E. Brooks and D. Fisher, Partitioning in Aqueous Two-Phase Systems: Theory, Methods, Use, and Applications to Biotechnology, Academic Press, Orlando, FL, 1985 Search PubMed.
- S. Vidovic, B. Stojanovic, J. Veljkovic, L. Prazi-Arsic, G. Roglic and D. Manojlovic, J. Chromatogr. A, 2008, 1202, 155–162 CrossRef CAS PubMed.
- J. Du, Y. Li and J. Lu, Talanta, 2002, 57, 661–665 CrossRef CAS PubMed.
- S. M. Mandal, M. Mandal, A. K. Ghosh and S. Dey, Anal. Chim. Acta, 2009, 640, 110–113 CrossRef CAS PubMed.
- J. Moon, J. Am. Coll. Nutr., 1994, 13, 559–564 CrossRef CAS PubMed.
- A. B. Tabrizi, Bull. Korean Chem. Soc., 2006, 27, 1604–1608 CrossRef CAS.
- S. Shiri, T. Khezeli, M. Avazpour, S. Sajjadifar, A. Abbasi and A. Delpisheh, J. Chem., 2013, 2013, 1–5 Search PubMed.
- M. D. Pérez, L. I. N. Tomé, M. G. Freire, I. M. Marrucho, O. Cabezaa and J. A. P. Coutinho, Sep. Purif. Technol., 2010, 72, 85–91 CrossRef.
- M. D. A. Saldan, R. S. Mohamed, M. G. Baer and P. Mazzafera, J. Agric. Food Chem., 1999, 47, 3804–3808 CrossRef.
- M. M. Paradkara and J. Irudayaraj, Food Chem., 2002, 78, 261–266 CrossRef.
- M. G. Freire, A. R. R. Teles, J. N. C. Lopes, L. P. N. Rebelo, I. M. Marrucho and J. A. P. Coutinho, Sep. Sci. Technol., 2012, 47, 284–291 CrossRef CAS.
- M. G. Freire, L. P. N. Rebelo, C. M. S. S. Neves, J. A. P. Coutinho, I. M. Marrucho and J. N. C. Lopes, Green Chem., 2010, 12, 1715–1718 RSC.
- E. Nuin, M. C. Jimenez, G. Sastre, I. Andreu and M. A. Miranda, J. Phys. Chem. Lett., 2013, 4, 1603–1607 CrossRef CAS PubMed.
- G. A. Block, D. Zaun, D. Smits, M. Persky, S. Brillhart, K. Nieman, J. Liu and W. L. St. Peter, Kidney Int., 2010, 78, 578–589 CrossRef CAS PubMed.
- F. Yang, J. Yue, L. Ma, Z. Ma, M. Li, X. Wu and H. Liang, Mol. Pharmaceutics, 2012, 9, 3259–3265 CrossRef CAS PubMed.
- M. Ravera, E. Gabano, S. Baracco and D. Osella, Inorg. Chim. Acta, 2009, 362, 1303–1306 CrossRef CAS.
- C. Lu, H. Li, H. Wang and Z. Li, Anal. Chem., 2013, 85, 2361–2369 CrossRef CAS PubMed.
- M. Sorci, B. Dassa, H. Liu, G. Anand, A. K. Dutta, S. Pietrokovski, M. Belfort and G. Belfort, Anal. Chem., 2013, 85, 6080–6088 CrossRef CAS PubMed.
- A. Chakraborty and K. Sen, RSC Adv., 2014, 4, 64328–64335 RSC.
- A. Chakraborty and K. Sen, J. Chem. Eng. Data, 2014, 59, 1288–1294 CrossRef CAS.
- J. C. Merchuk, B. A. Andrews and J. A. Asenjo, J. Chromatogr. B: Biomed. Sci. Appl., 1998, 711, 285–293 CrossRef CAS.
- K. E. Gutowski, G. A. Broker, H. D. Willaver, J. G. Huddleston, R. P. Swatloski, J. D. Holbery and R. D. Rogers, J. Am. Chem. Soc., 2003, 125, 6632–6633 CrossRef CAS PubMed.
- X. Wang, X. Wei, J. Liu, D. Sun, P. Du and A. Ping, Fluid Phase Equilib., 2013, 347, 1–7 CrossRef.
- P. Samaddar, A. Chakraborty and K. Sen, RSC Adv., 2015, 5, 44204–44210 RSC.
- S. P. Paik, S. K. Ghatak, D. Dey and K. Sen, Anal. Chem., 2012, 84, 7555–7561 CrossRef CAS PubMed.
- G. N. Mukherjee, Advanced experiments in Inorganic Chemistry, U. N. Dhur & Sons Pvt. Ltd., 2010 Search PubMed.
- R. Hatti-Kaul, Methods in Biotechnology: Aqueous Two Phase Systems, Methods and Protocol, Humana Press, Totowa New Jersey, 2000, vol. 11 Search PubMed.
- S. Shahriari, C. M. S. S. Neves, M. G. Freire and J. A. P. Coutinho, J. Phys. Chem. B, 2012, 116, 7252–7258 CrossRef CAS PubMed.
- K. P. Ananthapadmanabhan and E. D. Goddard, Langmuir, 1987, 3, 25–31 CrossRef CAS.
- M. T. Zafarani-Moattar and D. Nikjoo, J. Chem. Eng. Data, 2008, 53, 2666–2670 CrossRef CAS.
- K. Sen and P. Samaddar, J. Mol. Liq., 2014, 200, 369–373 CrossRef CAS.
- G. D. Costa, L. Mouret, S. Chevance, E. L. Rumeur and A. Bondon, Eur. Biophys. J., 2007, 36, 933–942 CrossRef PubMed.
Footnote |
| † Electronic supplementary information (ESI) available. See DOI: 10.1039/c6ra16957k |
|
| This journal is © The Royal Society of Chemistry 2016 |
Click here to see how this site uses Cookies. View our privacy policy here.