DOI:
10.1039/C6RA16941D
(Paper)
RSC Adv., 2016,
6, 85173-85181
Synthesis of Ag–Ag2S Janus nanoparticles supported on an environmentally benign cellulose template and their catalytic applications†
Received
1st July 2016
, Accepted 1st September 2016
First published on 1st September 2016
Abstract
Synthesis of Ag–Ag2S Janus nanoparticles (JNP) by a one step co-precipitation technique using a NaOH–thiourea–urea aqueous solution has been reported. The NaOH in cellulose solution acted as the precipitant of Ag–Ag2S nanoparticles and environmentally benign cellulose was used as a template to promote the growth of nanoparticles. The cellulose was extracted from Bambusa tulda, a locally available bamboo species and was carried out by adopting a green approach using a combination of both chemical and biochemical treatment. The synthesized Ag–Ag2S JNP was characterized by UV-Visible spectroscopy, powder XRD, TEM, SEM-EDX and XPS analysis. The TEM study reveals that most of the Ag–Ag2S JNP were spherical in shape and fall in the size range of 10–15 nm. XRD analysis of the Ag–Ag2S JNP shows diffraction peaks for the (111), (200) and (220) planes of a face centered cubic Ag0 crystal along with the characteristic peaks due to Ag2S, which provide evidence for the coexistence of Ag2S and Ag on the cellulose support. The method offers a facile and green pathway for the fabrication of Ag–Ag2S JNP and the synthesized Ag–Ag2S JNP were employed as a heterogeneous catalyst in a model reaction based on the reduction of p-nitrophenol to p-aminophenol. The metal nanocatalysts could be recycled and reused several times without significant loss of their catalytic activities.
1. Introduction
In recent years, the synthesis of Janus nanoparticles (JNP) with two or more different functional nanoparticles contacting thoroughly have attracted great research interest due to their novel properties that are not present in the individual component nanoparticles.1–5 The electrons are restricted to the nanometer range within the support in single component nanoparticles, whereas, for JNP, two or more different component nanoparticles inter-grow in the same support thereby allowing electron transfer across the interface between two nano-components which imparts drastic property changes.1–8 Due to the coexistence of two or more individual material phases in a single JNP, lot of attempts were made to synthesize JNP that combine two or more different properties in order to fabricate new composite materials with promising applications. There are several reports for fabrication of these novel functional materials such as Au–CoPt3,9 Au–CdSe,5 Au–Fe3O4,10 Au–PbS,11 Au–PbSe,12 Au–ZnO,13 Au–Cu2S,14 Fe–Pt–CdS,15 FePt–PbS/PbSe,16 Au–Ag2S![[thin space (1/6-em)]](https://www.rsc.org/images/entities/char_2009.gif) 17,18 and Ag–Ag2S7,19,20 due to their well known remarkable optical, electrical, magnetic and catalytic properties. Among these JNP, less attention have been paid towards the fabrication of JNP of noble metal like Ag–Ag2S, although Ag–Ag2S JNP has promising future applications including nanoscale-optoelectronics, sensors, catalysis and other medical devices.19,20 Since noble metals (e.g. gold and silver) are well known for their intrinsic properties like stability, imaging, therapeutic and catalytic ability, they have wide range of applications in the field of sensors, magnetic devices, optoelectronics, information storage, catalytic and biomedical engineering.21–26 These intrinsic properties are dictated by their size, shape, composition and crystallinity. Considerable afford have been devoted for size and shape controlled synthesis of individual Ag0 and Ag2S nanoparticles for their significant applications in different fields such as number of commercially available optical and electronic devices, surface enhanced Raman spectroscopy, catalysis, biological labelling and imaging etc.21–28 Keeping in view of these excellent characteristics and good chemical stability shown from individual Ag0 and Ag2S nanomaterials, it is highly obligatory to explore a facile and rational fabrication of Ag–Ag2S JNP using environmentally benign support. Jiang et al. used TiO2 to synthesize Ag–Ag2S Janus coupled P25 TiO2 composites,7 Pang et al. synthesized Ag–Ag2S JNP in which CuS hollow sphere converted from monodisperse Cu2O solid spheres through a modified Kirkendall process.19 Although the fabrications of these nanocomposites are reported, most of it involves use of organic solvent and reducing agent such as NaBH4, elevated temperature and complicated multistep synthesis. Hence, with growing environmental regulations for the exploration of new research, development of green and sustainable synthetic methods alongwith the choice of suitable support for synthesis of metal nanoparticles are major challenge now a days.29–31 Keeping in view of the above, we used cellulose for fabrication of Ag–Ag2S JNP, owing to the fact that it is one of the most abundant and renewable biopolymers on earth. In this work, we report a procedure for synthesize of Ag–Ag2S JNP using environmentally benign cellulose as a support extracted from locally available bamboo species. Bambusa tulda which were collected from Jorhat, Assam, India, were cut in to 2–3 inch size chips then converted into crystalline cellulose under controlled chemical treatment followed by enzymatic treatment. This cellulose acts as a host for fabrication of Ag–Ag2S JNP and limit the growth of the particles upto the desired range. Furthermore, the potential applications of this Ag–Ag2S JNP were confirmed by investigating their catalytic activity.
17,18 and Ag–Ag2S7,19,20 due to their well known remarkable optical, electrical, magnetic and catalytic properties. Among these JNP, less attention have been paid towards the fabrication of JNP of noble metal like Ag–Ag2S, although Ag–Ag2S JNP has promising future applications including nanoscale-optoelectronics, sensors, catalysis and other medical devices.19,20 Since noble metals (e.g. gold and silver) are well known for their intrinsic properties like stability, imaging, therapeutic and catalytic ability, they have wide range of applications in the field of sensors, magnetic devices, optoelectronics, information storage, catalytic and biomedical engineering.21–26 These intrinsic properties are dictated by their size, shape, composition and crystallinity. Considerable afford have been devoted for size and shape controlled synthesis of individual Ag0 and Ag2S nanoparticles for their significant applications in different fields such as number of commercially available optical and electronic devices, surface enhanced Raman spectroscopy, catalysis, biological labelling and imaging etc.21–28 Keeping in view of these excellent characteristics and good chemical stability shown from individual Ag0 and Ag2S nanomaterials, it is highly obligatory to explore a facile and rational fabrication of Ag–Ag2S JNP using environmentally benign support. Jiang et al. used TiO2 to synthesize Ag–Ag2S Janus coupled P25 TiO2 composites,7 Pang et al. synthesized Ag–Ag2S JNP in which CuS hollow sphere converted from monodisperse Cu2O solid spheres through a modified Kirkendall process.19 Although the fabrications of these nanocomposites are reported, most of it involves use of organic solvent and reducing agent such as NaBH4, elevated temperature and complicated multistep synthesis. Hence, with growing environmental regulations for the exploration of new research, development of green and sustainable synthetic methods alongwith the choice of suitable support for synthesis of metal nanoparticles are major challenge now a days.29–31 Keeping in view of the above, we used cellulose for fabrication of Ag–Ag2S JNP, owing to the fact that it is one of the most abundant and renewable biopolymers on earth. In this work, we report a procedure for synthesize of Ag–Ag2S JNP using environmentally benign cellulose as a support extracted from locally available bamboo species. Bambusa tulda which were collected from Jorhat, Assam, India, were cut in to 2–3 inch size chips then converted into crystalline cellulose under controlled chemical treatment followed by enzymatic treatment. This cellulose acts as a host for fabrication of Ag–Ag2S JNP and limit the growth of the particles upto the desired range. Furthermore, the potential applications of this Ag–Ag2S JNP were confirmed by investigating their catalytic activity.
The p-nitrophenol is one of the pollutants often presents in industrial effluents, while, the p-aminophenol is an important intermediate in the preparation of several analgesic and antipyretic drugs such acetanilide, paracetamol, phenacetin etc. p-aminophenol was also used as industrial intermediate for the synthesis of organic fine chemicals, such as dyes, herbicides, pesticides, photographic developer, corrosion inhibitor and anticorrosion-lubricant.31–34 Conventional industrial syntheses of p-aminophenol were carried out by the following methods: (a) from phenol by nitration followed by reduction using stoichiometric quantities of metal acid systems, (b) from p-chlorobenzene most commonly using multistep process.31–38 Both the routes have some serious drawbacks such as multistep synthesis, elaborate experimental set up, use of stoichiometric quantities of metal acid systems, formation of undesired product and poor yield. Due to change in scenario of the chemical industry for implementation of stringent and growing environmental regulations, development of efficient and ecofriendly reduction process are in demand. Therefore, the conventional process needs to be replaced by green catalytic hydrogenation route using metal nano catalyst instead of using stoichiometric quantities of metal acid systems. For this type of hydrogenation reaction, various metal nano catalysts (Ni, Pt, Pd, Ru, Rh, Au etc.) have been reported31–38 but, none of these methods have been found satisfactory and is still a lot of scope to enhance the catalytic performance by improving the reaction time, catalyst quantity, selectivity keeping in mind both the economic and environmental issues. Here, we have reported the simple and eco-friendly synthetic procedure for generation of Ag–Ag2S JNP using environmentally benign and cheap bamboo cellulose as support and their catalytic performance in hydrogenation of p-nitrophenol. The catalysts were recycled several times and found active without significant loss of catalytic efficiency. Literature survey reveals that synthesis of Ag–Ag2S JNP on cellulose support without using any reducing agent is reported for the first time and explored for hydrogenation of p-nitrophenol.
2. Experimental
2.1. Materials and methods
Bambusa tulda samples were procured from Jorhat, Assam, India and all the chemicals such as AgNO3, NaOH, urea, thiourea, p-nitrophenol etc. were purchased from Spectrochem, India and used without any purification. Proximate chemical constituents of bamboo were carried out using the analytical method as suggested by Technical Association of Pulp and Paper Industry (TAPPI, USA). For determination of chemical constituents, the bamboo samples were cut into size of 1.0 cm × 1.5 cm length, dried in oven for 6–8 h at 90 ± 5 °C and then powdered in a Wiley mill. The powdered fraction was screened with 40 and 60 BSS mesh and the fraction passed through 40 BSS mesh and retained on 60 BSS mesh (+40–60) was taken for different constitutional analysis. Cellulose and hemicelluloses contents were determined by a standard method of biochemical analysis by Thimmaiah.39 Kappa number, pulp viscosity and lignin content of bamboo samples were determined by TAPPI standard methods T-236 cm-85, T 230 om-89, T-222 om-02 respectively.
A number of methods have been reported for determination of degree of polymerization (DP) of pulp cellulose. A simplified approach of Morton, 1996 was followed to determine “degree of polymerization” (DP) using CED viscosity in the following relation:
| DP = 118.019 × [ln(CED)]2 + 598.404 × ln(CED) − 449.61 |
where CED is the cupriethylenediamine disperse viscosity of bamboo samples calculated using TAPPI standard method T 230 om-89.
40
IR spectra (4000–400 cm−1) were recorded on KBr discs in a Shimadzu IR Affinity-1 spectrophotometer. UV-Visible spectra were obtained at room temperature by the UV-Visible spectrophotometer model Lambda 35, Perkin Elmer. Powder X-ray diffraction were acquired on a Rigaku Ultima IV X-ray diffractometer from 2–80° 2θ using CuKα source (λ = 1.54056 Å). The program ‘XG operation RINT 2200’ associated with the XRD was used to process the diffractogram and the library database ‘Rigaku PDXL 1.2.0.1’ was used for identification of the peaks. The crystallinity index (CI) was calculated using eqn (1), where I002 is the maximum intensity of the I002 lattice reflection and I101 is the minimum intensity of X-ray scattering broad band, due to amorphous region of the sample.41
| | |
CI (%) = [1 − I101/I002] × 100
| (1) |
Scanning electron microscopy (SEM) images and energy dispersive X-ray spectroscopy (EDX) patterns were obtained by Leo 1430 vp operated at 3 and 10 kV on gold coated sample. Transmission electron microscopy (TEM) and high resolution transmission electron microscopy (HR-TEM) images were recorded on a JEOL JEM-2011 electron microscope and specimens were prepared by dispersing samples in isopropanol, placing them on a carbon coated copper grid and allowing them to dry. The TEM and HR-TEM micrographs were further developed by using the “Image J” program (software version 1.47) to calculate the size of the nanoparticles.42–44 XPS experiments were performed on a Kratos ESCA model Axis 165 spectrophotometer with a position sensitive detector and hemispherical energy analyzer in an ion pumped chamber.
2.2. Isolation of cellulose fibre from bamboo
Bamboo stem of 3–4 feet lengths were converted to chips (2–3 cm) using automatic chipping machine (Wood chipper, UEC, Saharanpur, India). The chips were pre treated with fungal broth (Penicillium meleagrinum) for 60 days having xylanase and laccase activity.45 The broth was prepared in malt extract under shake flask condition at 150 rpm, temp 30 °C, pH 5.5. The chips were sterilized in an autoclave, washed with cold fresh water and air dried. The enzyme treated chips were digested in a rotary digester (Laboratory Rotary Digestor, UEC, Saharanpur, India) using 8% NaOH at 170 ± 5 °C and at 20 kg pressure for 3 h at temperature maintaining the bath ratio at 1:5. After digestion, the pulp was washed with cold fresh water till the pulps were free from alkali. The pulp so obtained is designated as treated pulp.
Enzyme–H2O2 bleaching of pulp was conducted in two stage bleaching sequences. Initially bleaching was conducted using bacterial (Bacillus sps.) broth having xylanase activity (8.6 U ml−1) in a constant water bath at 50 °C for a reaction time of 2 h maintaining pH at 9. En-treated pulps were then bleached with 3% (g l−1) H2O2 solution at 60 °C maintaining pH at 9 for 1 h. After bleaching, the pulp was washed using cold fresh water and oven dried. The bleached pulp samples were then mercidized (a treatment of alkali),46 periodically washed with deionized water up to neutral pH and dried in an air oven at 50 ± 5 °C overnight to obtained the solid cellulose fibre.
2.3. Preparation of supported Ag–Ag2S JNP
Ag–Ag2S JNP stabilized by cellulose template was synthesized by following a slightly modified procedure reported by Yu and co-workers.47 A solution of NaOH–thiourea–urea–H2O of 8:6.5:8:77.5 by weight was taken into 250 ml round bottom flask and cooled to −12 °C. 2 g extracted cellulose was immediately added to the above solution under vigorous stirring condition for 5 min to form a cellulose solution. 0.5 g of AgNO3 was dissolved in minimum amount of distilled water and then added drop wise into the cellulose solution with vigorous stirring at room temperature. The reaction started immediately and colour changed from colorless to black within 30 min and the stirring was continued for another 2 h. The black color Ag–Ag2S JNP was filtered, washed sequentially with distilled water, ethanol and acetone and then dried by freeze drying.
2.4. Catalytic reduction of p-nitrophenol
The reduction of p-nitrophenol to p-aminophenol was used as a model reaction to evaluate the catalytic activity of Ag–Ag2S JNP. The catalytic reaction was set up in a standard quartz cuvette with 1 cm path length and 3 ml volume. In the first step, 0.3 ml of freshly prepared aqueous solution of NaBH4 (0.2 M) was introduced to the above quartz cuvette containing p-nitrophenol (3 ml, 0.1 mM) with stirring at room temperature. Immediately, the solution color changed from light yellow to yellow green. Next, 6 mg of Ag–Ag2S JNP was added to the above solution and the time-dependent absorption spectra were measured. The reaction was monitored by Perkin Elmer Lambda 35 spectrophotometer over a scanning range of 250–600 nm at room temperature. The rate constant of the reaction was measured by the extinction of the solution at ∼400 nm (absorption of p-nitrophenolate ion) as a function of time. To investigate the recyclability, the used catalyst was filtered after the reaction and washed with ethanol followed by water and finally vacuum dried at 40 °C before the next reaction run.
3. Results and discussion
3.1. Characterization of extracted cellulose
The chemical compositions of the raw bamboo and treated bamboo cellulose after each stage of the chemical treatment (treated pulp and extracted cellulose) are shown in Table 1. Chemical analysis of these fibres after each stage of extraction showed an increase in cellulose content and decline in hemicelluloses and lignin content. After chemical and microbial treatment, the extracted cellulose loses most of the noncellulosic constituents and at the end of the treatment (extracted cellulose) the cellulose content is increased from 57.2% to 91.2%, while hemicelluloses and lignin content are significantly decreased to 1.69% and 2.1% from 31.2% and 27.4% respectively. This may be due to substantial breakdown of lignocellulosic materials through partial hydrolysis of the hemicellulosic fraction of the fibres coupled with depolymerization of lignin components during bio-chemical treatment.48,49 FTIR spectroscopy was utilized to qualitatively determine the compositional changes in the fibre structure of raw bamboo, treated pulp and extracted cellulose [Fig. S1, see ESI†]. The prominent peak intensity located at ∼1735 cm−1 in raw bamboo is attributed to either the acetyl and uronic ester groups of hemicelluloses or the ester linkage of carboxylic group of the ferulic and p-coumaric acids of the lignin or hemicelluloses.50,51 After alkali treatment, partial disappearance of this peak is observed for treated pulp whereas it is completely absent in extracted cellulose after bleaching due to the removal of most of the hemicelluloses and lignin from the bamboo. The peaks at ∼1507 and ∼1436 cm−1 in the raw bamboo may be assigned for the aromatic C![[double bond, length as m-dash]](https://www.rsc.org/images/entities/char_e001.gif) C stretch of aromatic rings of lignin. The intensity of these peaks diminished in extracted cellulose, which is attributed to the removal of lignin to a certain extent.51 The bands in the region ∼1260–1056 cm−1 involve the C–O stretching vibrations of aliphatic primary and secondary alcohols in cellulose, hemicelluloses, lignin and extractives.52 The peak intensity at ∼1253 cm−1 is sharply weakened during extraction due to the removal of hemicelluloses material. The increase in intensity of the peak at ∼898 cm−1 due to β-glycosidic linkage of glucose ring of cellulose indicates the typical structure of cellulose. X-ray diffraction patterns of raw bamboo, treated pulp and extracted cellulose were carried out to investigate the crystallinity of the samples at different stages [Fig. 1]. X-ray diffractograms obtained for raw bamboo exhibit an amorphous nature observing a weak peak at 2θ = 21.3° for 002 plane and a broad hump. XRD analysis of treated pulp and extracted cellulose show two main peaks corresponding to the planes 101 and 002 at 2θ around 15.6° and 22.4° respectively, characteristic of the cellulose crystalline phase of the fibre.51 Crystallinity index (CI) was calculated and it is found 46.19% in case of raw bamboo whereas, it is recorded 53.10% and 67.38% for treated pulp and extracted cellulose respectively. The X-ray graph also shows that the peaks exhibited by extracted cellulose are more intense than untreated one (raw bamboo). During the chemical and enzymatic treatment, the cellulose chain breakage would occur in the amorphous region first. The amorphous regions in the cellulose chains are susceptible to chemical or enzyme penetration and degrade before the crystalline region. As a result, the structure has an increasing crystallinity throughout the treatment. This increase in CI can further substantiated by the lower value of kappa number, viscosity and degree of polymerization of extracted cellulose (12.6, 10.5 cP and 1610 respectively) after chemical treatment followed by microbial treatment, compared to treated pulp (2.1, 4.8 cP and 610 respectively) after chemical treatment [Table 1]. Fig. S2(A)–(F), [see ESI†] represents the SEM images of raw bamboo, treated pulp (enzyme pretreated soda pulps) and extracted cellulose. Fig. S2(A) and (B)† shows the SEM of raw bamboo culm in both low and high magnification revealing that there is a compact network of long fibers. These images visually suggest the intact binding of cementing materials (hemicelluloses, lignin & pectin) present in the fibers. The micrographs S2(C) and (D)† of treated pulp fiber shows defibrillization which has taken place during enzymatic and alkali treatment. More fibrils and longitudinal tearing on the fiber surface is observed due to dissolution of cementing materials mainly lignin & hemicelluloses. The compactness in fiber network was lost. SEM analysis of extracted cellulose S2(E) and (F)† depicts the total rupture of fiber due to three stage treatment-enzymatic followed by peroxide bleaching and finally mercidized.53 Non cellulosic polysaccharides have been rarely visible resulting in exposure of total cellulose fibers.
C stretch of aromatic rings of lignin. The intensity of these peaks diminished in extracted cellulose, which is attributed to the removal of lignin to a certain extent.51 The bands in the region ∼1260–1056 cm−1 involve the C–O stretching vibrations of aliphatic primary and secondary alcohols in cellulose, hemicelluloses, lignin and extractives.52 The peak intensity at ∼1253 cm−1 is sharply weakened during extraction due to the removal of hemicelluloses material. The increase in intensity of the peak at ∼898 cm−1 due to β-glycosidic linkage of glucose ring of cellulose indicates the typical structure of cellulose. X-ray diffraction patterns of raw bamboo, treated pulp and extracted cellulose were carried out to investigate the crystallinity of the samples at different stages [Fig. 1]. X-ray diffractograms obtained for raw bamboo exhibit an amorphous nature observing a weak peak at 2θ = 21.3° for 002 plane and a broad hump. XRD analysis of treated pulp and extracted cellulose show two main peaks corresponding to the planes 101 and 002 at 2θ around 15.6° and 22.4° respectively, characteristic of the cellulose crystalline phase of the fibre.51 Crystallinity index (CI) was calculated and it is found 46.19% in case of raw bamboo whereas, it is recorded 53.10% and 67.38% for treated pulp and extracted cellulose respectively. The X-ray graph also shows that the peaks exhibited by extracted cellulose are more intense than untreated one (raw bamboo). During the chemical and enzymatic treatment, the cellulose chain breakage would occur in the amorphous region first. The amorphous regions in the cellulose chains are susceptible to chemical or enzyme penetration and degrade before the crystalline region. As a result, the structure has an increasing crystallinity throughout the treatment. This increase in CI can further substantiated by the lower value of kappa number, viscosity and degree of polymerization of extracted cellulose (12.6, 10.5 cP and 1610 respectively) after chemical treatment followed by microbial treatment, compared to treated pulp (2.1, 4.8 cP and 610 respectively) after chemical treatment [Table 1]. Fig. S2(A)–(F), [see ESI†] represents the SEM images of raw bamboo, treated pulp (enzyme pretreated soda pulps) and extracted cellulose. Fig. S2(A) and (B)† shows the SEM of raw bamboo culm in both low and high magnification revealing that there is a compact network of long fibers. These images visually suggest the intact binding of cementing materials (hemicelluloses, lignin & pectin) present in the fibers. The micrographs S2(C) and (D)† of treated pulp fiber shows defibrillization which has taken place during enzymatic and alkali treatment. More fibrils and longitudinal tearing on the fiber surface is observed due to dissolution of cementing materials mainly lignin & hemicelluloses. The compactness in fiber network was lost. SEM analysis of extracted cellulose S2(E) and (F)† depicts the total rupture of fiber due to three stage treatment-enzymatic followed by peroxide bleaching and finally mercidized.53 Non cellulosic polysaccharides have been rarely visible resulting in exposure of total cellulose fibers.
Table 1 Comparison of chemical composition and physical properties of the cellulose fibre before and after treatment
| Samples name |
Cellulose (%) |
Hemicellulose (%) |
Lignin (%) |
Kappa number |
Viscosity (cP) |
Degree of polymerization |
| Raw bamboo |
57.2 |
31.2 |
27.4 |
15.8 |
|
|
| Treated pulp |
63.8 |
16.2 |
10.5 |
12.6 |
10.5 |
1610 |
| Extracted cellulose |
91.2 |
1.69 |
2.1 |
4.8 |
4.0 |
610 |
 |
| | Fig. 1 XRD pattern of raw bamboo, treated pulp and extracted cellulose. | |
3.2. Characterization of Ag–Ag2S JNP
The preliminary investigation on the formation of nanoparticles was carried out by solid state UV-Visible spectroscopy [Fig. 2]. After the formation of nanoparticles, the white color of cellulosic support darkened [inset in Fig. 2] with the appearance of the surface plasmon resonance (SPR) band at ∼400 nm (which was absent in the cellulosic support) indicating the SPR absorption of Ag0 consistent with previous report.20 The formation of Ag–Ag2S JNP on cellulose support is further characterized by X-ray diffraction (XRD) analysis as shown in Fig. 3. The XRD pattern of cellulose shows characteristics peak at 2θ value of 15.6° and 22.4° for 101 and 002 planes. The intensity of these two peaks considerably decreases upon formation of Ag–Ag2S JNP and appearance of three peaks at 2θ of 37.7, 43.8, and 63.7 for the (111), (200) and (220) planes of face centered cubic Ag crystal (JCPDS card no. 65-8428).7 Besides the diffraction peaks due to metallic silver, the peaks due to Ag2S with lattice constant of a = 4.23 Å, b = 6.92 Å and c = 7.86 Å agrees well with the reported values (a = 4.23 Å, b = 6.91 Å and c = 7.87 Å) from JCPDS card no. 65-2356.7 This provides evidence for the coexistence of Ag2S and Ag on cellulose support.
 |
| | Fig. 2 Solid state UV of Ag–Ag2S JNP. | |
 |
| | Fig. 3 The powder XRD pattern of Ag–Ag2S JNP. | |
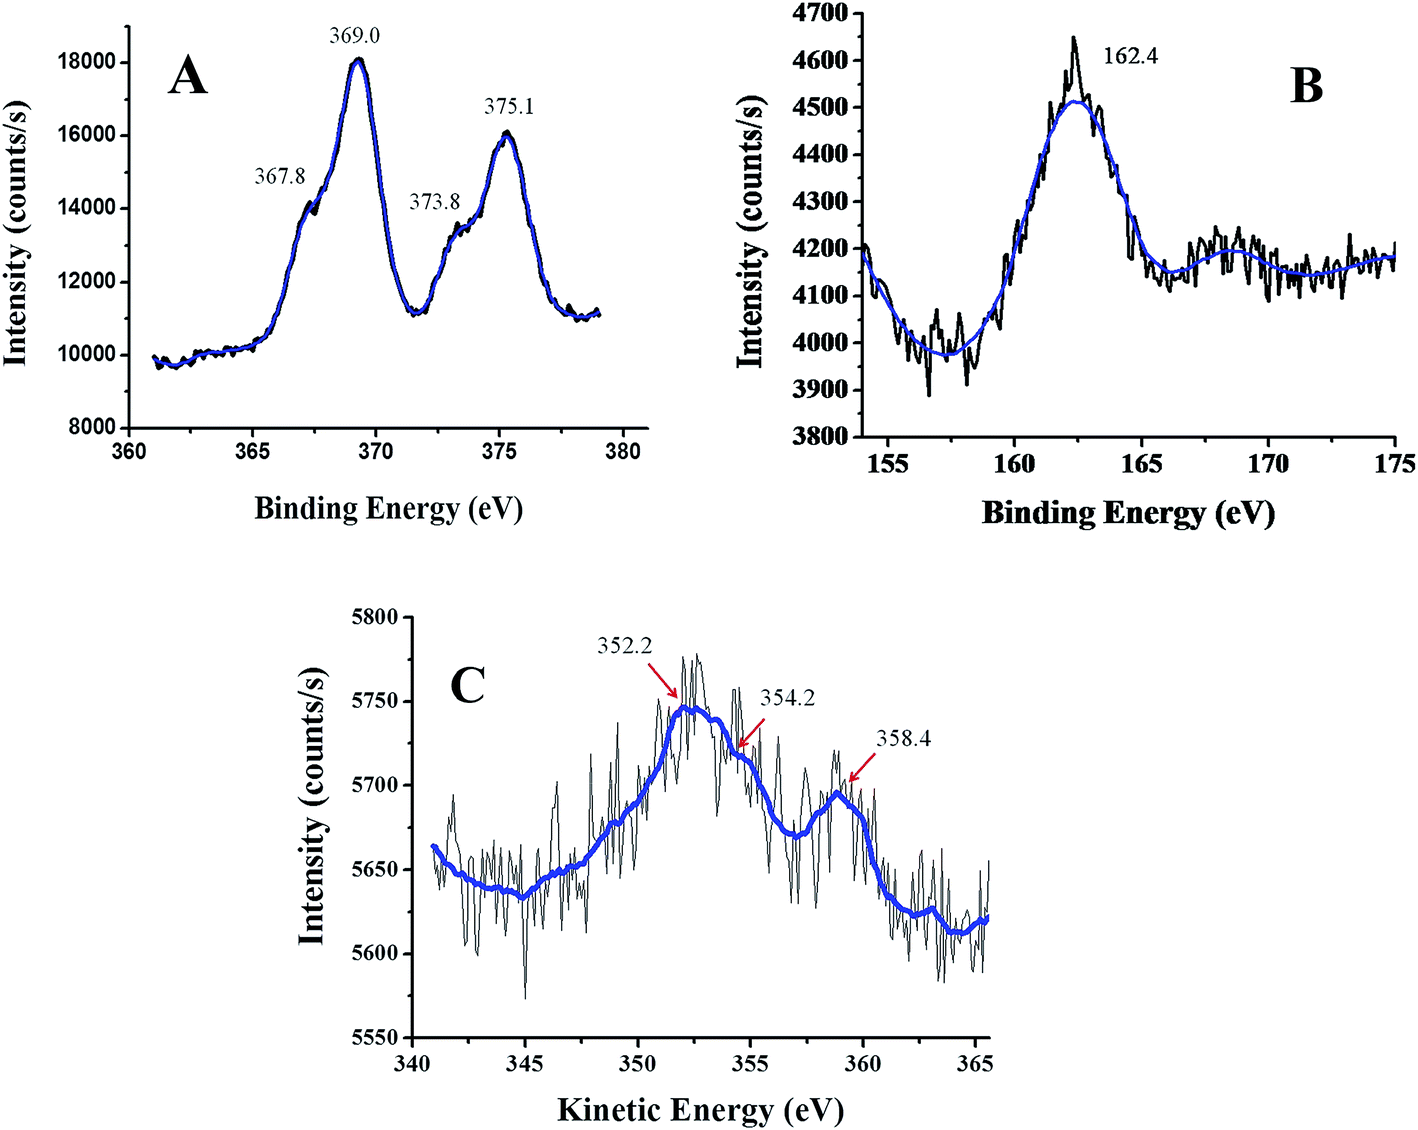
Morphological, elemental and structural characterizations of Ag–Ag2S JNP were carried out using SEM-EDX, elemental dot mapping and TEM analysis [Fig. 4–6]. The SEM images of cellulose before [Fig. 4(A)] and after Ag–Ag2S deposition [Fig. 4(C)] clearly indicates formation of nanoparticles on the surface of cellulose with uniform distribution. EDX spectra clearly shows the presence of Ag and S along with C and O of cellulose after deposition of Ag–Ag2S JNP, which are absent in the EDX of cellulose support alone [Fig. 4(B) and (D)]. The elemental dot mapping [Fig. 5] clearly shows the homogeneous distribution of Ag and S throughout the support. TEM images of Ag–Ag2S JNP [Fig. 6(A) and (B)] show a narrow size distribution in the range of 10–15 nm with spherical morphology and well dispersed on the support. The HRTEM images [Fig. 6(C) and S3, see ESI†] depicts clearly the visible lattice fringes inside the nanoparticles having two different contrasts suggesting different phase composition of the JNP. The measured inter-planer lattice fringe spacing on the dark patch is about 0.23 nm matches well the (111) d-spacing of face centered cubic (fcc) Ag0 crystals, while d-spacing of 0.30 nm on the blemish patch corresponds to (111) plane of monoclinic phase of Ag2S crystal, respectively.7 The corresponding selected area electron diffraction (SEAD) pattern of Ag–Ag2S JNP obtained by focussing the electron beam on the nanoparticles lying on the TEM grid is shown in Fig. 6(D). SAED pattern of the single particle exhibited sharp diffraction spots clearly suggest the particle is of single crystalline in nature. X-ray photoelectron spectroscopy (XPS) is used to ascertain the chemical state of the Ag–Ag2S JNP. The Ag 3d and S 2p spectra are shown in Fig. 7. For Ag 3d, the peaks at 369.0 eV and 375.1 eV are assigned to the binding energies of Ag 3d5/2 and Ag 3d3/2 of metallic Ag0 respectively. The binding energy values of Ag 3d level in Ag–Ag2S JNP supported on cellulose is slightly lower than that of the free metallic Ag0, suggesting that the electron transfer may occur from the cellulose to the Ag0 particles, due to which Ag becomes slightly electron-enriched.19,54,55 The smaller component at 367.8 and 373.8 eV may be attributed to those of Ag 3d5/2 and Ag 3d3/2 of Ag+ ions in Ag2S. However, there is ambiguity over the binding energy value of metallic silver and Ag+ ion, since the distinguishing between the two oxidation states cannot be judged only through the binding energy curve of silver 3d level. Fortunately, the auger peak of Ag MNN level allows reliable option to clarify the coexistence of Ag0 and Ag+ ions in the same nanoparticles [Fig. 7]. In the auger spectra three peaks observed at 352.2, 354.2 and 358.4 eV respectively for Ag MNN level. The peak at 352.2 and 358.4 eV is consistent to Ag0 and the peak at 354.2 eV is due to Ag+ species of Ag2S, clearly suggesting the coexistence of Ag+ alongwith with metallic silver.55–57 The peak at 162.4 eV is assigned for the S 2p1/2 of sulphur anions in the lattice of Ag2S.19,55
 |
| | Fig. 4 (A) SEM image of cellulose, (B) EDX analysis of cellulose, (C) SEM image of Ag–Ag2S JNP, (D) EDX analysis of Ag–Ag2S JNP. | |
 |
| | Fig. 5 Elemental dot mapping of C, O, Ag and S on the Ag–Ag2S JNP surface. | |
 |
| | Fig. 6 (A) TEM image of Ag–Ag2S JNP at lower resolution, (B) TEM image of Ag–Ag2S JNP at higher resolution, (C) HRTEM with fringe spacing of Ag–Ag2S JNP, (D) Selected Area Electron Pattern (SEAD) of Ag–Ag2S JNP. | |
 |
| | Fig. 7 XPS pattern of (A) Ag 3d, (B) S 2p and (C) Ag MNN auger structure. | |
3.3. Catalytic properties of Ag–Ag2S JNP in hydrogenation of p-nitrophenol
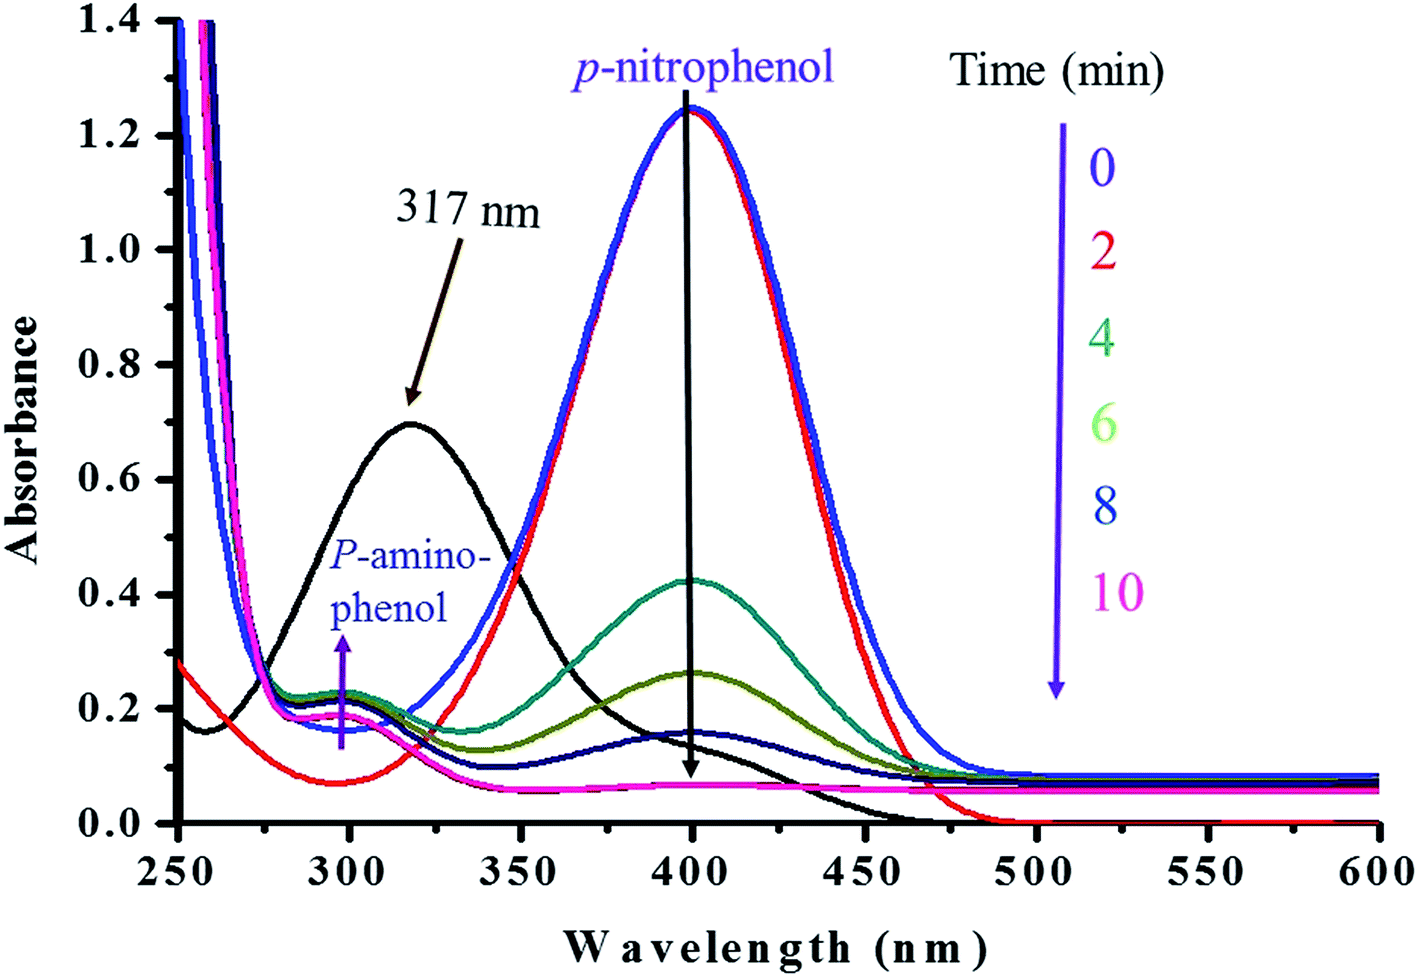
The catalytic performance of Ag–Ag2S JNP stabilized on cellulose was evaluated as a heterogeneous catalyst in reduction of p-nitrophenol in the present work (Scheme 1). The excess of sodium borohydride used increases the pH of the reacting system, retarding the decomposition of the borohydride ions and thereby resisting the aerial oxidation of the reduced p-nitrophenol through hydrogen liberation in the air. Since, the concentration of sodium borohydride is taken excess compared to p-nitrophenol, the reaction can be assumed to follow pseudo first order kinetics with respect to p-nitrophenol for evaluation of the catalytic rate. The p-nitrophenol shows an absorption peak at ∼317 nm in water, which shifted to ∼400 nm after the addition of NaBH4 due to the formation of an intermediate p-nitrophenolate ion at higher pH.58,59 The kinetics of the reaction was monitored spectrophotometrically by measuring the progressive disappearance of p-nitrophenolate ion peak (∼400 nm) accompanied by a gradual development of a new peak at ∼300 nm [Fig. 8], due to the formation of p-aminophenol in presence of catalyst.60 To illuminate the role of the catalyst, two blank reactions were performed with or without the support cellulose as catalyst. However, for both the reactions, the peak at ∼400 nm remain unaltered with times alongwith retention of yellow green color of p-nitrophenolate ion, which suggest that the reduction did not take place in absence of the Ag–Ag2S JNP catalyst. On the other hand, the addition of catalyst (Ag–Ag2S JNP) to the reaction mixture causes gradual fading of the yellow green color of the p-nitrophenolate ion with time and finally yellow green color disappeared at the end of the reaction within a time frame of 10 min [Fig. 8]. Since, the reaction follows pseudo first order kinetics with respect to p-nitrophenol, a plot of logA (A stands for absorbance at any time t) versus time is obtained [Fig. 9], from where rate constant (k) of the reaction can be calculated. The values of rate constant (k) determined from this plot is found 1.05 × 10⁻² s−1.
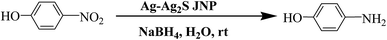 |
| | Scheme 1 Reduction of p-nitrophenol catalyzed by Ag–Ag2S JNP. | |
 |
| | Fig. 8 UV-Visible spectra of the 1st run of the catalyst in the reduction of p-nitrophenol. | |
 |
| | Fig. 9 Plot of ln(A) vs. time for the 1st run of the catalyst in the reduction of p-nitrophenol. | |
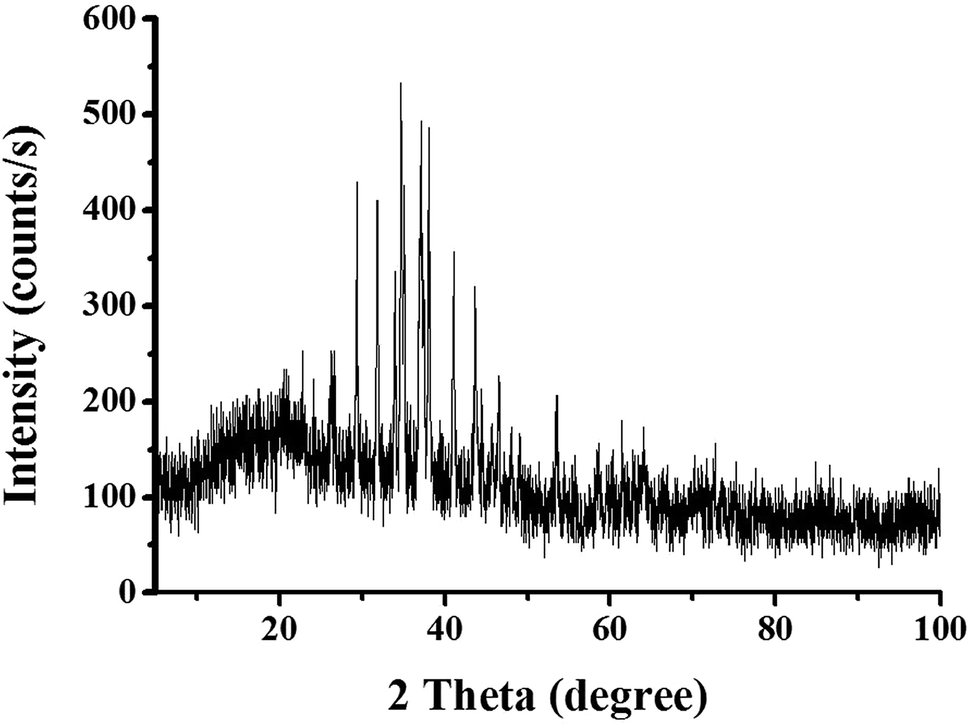
The used catalyst was recovered by simple filtration and the possibilities of reusability of Ag–Ag2S JNP were further investigated. The catalyst remains active for several runs without significant loss in efficiency and the results of the reduction is shown in Table 2. The rate constant of the reactions is slightly decreased after each reuse compared to fresh catalyst. The recovered catalyst was further investigated through XRD, elemental dot mapping and TEM analysis. The recovered catalyst showed almost the same powder XRD pattern [Fig. 10] like the fresh catalyst indicating robust character of the catalyst. The elemental dot mapping of recovered catalyst shows almost similar homogenous distributions of Ag and S on the support as obtained in the fresh catalyst [Fig. S4, see ESI†]. In the TEM image of the recovered catalyst confirms that the Ag–Ag2S JNP were still inside the matrix but small fractions of the particles agglomerated to form bigger sizes [Fig. S5, see ESI†].
Table 2 The results of the reduction of p-nitrophenol catalyzed by Ag–Ag2S JNP
| Entry |
Run |
Rate constant (s−1) |
| 1 |
1st |
1.05 × 10⁻² |
| 2 |
2nd |
1.27 × 10⁻³ |
| 3 |
3rd |
3.70 × 10⁻³ |
| 4 |
4th |
3.05 × 10⁻³ |
 |
| | Fig. 10 The powder XRD pattern of recovered catalyst (Ag–Ag2S JNP). | |
4. Conclusion
We have demonstrated a facile and simple one step fabrication of Ag–Ag2S JNP supported on cellulose template through a green pathway. Ag–Ag2S JNP of size 10–15 nm was synthesized by one step co-precipitation technique using NaOH–thiourea–urea aqueous solution. Electron microscopy as well as other analytical techniques confirmed the formation of Ag–Ag2S JNP. Furthermore, catalytic studies of the synthesized Ag–Ag2S JNP are also performed for reduction of p-nitrophenol to the corresponding p-aminophenol with very good activity. The catalyst is also found to remain active for several runs without significant loss in activity. Moreover, the size and composition of the nanoparticles may be varied by controlling the concentration of AgNO3 loading, changing the raw materials of cellulose and reaction parameters such as temperature.
Acknowledgements
The authors are grateful to Dr D. Ramaiah, Director, CSIR-North-East Institute of Science and Technology, Jorhat, Assam, India, for his kind permission to publish the work. Thanks are also given to CSIR, New Delhi for a financial support (Network projects: CSC-0103, 0131 and MLP-6000/IV). The authors also acknowledge SAIF, NEHU, Shillong for TEM & HRTEM images and Dr K. R. Patil & Dr D. S. Sutar for XPS analysis.
References
- P. G. Degennes, Rev. Mod. Phys., 1992, 64, 645 CrossRef.
- T. Mokari, C. G. Sztrum, A. Salant, E. Rabani and U. Banin, Nat. Mater., 2005, 4, 855 CrossRef CAS.
- L. X. Yi, A. W. Tang, M. Niu, W. Han, Y. B. Hou and M. Y. Gao, CrystEngComm, 2010, 12, 4124 RSC.
- X. B. He, L. A. Gao, S. W. Yang and J. Sun, CrystEngComm, 2010, 12, 3413 RSC.
- T. Mokari, E. Rothenberg, I. Popov, R. Costi and U. Banin, Science, 2004, 304, 1787 CrossRef CAS PubMed.
- S. E. Habas, H. Lee, V. Radmilovic, G. A. Somorjai and P. Yang, Nat. Mater., 2007, 6, 692 CrossRef CAS PubMed.
- F. Jiang, Q. Tian, M. Tsang, Z. Chen, J. Yang and J. Hu, CrystEngComm, 2011, 13, 7189 RSC.
- C. Wang, C. J. Xu, H. Zeng and S. H. Sun, Adv. Mater., 2009, 21, 3045 CrossRef CAS PubMed.
- T. Pellegrino, A. Fiore, E. Carlino, C. Giannini, P. D. Cozzoli, G. Ciccarella, M. Respaud, L. Palmirotta, R. Cingolani and L. Manna, J. Am. Chem. Soc., 2006, 128, 6690 CrossRef CAS PubMed.
- H. Yu, M. Chen, P. M. Rice, S. X. Wang, R. L. White and S. H. Sun, Nano Lett., 2005, 5, 379 CrossRef CAS PubMed.
- J. Yang, H. I. Elim, Q. B. Zhang, J. Y. Lee and W. Ji, J. Am. Chem. Soc., 2006, 128, 11921 CrossRef CAS PubMed.
- W. L. Shi, H. Zeng, Y. Sahoo, T. Y. Ohulchanskyy, Y. Ding, Z. L. Wang, M. Swihart and P. N. Prasad, Nano Lett., 2006, 6, 875 CrossRef CAS PubMed.
- P. Li, Z. Wei, T. Wu, Q. Peng and Y. Li, J. Am. Chem. Soc., 2011, 133, 5660 CrossRef CAS PubMed.
- S. L. Shen, Z. H. Tang, Q. Liu and X. Wang, Inorg. Chem., 2010, 49, 7799 CrossRef CAS PubMed.
- H. W. Gu, R. K. Zheng, X. X. Zhang and B. Xu, J. Am. Chem. Soc., 2004, 126, 5664 CrossRef CAS PubMed.
- J. S. Lee, M. I. Bodnarchuk, E. V. Shevchenko and D. V. Talapin, J. Am. Chem. Soc., 2010, 132, 6382 CrossRef CAS PubMed.
- J. Yang and J. Y. Ying, Chem. Commun., 2009, 3187 RSC.
- J. Yang and J. Y. Ying, J. Am. Chem. Soc., 2010, 132, 2114 CrossRef CAS PubMed.
- M. Pang, J. Y. Hu and H. C. Zeng, J. Am. Chem. Soc., 2010, 132, 10771 CrossRef CAS PubMed.
- W. Fan, S. Jewell, Y. She and M. K. H. Leung, Phys. Chem. Chem. Phys., 2014, 16, 676 RSC.
- A. Schrofel, G. Kratosova, I. Safarik, M. Safarikova, I. Raska and L. M. Shor, Acta Biomater., 2014, 10, 4023 CrossRef CAS PubMed.
- X. Song, N. Goswami, H. Yang and J. Xie, Analyst, 2016, 141, 3126 RSC.
- N. Goswami, Q. Yao, Z. Luo, J. Li, T. Chen and J. Xie, J. Phys. Chem. Lett., 2016, 7, 962 CrossRef CAS PubMed.
- J. Fang, B. Zhang, Q. Yao, Y. Yang, J. Xie and N. Yan, Coord. Chem. Rev., 2016, 322, 1 CrossRef CAS.
- Q. Yao, X. Yuan, Y. Yu, Y. Yu, J. Xie and J. Y. Lee, J. Am. Chem. Soc., 2015, 137, 2128 CrossRef CAS PubMed.
- K. Zheng, X. Yuan, N. Goswami, Q. Zhang and J. Xie, RSC Adv., 2014, 4, 60581 RSC.
- W. P. Lim, Z. Zhang, H. Y. Low and W. S. Chin, Angew. Chem., Int. Ed., 2004, 43, 5685 CrossRef CAS PubMed.
- W. J. Lou, X. B. Wang, M. Chen, W. M. Liu and J. C. Hao, Nanotechnology, 2008, 19, 225607 CrossRef PubMed.
- D. Dutta, B. J. Borah, L. Saikia, M. G. Pathak, P. Sengupta and D. K. Dutta, Appl. Clay Sci., 2011, 53, 650 CrossRef CAS.
- B. J. Borah, D. Dutta, P. P. Saikia, N. C. Barua and D. K. Dutta, Green Chem., 2011, 13, 3453 RSC.
- D. Dutta and D. K. Dutta, Appl. Catal., A, 2014, 487, 158 CrossRef CAS.
- G. Booth, Ullmanns Encyclopedia of Industrial Chemistry, WileyVCH Verlag, Weinheim, Germany, 2002 Search PubMed.
- F. Figueras and B. Coq, J. Mol. Catal. A: Chem., 2001, 173, 117 CrossRef.
- S. C. Mitchell and R. H. Waring, Ullmanns Encyclopedia of Industrial Chemistry, Wiley-VCH Verlag, Weinheim, Germany, 2000 Search PubMed.
- X. Wang, M. Liang, J. Zhang and Y. Wang, Curr. Org. Chem., 2007, 11, 299 CrossRef CAS.
- C. F. Winans, J. Am. Chem. Soc., 1939, 61, 3564 CrossRef CAS.
- B. Zuo, Y. Wang, Q. Wang, J. Zhang, N. Wu, L. Peng, L. Gui, X. Wang, R. Wang and D. Yu, J. Catal., 2004, 222, 493 CrossRef CAS.
- J. Zhang, Y. Wang, H. Ji, Y. Wei, N. Wu, B. Zuo and Q. Wang, J. Catal., 2005, 229, 114 CrossRef CAS.
- S. K. Thimmaiah, Standard Methods of Biochemical Analysis, Kalyani Publishers, 1999 Search PubMed.
- J. H. Morton, Proceedings of the chemistry and processing of wood and plant fibrous materials, Cellucon, Bangor, U.K., 1996, p. 151 Search PubMed.
- P. Saikia, D. Dutta, D. Kalita, J. J. Bora and T. Goswami, Construct. Build. Mater., 2015, 101, 1031 CrossRef.
- W. Burger and J. Mark, Digital image processing-an algorithmic approach, using Java, Springer-Verlag, New York, 2008, http://www.imagingbook.com Search PubMed.
- G. Impoco, S. Carrato, M. Caccamo, L. Tuminello and G. Licitra, Quantitative analysis of cheese microstructure using SEM imagery, Proceedings of SIMAI. Mini Symposium on Image Analysis Methods for Industrial Application, Italy, 22–26 May 2006 Search PubMed.
- http://rsb.info.nih.gov/ij/.
- P. Boruah, P. Dowarah, P. Barkakati, A. Yadav, R. Hazarika and T. Goswami, J. Cleaner Prod., 2016, 116, 259 CrossRef CAS.
- C. N. Saikia, T. Goswami and A. C. Ghosh, Process for preparation of alkali salt carboxy alkyl cellulose, US Pat., 5801239, September 1 1998.
- X. Yu, S. Tong, M. Ge, J. Zuo, C. Cao and W. Song, J. Mater. Chem. A, 2013, 1, 959 CAS.
- C. Cristobal, R. Encarnacion, B. Ignacio, J. N. Marna and C. Eulogio, Process Biochem., 2006, 41, 423 CrossRef.
- J. Fernfindez-Bolafios, B. Felizon, A. Heredia, R. Guillen and A. Jimenez, Bioresour. Technol., 1999, 68, 121 CrossRef.
- X. F. Sun, F. Xu, R. C. Sun, P. Fowler and M. S. Baird, Carbohydr. Res., 2005, 340, 97 CrossRef CAS PubMed.
- A. Alemdar and M. Sain, Compos. Sci. Technol., 2008, 68, 557 CrossRef CAS.
- K. Waleed and N. A. El-Zawawy, J. Appl. Polym. Sci., 2006, 100, 1842 CrossRef.
- W. Fantahun, P. V. Antar, G. Naveen and S. Prince, J. Microbiol. Biotechnol. Res., 2013, 3, 32 Search PubMed.
- L. J. Gerenser, K. E. Goppert-Berarducci, R. C. Baetzold and J. M. Pochan, J. Chem. Phys., 1991, 95, 4641 CrossRef CAS.
- C. D. Wagner, A. V. Naumkin, A. Kraut-Vass, J. W. Allison, C. J. Powell and J. R. Rumble, NIST X-ray photoelectron spectroscopy database, Version 3.3, 2003 Search PubMed.
- G. Zhu, C. Bao, Y. Liu, X. Shen, C. Xi, Z. Xu and Z. Ji, Nanoscale, 2014, 6, 11147 RSC.
- J. Wang, H. Feng, K. Chen, W. Fan and Q. Yang, Dalton Trans., 2014, 43, 3990 RSC.
- A. M. Signori, K. D. O. Santos, R. Eising, B. L. Albuquerque, F. C. Giacomelli and J. B. Domingos, Langmuir, 2010, 26, 17772 CrossRef CAS PubMed.
- A. Murugadoss and A. Chattopadhyay, Nanotechnology, 2008, 19, 015603 CrossRef CAS PubMed.
- J. Zeng, Q. Zhang, J. Chen and Y. Xia, Nano Lett., 2010, 10, 30 CrossRef CAS PubMed.
Footnote |
| † Electronic supplementary information (ESI) available. See DOI: 10.1039/c6ra16941d |
|
| This journal is © The Royal Society of Chemistry 2016 |
Click here to see how this site uses Cookies. View our privacy policy here.