DOI:
10.1039/C6RA16904J
(Paper)
RSC Adv., 2016,
6, 84573-84586
Study on the adsorption of Hg(II) by one-pot synthesis of amino-functionalized graphene oxide decorated with a Fe3O4 microsphere nanocomposite†
Received
1st July 2016
, Accepted 23rd August 2016
First published on 23rd August 2016
Abstract
An easy one-pot solvothermal strategy approach has been reported on the preparation of ethylenediamine (EDA) decorated with magnetite/graphene oxide (EDA–Fe3O4/GO) nanocomposites and employed as a recyclable adsorbent for Hg(II) in aqueous solution. Taking advantage of the combined benefits of graphene and magnetic nanoparticles, these EDA–Fe3O4/GO nanocomposites exhibit an excellent adsorption capacity (127.23 mg g−1) much higher than that of Fe3O4 microspheres and rapid separation from aqueous solution by an external magnetic field. The adsorption isotherm data and the kinetics of the adsorption process were fitted using the Langmuir equation and a pseudo-second-order kinetic model. The results of the thermodynamic parameters ΔH, ΔS and ΔG showed that the adsorption process was endothermic and spontaneous. The graphene oxide (GO) sheets could not only prevent agglomeration of the Fe3O4 microspheres and enable a good dispersion of these oxide microspheres, but also substantially enhance the specific surface area of the composite. Therefore, the EDA–Fe3O4/GO nanocomposites may be a promising sorption material for the separation and preconcentration of heavy metal ions from aqueous solutions in environmental pollution cleanups.
1. Introduction
In recent years, pollution of the environment with heavy metals has been spreading through the world along with industrial progress. These heavy-metal ions are nonbiodegradable and ubiquitous in the global environment, and they are derived from both natural sources and industrial activities. They can accumulate in the food chain, which poses a severe danger to human health.1,2 In particular, mercury is a remarkably toxic and non-biodegradable metal affecting neurological and renal activities. It is therefore critical to remove mercury from effluents. Hg(II) ions can be removed by conventional methods such as chemical precipitation,3 ion exchange4 and membrane processes.5 Compared to the conventional methods, adsorption appears to be a highly efficient and relatively simple approach.6–8
Recently, the development of novel and multifunctional nanomaterials has attracted considerable attention over the past decade.9,10 Yet, major challenges still arise when designing nanomaterials that hold antimicrobial and metal adsorption properties needed for biomedical,11 catalytic12–20 and environmental applications.21 Since graphene was first discovered through micromechanical exfoliation of graphite,22 it has been investigated by numerous scientists in various applications due to its unusual mechanical, electrical and thermal properties. Owing to its large theoretical specific surface area (∼2630 m2 g−1), graphene or graphene oxide (GO) has been proven as an effective sorbent for the removal of heavy metal ions23 and organic pollutants.24 However, it is difficult to separate it from aqueous solution because of its small particle size, causing serious health and environmental problems once it is discharged into the environment.25 The centrifugation method needs a very high rate and the traditional filtration method may cause blockages of filters. Compared with traditional centrifugation and filtration methods, the magnetic separation method is considered as a rapid and effective technique for separating nano-materials from aqueous solution.26 Several researchers have used Fe3O4 nano-particles as an adsorbent since Fe3O4 nano-particles possessed a high surface area and could easily be synthesized. Meanwhile, they had an incomparable advantage and could be separated easily from solution by an external magnetic field. But, their adsorption capacity and selectivity were unsatisfactory, and they showed poor stability under acidic conditions. Hence, magnetite/graphene composites with large specific surface area (enhancing the removal of water pollutants) and magnetic separation (facilitated by the recycling of the composites) have begun to be used in the field of environmental treatment.26–29
Magnetic-graphene oxide nanocomposites have been synthesized by a simple one-step solvothermal method as a new generation of materials exhibited highest adsorption capacities for the removal Co(II), As(III), As(V), Cr(V), Hg(II), Pb(II), dye, Cu(II), fulvic acid and antibiotics from aqueous solution. The GO sheets could not only prevent agglomeration of the Fe3O4 microspheres and enable a good dispersion of these oxide microspheres, but also substantially enhance the specific surface area of the composite, which was favorable for the removal of heavy metal ions. For example, Liu et al.30 reported a composite of porous Fe3O4 hollow microspheres/graphene oxide (Fe3O4/GO) has been fabricated through a facile self-assembly approach, the maximum sorption capacity for Cr(V) on Fe3O4/GO was 32.33 mg g−1, which was much higher than that of Fe3O4 microspheres. Bhunia et al.31 designed a heterogeneous matrix of iron/iron oxide dispersed on reduced graphene oxide (RGO), which showed the highest specific surface area among the RGO–iron oxide and RGO–iron composites. The resultant porous RGO–Fe(0)/Fe3O4 material exhibited highest efficiency to adsorb heavy metal ions (such as Cr(V), Hg(II), Pb(II), and As(III)) and was employed for catalytic oxidation reactions. Yoon et al.32 investigated arsenic removal using Fe3O4–graphene oxide composite (M–GO) and Fe3O4–reduced graphene oxide composite (M–rGO). Consequently, in terms of the process energy consumption, energy saving could be achieved via omitting the reduction process to fabricate M–rGO from M–GO and the pre-oxidation process to convert As(III) to As(V). Sun et al.33 reported a simple one-step solvothermal method for producing magnetite/RGO composites as a sorbent for dye pollutants. Bahar et al.34 also shown a new amino-functionalized Fe3O4–graphene oxide nanocomposite (AF-Fe3O4–GO) as magnetic solid-phase extraction (MSPE) adsorbent combined with flame atomic absorption spectrometry for copper analysis in food samples. It was confirmed that AF-Fe3O4–GO nanocomposite can be a highly effective MSPE adsorbent used for trace Cu(II) analyses. The solvothermal method not only effectively lowers the oxygen content and defect level in graphene sheets, but also obtains high-quality superparamagnetic Fe3O4 nanoparticles.
Recently, some reports on the preparation of amine-functionalized mesoporous magnetite,35–41 which is divided into one-step synthesis and two-steps synthesis. At present, numerous efforts have been made to one-step synthesis because it is simple, facile and fast compared with two-steps synthesis. Specifically, the adsorptions of heavy metal ions onto mesoporous magnetic nano-particles possess intriguing features for the adsorption of heavy metal ions, such as easy recover, large surface area, high pore volume, ordered porous channels, uniform and tunable pore structure, and great diversity in surface functionalization. Moreover, graphene-based magnetic composites, combining graphene with the benefits of magnetic nanoparticles, promise to provide an efficient approach to solve the separation problems of graphene. In addition, the loading magnetic nanoparticles can decrease the restacking and agglomeration of graphene and simultaneously offer a larger specific surface area due to the spacing effect of the magnetic nanoparticles between the graphene nanosheets. In this work, we prepared ethylenediamine (EDA) functionalized Fe3O4/GO magnetic composite (EDA–Fe3O4/GO) by a simple one-pot solvothermal method. The prepared composite, which were developed for the adsorption of Hg(II) from aqueous solution, had strong magnetic responsivity and stable chemical property. The characterization of the synthesized EDA–Fe3O4/GO was performed, and the adsorption capacity was studied through a series of batch experiments under different experimental conditions, including initial Hg(II) concentration, temperature, and solution pH. The adsorption mechanisms of Hg(II) onto the EDA–Fe3O4/GO were proposed.
2. Experiment
2.1 Materials and instruments
Graphite was purchased from Sigma-Aldrich. Sulfuric acid (95–98%), hydrogen chloride, nitric acid, 30% hydrogen peroxide, phosphorus pentoxide and potassium permanganate, ethanol, sodium nitrate and cadmium nitrate were obtained from Beijing Chemical Reagent Factory. Ferric chloride hexahydrate (FeCl3·6H2O > 99%) as a single iron source, sodium acetate anhydrous, ethylene glycol (EG), sodium citrate, ethylenediamine (EDA), a stock solution of Hg(II) (1000 mg L−1) was prepared by dissolving an appropriate amount of Hg(NO3)2 (Aldrich Chemical Co. USA) in double-distilled water, and the solution pH was adjusted using hydrochloric acid (HCl) or sodium hydroxide (NaOH).
The FT-IR was recorded with a Nicolet Magna-IR spectrophotometer between 4000 and 450 cm−1 using the KBr pellet technique. Transmission electron microscopy (TEM, FEI Tecnai G20) was obtained to elucidate the dimensions of the nanoparticle. Elemental analysis is performed by a PerkinElmer 2400 CHN analyzer. Magnetization measurements were performed on a vibrating sample magnetomtry (VSM, LAKESHORE-7304, USA). Scanning electron microscopy (SEM) images was recorded using a JSM-6380 LV microscope. Powder X-ray diffraction (XRD) patterns were taken on a Holland PANalyticalX'Pert PRO X-ray diffractometer with Cu-Kα radiation, Atomic Fluorescence (AFS-9700). Brunauer–Emmett–Teller (BET) surface area was measured at Micromeritics ASAP 2010 at 77 K by N2 adsorption–desorption isotherms. The zeta potential was measured at various pH with a Zetasizer Nano ZS90 (Malvern, UK) at 25 °C as a function of pH. The structural information of EDA–Fe3O4/GO was evaluated by a Raman Spectrometer (Model Nanofinder 30R., Tokyo Instruments Inc., Tokyo, Japan). The atomic force microscopy (AFM) image was obtained in air by using a Digital Instrumental Nanoscope III (Veeco, American) in tapping mode.
2.2 One-pot synthesis of amino-functionalized magnetite graphene oxide nanocomposites (EDA–Fe3O4/GO)
Prior to the preparation of EDA–Fe3O4/GO nanocomposite, graphene oxide (GO) was synthesized according to previous methods42 with a modification, for which KMnO4 was used as oxidant. Next, the EDA–Fe3O4/GO was prepared through the solvothermal method and using an autoclave at high temperature.43 To prepare EDA–Fe3O4/GO (e.g., weight ratio = 1![[thin space (1/6-em)]](https://www.rsc.org/images/entities/char_2009.gif) :3), GO dispersion was preparedby sonicating it (0.3125 g) for 3 h in ethylene glycol (60 mL). Then, FeCl3·6H2O (0.9375 g) and ethylenediamine (20 mL) as well as sodium acetate (2.4 g) were added to the GO dispersion with continuous sonicating at 50 °C for 30 min to form a clear solution. Finally, the obtained clear solution was sealed in a Teflon lined stainless-steel autoclave. The autoclave was heated and maintained at 200 °C for 8.0 h, and allowed to cool down to room temperature, as shown in Fig. 1. The obtained product was collected by the aid of a magnet, and then washed with deionized water and ethanol. The resultant precipitates (EDA–Fe3O4/GO) were dried at 45 °C. EDA–Fe3O4/GO with different feeding ratios were also prepared by the similar method. The products are named as EDA–Fe3O4/GO-1, EDA–Fe3O4/GO-2, EDA–Fe3O4/GO-3 and EDA–Fe3O4/GO-4 with different feeding ratio of GO to Fe3+ (weight ratio = 1:3, 1:7, 1:10, 1:20), respectively.
:3), GO dispersion was preparedby sonicating it (0.3125 g) for 3 h in ethylene glycol (60 mL). Then, FeCl3·6H2O (0.9375 g) and ethylenediamine (20 mL) as well as sodium acetate (2.4 g) were added to the GO dispersion with continuous sonicating at 50 °C for 30 min to form a clear solution. Finally, the obtained clear solution was sealed in a Teflon lined stainless-steel autoclave. The autoclave was heated and maintained at 200 °C for 8.0 h, and allowed to cool down to room temperature, as shown in Fig. 1. The obtained product was collected by the aid of a magnet, and then washed with deionized water and ethanol. The resultant precipitates (EDA–Fe3O4/GO) were dried at 45 °C. EDA–Fe3O4/GO with different feeding ratios were also prepared by the similar method. The products are named as EDA–Fe3O4/GO-1, EDA–Fe3O4/GO-2, EDA–Fe3O4/GO-3 and EDA–Fe3O4/GO-4 with different feeding ratio of GO to Fe3+ (weight ratio = 1:3, 1:7, 1:10, 1:20), respectively.
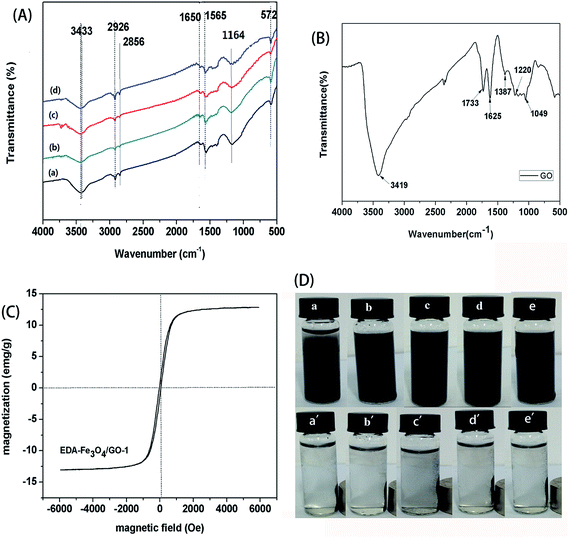 |
| | Fig. 1 (A) Infrared spectra of (a) EDA–Fe3O4/GO-1, (b) EDA–Fe3O4/GO-2, (c) EDA–Fe3O4/GO-3 and (d) EDA–Fe3O4/GO-4 composite; (B) infrared spectra of GO; (C) VSM magnetization curvesof EDA–Fe3O4/GO-1; (D) photographs of aqueous solution of Hg(II) after adsorption by adsorbents (from (a) to (e): EDA–Fe3O4, EDA–Fe3O4/GO-1, EDA–Fe3O4/GO-2, EDA–Fe3O4/GO-3 and EDA–Fe3O4/GO-4, respectively), photographs of magnetic separation of adsorbent (from (a′) to (e′): EDA–Fe3O4, EDA–Fe3O4/GO-1, EDA–Fe3O4/GO-2, EDA–Fe3O4/GO-3 and EDA–Fe3O4/GO-4, respectively). | |
2.3 Hg(II) ions adsprption and procedure for magnetic solid phase extraction
The entire extraction procedure of using EDA–Fe3O4/GO nanocomposites as a sorbent. The adsorption of Hg(II) by EDA–Fe3O4/GO was performed at 25 °C. The solution of Hg(II) was prepared by dissolving an appropriate quantity of Hg(NO3)2 in double-distilled water to give a final concentration range from 1 mg L−1 to 100 mg L−1. And the mixture was adjusted to a certain pH value using hydrochloric acid (HCl) or sodium hydroxide (NaOH) solutions. In general, 8 mg magnetic EDA–Fe3O4/GO was added to 40 mL Hg(II) solution and the mixture was ultrasonicated for 5 min. Then the magnetic adsorbent was removed magnetically from the solution using a permanent hand-held magnet. The Hg(II) concentration in the supernatant was measured by atomic fluorescence. Unless otherwise specified, the adsorption experiments were performed in aqueous solution at pH 5.2 and 25 °C.
3. Results and discussion
3.1 Characterization
The formations of GO and EDA–Fe3O4/GO composite was investigated using FT-IR spectrometry. FT-IR spectrum of GO is shown in Fig. 1(B). The strong wide absorption band at 3419 cm−1 is characteristic of the stretching vibration of hydroxyl groups. There are also bands pertaining to carbonyl C![[double bond, length as m-dash]](https://www.rsc.org/images/entities/char_e001.gif) O and CC groups (1733 and 1049 cm−1, respectively), carboxylic acid C–O band (1387 cm−1), and C–O–H deformation peak (at 1220 cm−1). Furthermore, FT-IR spectrum of nanocomposites is shown in Fig. 1(A)(a–d). The production of iron oxide nanocomposite can be seen from the occurrence of a strong absorption band at 572 cm−1. The band of amine groups at 3433 cm−1, the stretching vibration peak of aliphatic C–N at 1164 cm−1, N–H deformation band at 1650 cm−1, and also C–H stretchingband at 2926 cm−1 can be a confirmation of the formation of EDA–Fe3O4/GO magnetic nanocomposite adsorbent. Fig. 1(C) depicts the magnetization hystereis loop of EDA–Fe3O4/GO-1 at room temperature. The saturation magnetization of the obtained adsorbent is about 12.84 emg g−1, which is strong enough to ensure convenient magnetic separation as shown in Fig. 1(D)(b and b′). Additionally, as seen in shown Fig. 2(D), from (a) to (e) shows photographs of aqueous solution of Hg(II) after adsorption by EDA–Fe3O4, EDA–Fe3O4/GO-1, EDA–Fe3O4/GO-2, EDA–Fe3O4/GO-3 and EDA–Fe3O4/GO-4 adsorbents, respectively. Without an external magnetic field, a black homogeneous dispersion emerged. Once an external magnetic filed was applied from besides, EDA–Fe3O4/GO is conveniently attracted to the wall of vessel. As shown in Fig. 1(D), from (a′) to (e′) shows adsorbents of EDA–Fe3O4, EDA–Fe3O4/GO-1, EDA–Fe3O4/GO-2, EDA–Fe3O4/GO-3 and EDA–Fe3O4/GO-4 composite, respectively, which were conveniently attracted to the wall of vessel by magnetic separation in 3 s. This experiment result of simple magnetic separation confirms that EDA–Fe3O4/GO is magnetic and can be used as a magnetic sorbent to enrich pollutants adsorbed from large volumes of aqueous solution.
O and CC groups (1733 and 1049 cm−1, respectively), carboxylic acid C–O band (1387 cm−1), and C–O–H deformation peak (at 1220 cm−1). Furthermore, FT-IR spectrum of nanocomposites is shown in Fig. 1(A)(a–d). The production of iron oxide nanocomposite can be seen from the occurrence of a strong absorption band at 572 cm−1. The band of amine groups at 3433 cm−1, the stretching vibration peak of aliphatic C–N at 1164 cm−1, N–H deformation band at 1650 cm−1, and also C–H stretchingband at 2926 cm−1 can be a confirmation of the formation of EDA–Fe3O4/GO magnetic nanocomposite adsorbent. Fig. 1(C) depicts the magnetization hystereis loop of EDA–Fe3O4/GO-1 at room temperature. The saturation magnetization of the obtained adsorbent is about 12.84 emg g−1, which is strong enough to ensure convenient magnetic separation as shown in Fig. 1(D)(b and b′). Additionally, as seen in shown Fig. 2(D), from (a) to (e) shows photographs of aqueous solution of Hg(II) after adsorption by EDA–Fe3O4, EDA–Fe3O4/GO-1, EDA–Fe3O4/GO-2, EDA–Fe3O4/GO-3 and EDA–Fe3O4/GO-4 adsorbents, respectively. Without an external magnetic field, a black homogeneous dispersion emerged. Once an external magnetic filed was applied from besides, EDA–Fe3O4/GO is conveniently attracted to the wall of vessel. As shown in Fig. 1(D), from (a′) to (e′) shows adsorbents of EDA–Fe3O4, EDA–Fe3O4/GO-1, EDA–Fe3O4/GO-2, EDA–Fe3O4/GO-3 and EDA–Fe3O4/GO-4 composite, respectively, which were conveniently attracted to the wall of vessel by magnetic separation in 3 s. This experiment result of simple magnetic separation confirms that EDA–Fe3O4/GO is magnetic and can be used as a magnetic sorbent to enrich pollutants adsorbed from large volumes of aqueous solution.
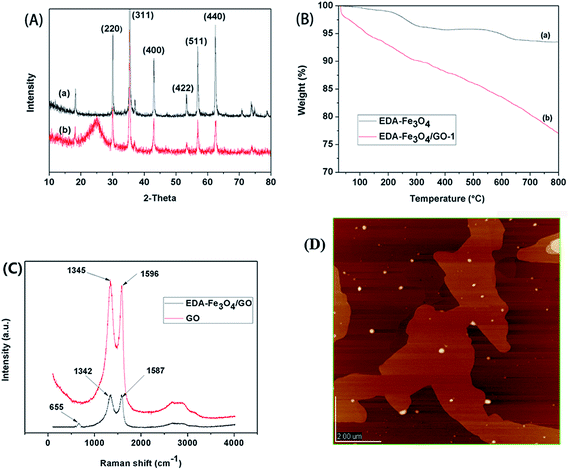 |
| | Fig. 2 (A) XRD patterns for EDA–Fe3O4 (a) and EDA–Fe3O4/GO-1 (b); (B) TGA curves for EDA–Fe3O4 (a) and EDA–Fe3O4/GO-1 (b); (C) Raman spectra of GO and EDA–Fe3O4/GO; (D) AFM image of EDA–Fe3O4/GO. | |
Fig. 2(A) shows the X-ray diffraction (XRD) patterns of the EDA–Fe3O4 and EDA–Fe3O4/GO-1 composite. As can be seen, the diffraction pattern for EDA–Fe3O4 and EDA–Fe3O4/GO-1 composite, with the main peaks at 30.1°, 35.7°, 43.5°, 53.8°, 57.1°and 62.9° corresponding to (220), (311), (400), (422), (511) and (440), respectively, displayed characteristics typical of iron oxides in EDA–Fe3O4/GO-1 composite (JPPDS No. 19-0629);30 the pattern of EDA–Fe3O4/GO-1 displayed obvious diffraction peaks of GO,44 EDA–Fe3O4/GO-1 composite curve shows a weak and broad diffraction peak at 2θ = 23.5° (002). The broad peak corresponded to the reflection peak of the reduced graphene oxide (RGO),45 it indicates that GO may be reduced by EDA treatment under hydrothermal conditions. The X-ray diffraction pattern of Fe3O4/GO44 was similar to EDA–Fe3O4/GO-1 (not shown) that shows the amine modification does not result in the phase change of Fe3O4/GO.
As shown in Fig. 2(B), weight alteration of samples during modification procedure was monitored by TGA curves. Below about 200 °C, all the show a decrease to a small extent at a weight loss of 3.87% and 9.87% for EDA–Fe3O4 and EDA–Fe3O4/GO-1, respectively, which is considered to result from the reduction of water including physically adsorbed and chemically bonding water. It indicates that EDA–Fe3O4/GO-1 possesses excellent hydrophilicity due to its largest pore volumes, highest surface area, numerous oxygen functional groups (such as –OH, –COOH, –O–, and CO). For EDA–Fe3O4, between 250 °C and 800 °C, 6.50% weight loss occurred, of which about 2.66% is attributed to the loss of the EDA amino groups introduced. Furthermore, the weight loss of EDA–Fe3O4/GO-1 between 200 °C and 800 °C increases to 23.0%, of which about 12.33% weight loss is attributed to the amino groups, demonstrating that the graft of EDA has been successfully implemented.
According to the Raman spectra of the EDA–Fe3O4/GO nanocomposites and GO in Fig. 2(C), the obvious peaks at 1345 and 1596 cm−1 can be attributed to the disordered structure (D band, sp3 carbon atoms of disorders and defects) and graphite structure (G band, sp2 carbon atoms in graphitic sheets) of GO,46 respectively. Comparing with pristine GO, the ratio of D and G peaks of EDA–Fe3O4/GO becomes higher, suggesting a higher level of disorder of the graphene layers during the functionalization process.47,48 In carbonaceous material, G-band in the Raman spectrum corresponds to sp2 carbonatoms stretching modes. Compared to GO, it is clear that G-band of EDA–Fe3O4/GO occurs at 1587 cm−1, which is down shifted by 9 cm−1. The Raman shifts of the G band for EDA–Fe3O4/GO provide evidence for the charge transfer between GO and Fe3O4, which shows a strong interaction between GO and Fe3O4.47 The characteristic Raman band of Fe3O4 microspheres in EDA–Fe3O4/GO composite was found at 655 cm−1, ascribing to the A1g mode of Fe–O vibrations.49 The AFM image (shown in Fig. 2(D)) indicates that the thickness of the EDA–Fe3O4/GO is approximately 2.0 nm for the selected place in the distribution graph.
The size and loading amount of Fe3O4 microspheres on the graphene nanosheets were effectively determined by changing the initial ratio of FeCl3·6H2O to GO. The TEM images of all the EDA–Fe3O4/GO composites are shown in Fig. 3. All the Fe3O4 nanoparticles are well anchored on translucent graphene nanosheets in the samples. While maintaining the weight of GO (312.5 mg), the graphene nanosheets were decorated more intensively by Fe3O4 microspheres as the mass ratio of GO and iron increased from 1:3 to 1:20 (Fig. 4(A–D)). When the mass ratio of GO and iron was kept to 1:20, more Fe3O4 microspheres coated onto the surface of graphene nanosheets, the number of the magnetic ball significantly increased. GO has a crumbled wave-like structure and quite smooth, and precipitated Fe3O4 microspheres on the GO nanosheets with a size less than 300 nm. The SEM images of all the EDA–Fe3O4/GO nanocomposites are shown in Fig. 4, the reuslts are consitent with the TEM images of EDA–Fe3O4/GO nanocomposites. The GO sheets could not only prevent agglomeration of the Fe3O4 microspheres and enable a good dispersion of these oxide microspheres, but also substantially enhance the specific surface area of the composite. These results suggest that the distribution density of Fe3O4 microspheres on the surface nanosheets increases with increasing the initial ratio of FeCl3·6H2O to GO. In addition, the higher mass ratio of FeCl3·6H2O to GO also results in the larger size of Fe3O4 microspheres.
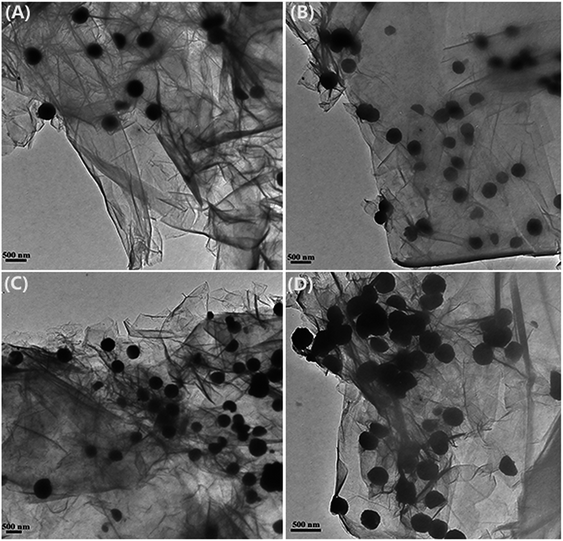 |
| | Fig. 3 TEM of EDA–Fe3O4/GO-1 (A), EDA–Fe3O4/GO-2 (B), EDA–Fe3O4/GO-3 (C) and EDA–Fe3O4/GO-4 (D). | |
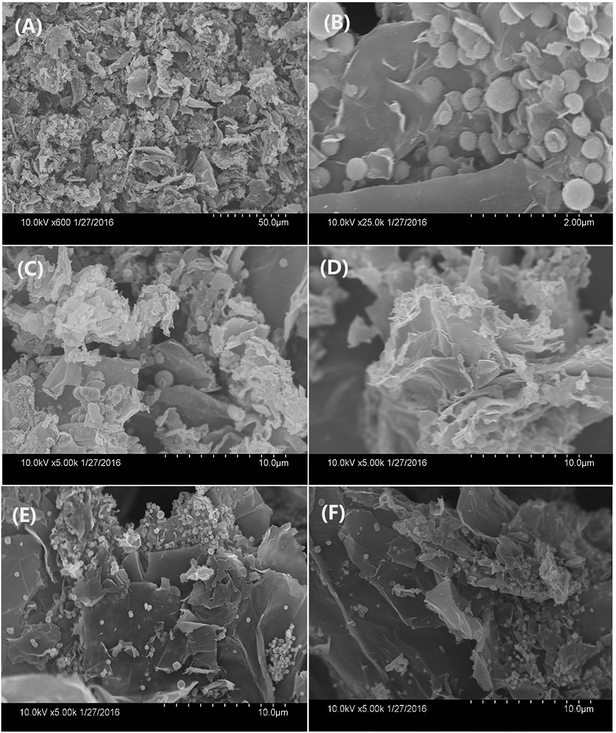 |
| | Fig. 4 SEM of EDA–Fe3O4/GO-1 (A–C), EDA–Fe3O4/GO-2 (D), EDA–Fe3O4/GO-3 (E) and EDA–Fe3O4/GO-4 (F). | |
BET analysis was reported as an effective tool for investigating the specific surface area of nanomaterials. The N2 adsorption/desorption isotherm of as-synthesized EDA–Fe3O4/GO exhibits typical IV-type isotherms with H3-hysteresis loops as shown in Fig. 5, indicating the presence of mesopores with many slit holes, which might generate from the gaps between magnetic microspheres and GO sheets or the gaps between GO sheets.50,51 As shown in Fig. 5, the average pore diameters of EDA–Fe3O4/GO-1, EDA–Fe3O4/GO-2, EDA–Fe3O4/GO-3 and EDA–Fe3O4/GO-4 are 15.37 nm, 15.94 nm, 16.36 nm and 16.84 nm, respectively. According to the N2 adsorption analysis the BET surface area of EDA–Fe3O4/GO-1, EDA–Fe3O4/GO-2, EDA–Fe3O4/GO-3 and EDA–Fe3O4/GO-4 are 97.56 m2 g−1, 90.63 m2 g−1, 84.24 m2 g−1 and 75.25 m2 g−1, respectively.
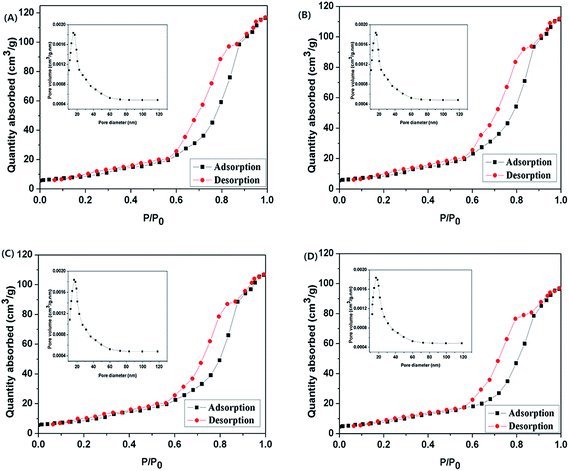 |
| | Fig. 5 BET pattern and pore size distribution of EDA–Fe3O4/GO-1 (A), EDA–Fe3O4/GO-2 (B), EDA–Fe3O4/GO-3 (C) and EDA–Fe3O4/GO-4 (D). | |
3.2 Zeta potentials of EDA–Fe3O4/GO-1 and the adsorption behavior effect of pH
The effect of pH value on the zeta potential of EDA–Fe3O4/GO-1, EDA–Fe3O4 and GO was plotted in Fig. 6(A). pHzpc is an important parameter to evaluate the surface charge properties of adsorbent and it determines the electrophoretic mobility where the net total particle charge is zero.52 As shown in Fig. 6(A), the zeta potentials of EDA–Fe3O4/GO-1 and EDA–Fe3O4 decreased as the pH value increased. The isoelectric point (pI) of the EDA–Fe3O4/GO-1 and EDA–Fe3O4 was approximately 4.35 and 5.23, respectively. For EDA–Fe3O4/GO-1 (or EDA–Fe3O4), this revealed that the EDA–Fe3O4/GO-1 (or EDA–Fe3O4) composite were positively charged at pH < 4.35 (or pH < 5.23) and negatively charged at pH > 4.35 (or pH > 5.23). Whereas, GO was negatively charged at pH 2.0–9.0.
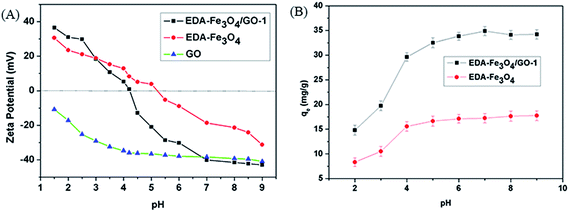 |
| | Fig. 6 (A) Zeta potentials of EDA–Fe3O4/GO-1, EDA–Fe3O4 and GO. (B) Effect of pH on the adsorption of Hg(II) by EDA–Fe3O4/GO-1 and EDA–Fe3O4. Initial concentration of Hg(II): 8.2 mg L−1. | |
The adsorptions of Hg(II) on the EDA–Fe3O4/GO-1 and EDA–Fe3O4 surface belongs to surface reaction. It can be predicted that the pH plays an important role in the adsorption of particular metal ions onto the adsorbents.53 Because it can affect the solution chemistry of contaminants and the state of functional groups on the surface of adsorbents. The effect of solution pH on Hg(II) adsorption was investigated at pH 2.0–9.0, 298 K. As shown in Fig. 6(B), the adsorption capacity of EDA–Fe3O4/GO-1 on Hg(II) was larger than that of EDA–Fe3O4 at pH 2.0, which is 14.46 mg g−1. The adsorption capacity of Hg(II) increasing pH values from 2.0 to 9.0 for both EDA–Fe3O4/GO-1 and EDA–Fe3O4. The smaller adsorption capabilities of EDA–Fe3O4/GO-1 and EDA–Fe3O4 at lower pH levels, which is due to the dominant role of physical adsorption. That is to say, it is not contributed to removal Hg(II) of the functional group. With the increase of pH value, the adsorption capacity of EDA–Fe3O4/GO-1 on Hg(II) was significantly increased, on the one hand, the specific surface area of GO was larger, on the other hand, the amino modified active adsorption sites increased. It is consistent with the results by Liu et al.,54 which indicates that the sorption quantity of mercury increases with the increasing pH values. They also thought that protons could compete with mercury ions, occupying the active adsorbent sites of mercury imprinted copolymers below pH 3.0. It is of concern if the mercury precipitates at a higher pH range when Hg(OH)2 is dominated, Zhang et al.55 had done the solubility of mercury vs. solution pH in the absence of the adsorbent, and found that no significant change of dissolved mercury at pH range of 1.0–12.0 with a initial concentration lower than 120 mg L−1, which implies that Hg(OH)2 still dissolves in the solution when mercury concentration is not too high. It is evident that EDA–Fe3O4/GO-1 is effective for the removal of mercury over a wide range of pH, so the optimum pH for Hg(II) ion sorption is found in the pH range of 4.0–9.0.
3.3 Adsorption isotherms
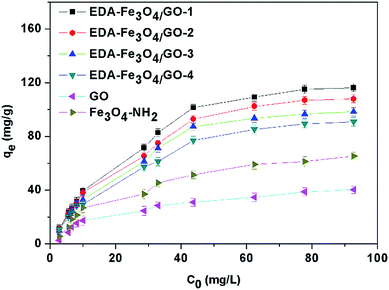
Since the nanocomposite EDA–Fe3O4/GO containing of EDA–Fe3O4/GO-1, EDA–Fe3O4/GO-2, EDA–Fe3O4/GO-3 and EDA–Fe3O4/GO-4 has been shown to be the most effective in removing heavy metals, it is important to determine the adsorption capacity of the adsorbent to ascertain the amount of adsorbent required to efficiently remove heavy metals, such as mercury, from an aqueous solution. Fig. S1† shows the adsorption isotherm of Hg(II) with concentrations ranging from 2 mg L−1 to 100 mg L−1. The highest adsorption capacity of Hg(II) ions by EDA–Fe3O4/GO-1 was 127.33 mg g−1 at an equilibrium concentration of 92.68 mg L−1. On the other hand, the sorption capacity attained by Fe3O4–NH2 and GO were 65.319 mg g−1 and 40.275 mg g−1, respectively. These results for EDA–Fe3O4/GO-1 are much higher than those obtained from activated carbon fibers, graphene oxide–ethylenediaminetetraacetic acid (GO–EDTA), multiwalled carbon nanotubes and some other carbon-based nanomaterials (see Table 2), which suggests that this new nanocomposite is more efficient in the removal of heavy metal than these other materials.
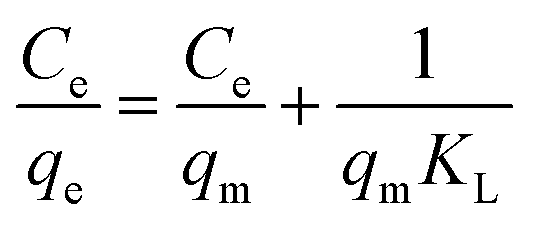
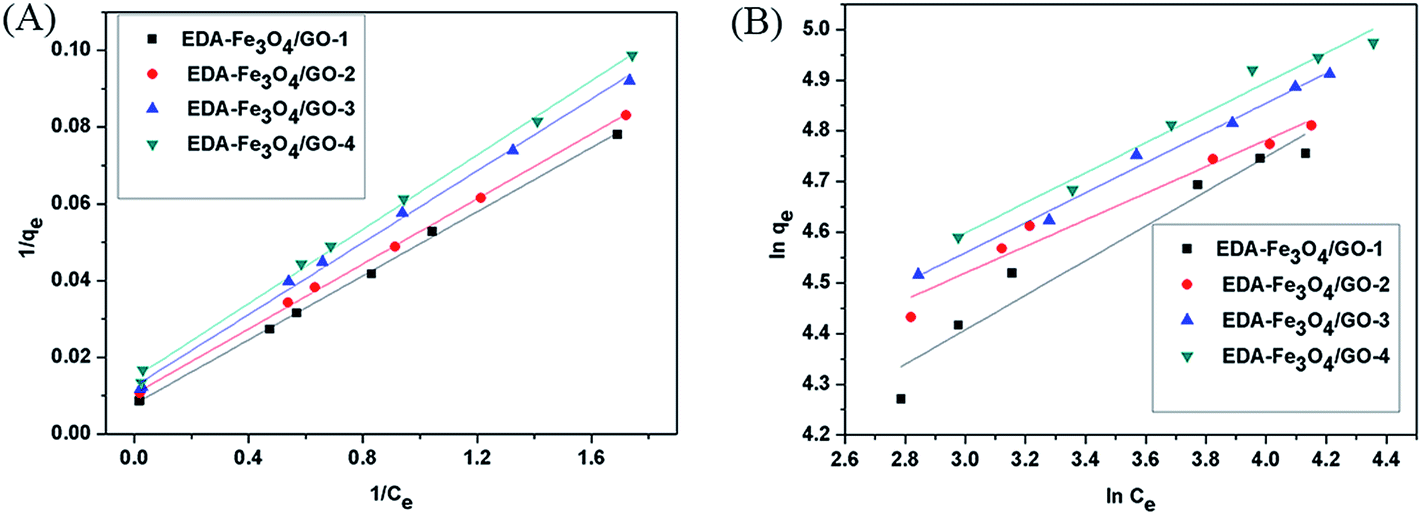
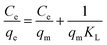
The adsorption capacities of the as-obtained EDA–Fe3O4/GO to heavy metal ions were measured individually at pH 5.30 with 8 mg of EDA–Fe3O4/GO and varied metal ions concentration (2–100 mg L−1). The results are shown in Fig. 8. It can be seen clearly that the adsorption amount of mercury ions increases with the increasing initial concentrations and reaches a plateau at higher concentration, which resulted from the saturation adsorption of mercury on the chelating sites of the EDA–Fe3O4/GO. The Langmuir and Freundlich equations were used for modeling these adsorption isotherm data. All the isotherms showed a similar shape and were nonlinear over a wide range of aqueous equilibrium concentrations in Fig. 7. The Langmuir and Freundlich models are two well-known isothermal adsorption models.56 The expression for the Langmuir isotherm is:
| |
 | (1) |
 |
| | Fig. 7 Effect of initial concentration on the adsorption capacity of GO, Fe3O4 microsphere and EDA–Fe3O4/GO for mercury. | |
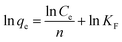
The expression for the Freundlich isotherm is:
| |
 | (2) |
where
qe (mg g
−1) is the amount of adsorbed Hg(
II) on the EDA–Fe
3O
4/GO hybrids,
Ce (mg L
−1) is the equilibrium Hg(
II) concentration in solution,
KL (L mg
−1) is the Langmuir constant, and
qm (mg g
−1) is the maximum adsorption capacity of the adsorbents.
KF and
n are the Freundlich constants, which are related to the adsorption capacity and the adsorption strength, respectively.
qm and
KL could be obtained from the linear plot of
Ce/
qe versus Ce (
eqn (1)), and
KF and
n could be calculated from the linear plot of ln
qe versus ln
Ce (
eqn (2)). The adsorption isotherms of Hg(
II) on the EDA–Fe
3O
4/GO hybrid suspensions are plotted in
Fig. 8. The adsorption constants derived from the Langmuir and Freundlich adsorption models are shown in
Table 1. For the two studied models, the Langmuir equation showed a more significant correlation (
R2 > 0.99) than in the case of the Freundlich equation with the experimental data, which suggested a monolayer adsorption of Hg(
II) on EDA–Fe
3O
4/GO. The values of
qm, which is a relative indicator of adsorption capacity in Langmuir theory, indicate that the Hg(
II) adsorption capacity of EDA–Fe
3O
4/GO-1 was higher than that of EDA–Fe
3O
4/GO-2 (3 and 4). The monolayer saturation adsorption capacity (
qm) of EDA–Fe
3O
4/GO for Hg(
II) was also higher than that of GO and EDA–Fe
3O
4. Furthermore, comparison with other adsorbents reported in the literature indicates that EDA–Fe
3O
4/GO had higher Hg(
II) adsorption capacities, as shown in
Table 2.
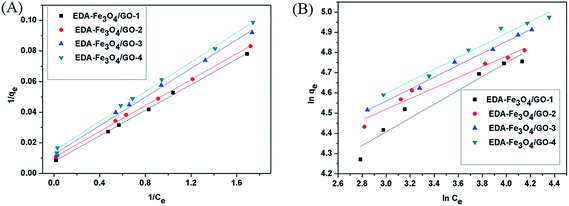 |
| | Fig. 8 Langmuir (A) and Freundlich (B) isotherm constants of Hg(II) adsorption on EDA–Fe3O4/GO-1, EDA–Fe3O4/GO-2, EDA–Fe3O4/GO-3 and EDA–Fe3O4/GO-4. | |
Table 1 Langmuir and Freundlich isotherm constants of Hg(II) adsorption on EDA–Fe3O4/GO-1, EDA–Fe3O4/GO-2, EDA–Fe3O4/GO-3 and EDA–Fe3O4/GO-4
| Adsorbent |
Langmuir |
Freundlich |
| KL (L mg−1) |
qm (mg g−1) |
R2 |
n |
KF (L g−1) |
R2 |
| EDA–Fe3O4/GO-1 |
0.1883 |
127.23 |
0.9991 |
2.93 |
29.47 |
0.9376 |
| EDA–Fe3O4/GO-2 |
0.2476 |
95.42 |
0.9992 |
3.81 |
41.78 |
0.9582 |
| EDA–Fe3O4/GO-3 |
0.2659 |
80.32 |
0.9965 |
3.39 |
39.45 |
0.9892 |
| EDA–Fe3O4/GO-4 |
0.3039 |
68.03 |
0.9976 |
3.38 |
40.87 |
0.9715 |
Table 2 Comparison of maximum sorption of the adsorbents to Hg(II) from aqueous solution
| Adsorbents |
Initial concentration |
pH |
qm (mg g−1) |
Ref. |
| SS carbon |
120 mg L−1 |
5.0 |
73.5–151.3 |
55 |
| o-Benzenedithiol-modified cellulose resin |
10−5 mol L−1 |
<1.0 |
23 |
57 |
| Carbon aerogel |
5–70 mg L−1 |
4.5 |
34.96 |
58 |
| Mag-SBA-15 |
|
4.5–8.2 |
90.9–357.1 |
59 |
| MPS-MCM-48 |
|
|
280.8 |
60 |
| SG-HO-pD |
0.625–10 mmol L−1 |
4 |
104.312 |
61 |
| FTU-SBA-15-Cc and FTU-SBA-15-Gr |
|
6 |
56.168 and 122.366 |
62 |
| M-MIONPs |
5–200 ng mL−1 |
9 |
About 1.0 mg g−1 |
63 |
| SG-HE-S-AO and SG-HO-S-AO |
10−3 to 5 × 10⁻³ mol L−1 |
5.0 |
180.54 and 148.44 |
64 |
| SG-HE-AO and SG-HO-AO |
10−3 to 5 × 10⁻³ mol L−1 |
3.0–5.0 |
143.228 and 116.95 |
65 |
| MNPs-polyAEMA·DTC |
10 mg L−1 |
|
59.45 |
66 |
| HO-SG-GPTS-TS and HE-SG-GPTS-TS |
10−3 to 5 × 10⁻³ mol L−1 |
6 |
148.44 and 88.26 |
67 |
| EDA–Fe3O4/GO-1 |
2–100 mg L−1 |
5.30 |
127.23 |
This work |
| EDA–Fe3O4/GO-2 |
2–100 mg L−1 |
95.42 |
This work |
| EDA–Fe3O4/GO-3 |
2–100 mg L−1 |
80.32 |
This work |
| EDA–Fe3O4/GO-4 |
2–100 mg L−1 |
68.03 |
This work |
3.4 Asorption kinetics
The adsorption kinetic study plays a significant role in the analysis of the adsorption process, and can depict the adsorption rate which in turn controls the residual time of the adsorption process at the solid–solution interface. Kinetics experiments were carried out by adding 8.0 mg EDA–Fe3O4/GO-1 to 40.0 mL solution containing various amount of Hg(II) at pH 5.30, 25 °C with contact time ranging from 1 to 120 min. It can be known from the results shown in Fig. 9, that the uptake of Hg(II) is quite effective initially, then slows down with the lapse of time and reaches equilibrium within 10 min. Compared to the palm shell activated carbon (AC)6 and mesoporous silica (MS),68 the EDA–Fe3O4/GO havea shorter adsorption equilibrium time and larger adsorption capacity.
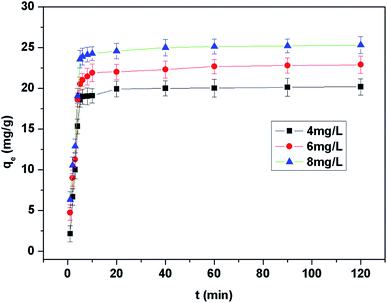 |
| | Fig. 9 The kinetic data for Hg(II) uptake by EDA–Fe3O4/GO-1 at different initial Hg(II) concentration. | |
The adsorption kinetics of Hg(II) onto EDA–Fe3O4/GO-1 was investigated with the Lagergren pseudo-first-order model (Fig. 10(A)), pesudo-second-order model (Fig. 10(B)), Elovich (Fig. 10(C)) and intra-particle diffusion (Fig. 10(D)), which are given as the following equations.
 |
| | Fig. 10 Fitting of Lagergren pseudo-first order (A), pseudo-second order (B), Elovich (C) and intra-particle diffusion (D) kinetic models for Hg(II) adsorption on EDA–Fe3O4/GO-1 under different initial concentrations (4 mg L−1, 6 mg L−1, 8 mg L−1) at room temperature. | |
The pesudo-first-order model follows:
| | |
ln(qe − qt) = lnqe − k1t
| (3) |
The pesudo-second-order model follows:
| |
 | (4) |
The Elovich model follows:
| |
 | (5) |
The intra-particle diffusion model follows:
| |
 | (6) |
where
qe and
qt are the sorption capacity (mg g
−1) at equilibrium and at time
t (min),
k is the rate constant,
h is the intial sorption rate in pseudo-second-order model, and
R2 is the correlation coefficients to express the uniformity between the experimental data and model-predicted values.
From the slope of Fig. 10(A), the Lagergren pseudo-first order rate constants k1 can be obtained. And the correlation coefficients R2 are in range of 0.9614–0.9914.
The pseudo-second order kinetic constant k2 and qe can be calculated from the intercept and slope of plots of t/qt vs. t (Fig. 11(B)). The calculated k2, qe (calc.), h, and R2 are presented in Table 3. The experimental data are in good agreement with the pseudo-second order model which suggests that the rate-limiting step in adsorption is controlled by chemcial process.69
 |
| | Fig. 11 (A) Effect of temperture on the adsorption capacity of EDA–Fe3O4/GO-1 for mercury; (B) adsorption thermodynamics of mercury adsorption on EDA–Fe3O4/GO-1. | |
Table 3 Kinetic parameters of various models fitted to experimental data
| Kinetic models |
Parameters |
Hg(II) (C0) (mg L−1) |
| 4.0 mg L−1 |
6.0 mg L−1 |
8.0 mg L−1 |
| Pseudo-first-order equation |
qe (exp.) (mg L−1) |
19.3426 |
22.2573 |
24.5683 |
| qe (calc.) (mg L−1) |
27.9124 |
29.0080 |
30.6012 |
| k1 (min−1) |
0.4923 |
0.4526 |
0.4320 |
| R2 |
0.9614 |
0.9833 |
0.9914 |
| Pseudo-second- order equation |
qe (calc.) (mg L−1) |
20.9512 |
23.0840 |
25.5690 |
| k2 (g (mg−1 min−1)−1) |
0.0134 |
0.0257 |
0.0357 |
| h (mg (mg−1 min−1)−1) |
5.8995 |
13.6735 |
23.3397 |
| R2 |
0.9972 |
0.9994 |
0.9996 |
| Elovich equation |
qe (calc.) (mg L−1) |
19.0777 |
21.8986 |
24.2626 |
| α (mg g−1 min−2) |
10.7745 |
15.1801 |
20.2386 |
| β (g (mg−1 min−1)−1) |
0.1209 |
0.1203 |
0.1174 |
| R2 |
0.8944 |
0.9097 |
0.9054 |
| Intra-particle diffusion equation |
qe (calc.) (mg L−1) |
18.4326 |
21.0433 |
21.3754 |
| k3 (mg g−1 min−1/2) |
0.3766 |
0.3476 |
0.3718 |
| C |
0.1125 |
0.1893 |
0.2246 |
| R2 |
0.9035 |
0.8830 |
0.8893 |
The Elovich eqn (5) used to interpret the predominantly chemical sorption on highly heterogeneous adsorption was also adsopted to fit the experimental data. Where α is the initial adsorption rate (mg g−1 min−2) and β is the desorption constant (g mg−1 min−1) related to the extent of surface coverage and activation energy for chemisorption. The Elovich constants α and β are calculated and given in Table 2. As depicted in Fig. 11(C), the plots of qt vs. ln(t) display relative good linear relationship before reaching the adsorption equilibrium.
The intra-particle diffusion eqn (6) describes the movement of ions from bulk solution to the solid phase. Where k3 is the intra-particle diffusion rate constant (mg g−1 min−1/2) which can be obtained from the slope of straight line (Fig. 10(D)), and C is a intra-particle diffusion rated constant related with the boundary layer thickness (mg g−1) which can be gained from the intercept of straight line. And the constant k3 and C are calculated and given in Table 3. As shown in Fig. 10(D), the plots of qt vs. t1/2 for Hg(II) are shown in two stages. The intra-particle diffusion rate constants C in this work are not zero which demonstrates that the adsorption process may not be mainly controll by intra-particle diffusion.70
From all the correlation coefficients (R2) and above analysis, we can conclude that the pseudo-second order is the most suitable kinetics model for adsorption of Hg(II) onto EDA–Fe3O4/GO-1, which also suggests that the adsorption process is controlled by chemical adsorption.
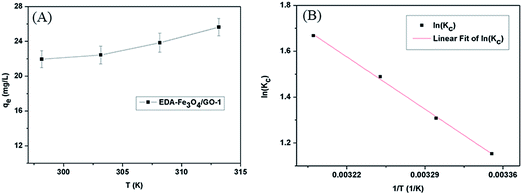
3.5 Thermodynamic parameters
Investigating the effect of temperature on the adsorption of Hg(II) by EDA–Fe3O4/GO-1 is necessary, as shown in Fig. 11(A). In any adsorption process, both energy and entropy should be considered so that we can determine if adsorption process will take place spontaneously. The change in free energy ΔG, enthalpy ΔH and entropy ΔS, associated with the adsorption process, can be calculated by using the following equations:| | |
ΔG = −RTlnK
| (7) |
| |
 | (8) |
where R is the gas constant (8.314 J mol−1 K−1), T is the absolute temperature (K), K(qe/Ce) is an equilibrium constant at various temperatures.71
The effects of temperature on adsorption were checked at pH 5.30, 298–313 K, and an initial mercury ion concentration of 4 mg L−1. ΔH and ΔS were calculated from the slope and intercept of the plot of lnK vs. 1/T (Fig. 11(B)). The changes of enthalpy ΔH and entropy ΔS at 298–313 K are determined to be 27.045 kJ mol−1, 100.182 J (mol−1 K−1) and the changes of free energy ΔG at 298 K is −2.857 kJ mol−1. The negative value of ΔG confirms that the adsorption is spontaneous. With the increase in temperature, the ΔG decreases. This suggests that the adsorption is more beneficial at high temperature. The positive value of ΔH reveals that the adsorption process is endothermic. This is also supported by the increased adsorption capacity of EDA–Fe3O4/GO-1 with the increase in temperature. This can be ascribed to the well hydrated Hg(II). When Hg(II) ions are adsorbed by adsorbent, they have to lose part of their hydration sheaths. This dehydration process needs much energy which surpasses the heat released from the adsorption reaction. The positive value of ΔS indicates the increased randomness of the entire system during the adsorption of Hg(II) on EDA–Fe3O4/GO-1.
3.6 Real water matrix and coexisted ions
In order to further evaluate the effects of different matrix on the removal efficiency of Hg(II), the river polluted by industrial wastewater and tap water spiked with 1 mg L−1 Hg(II) were used in the experiment. In addition to Ca, Mg, Na and K ions listed in Table 4, there are also low levels (several ppb) of Fe, Co and Ni ions existing in wastewater and tap water. The result given in Table 4 reveals that the removal efficiencies of Hg(II) are over 91.56% and inappreciably influenced by the real water matrix, which also indicates that the coexisting ions have little impact on the removal efficiency of Hg(II).
Table 4 The pH, main competing ions, and Hg(II) in water and the removal (%) after treating 50 mL of water with 0.1 g L−1 EDA–Fe3O4/GO-1
| Matrix |
pH |
Ca (ppm) |
Mg (ppm) |
Na (ppm) |
K (ppm) |
Co (ppm) |
Ni (ppm) |
Hg(II)initial (ppm) |
Hg(II)removal (%) |
| Tap water |
6.8 |
57.86 |
32.78 |
18.39 |
4.76 |
0.009 |
0.012 |
1.03 ± 0.06 |
96.72 ± 0.12 |
| River water |
6.3 |
63.24 |
30.53 |
34.28 |
7.93 |
0.018 |
0.021 |
1.05 ± 0.08 |
91.56 ± 0.21 |
3.7 Desorption and regeneration studies
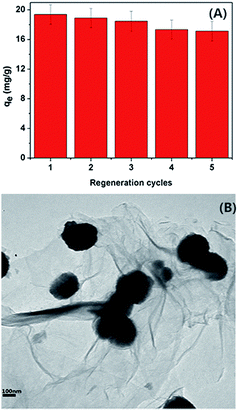
Desorption and regeneration performance of the EDA–Fe3O4/GO-1 are erxtremely important in consideration their practical application. The saturated EDTA has been chosen as the eluent in the study. After desorption, the EDA–Fe3O4/GO-1 was treated with deionized water to wash away the residual EDTA soulution and explored for Hg(II) adsorption in the succeeding cycles. As demonstrated in Fig. 12(A), the adsorption capacity of the EDA–Fe3O4/GO-1 nanocomposite for Hg(II) only desreased 1.17% after successive adsorption–desorption cycles. Consequently, the EDA–Fe3O4/GO-1 composites with the good regeneration performance and high stability could be effectively and economically used for the selectively treatment of Hg(II) contaminated wastewater. Moreover, it is worth noting that the EDA–Fe3O4/GO-1 almost keeps its original structure after five successive cycles of adsorption–desorption as shown in Fig. 12(B), compared to Fig. 4(A), which is believed to be responsible for its high cycling stability shown above.72 This result indicates that the adsorbent has sufficients chemical stability for the recovery of Hg(II) from aqueous solution.
 |
| | Fig. 12 (A) The recyclable adsorption of Hg(II) by EDA–Fe3O4/GO-1 nanocomposite (concentration of Hg(II) = 4 mg L−1, m = 8 mg (adsorbent amount), V = 40 mL). (B) TEM of EDA–Fe3O4/GO-1 composite after five successive cycles of desorption–adsorption. | |
3.8 Adsorption mechanisms
Batch adsorption experiments indicate that the Hg(II) adsorption capacity of EDA–Fe3O4/GO-1 was higher than that of EDA–Fe3O4/GO-2, EDA–Fe3O4/GO-3 and EDA–Fe3O4/GO-4. The Langmuir adsorption model agrees well with the experimental data. The monolayer saturation adsorption capacity (qm) of EDA–Fe3O4/GO for Hg(II) was also higher than that of GO and EDA–Fe3O4. To further investigate the adsorption mechanism, this might be explained as shown in Fig. 13. On the one hand, during adsorption the process, the amino/amide groups functionalized on EDA–Fe3O4/GO could form a cheating interaction with Hg(II), and graphene oxide exposure to large amounts of oxygen containing functional groups (e.g., –COOH, –CO and –OH) on the surface. On the other hand, TEM and SEM image indicate that the GO sheets could not only prevent agglomeration of the Fe3O4 microspheres and enable a good dispersion of these oxide microspheres, but also substantially enhance the specific surface area of the composite. The high surface area porous structure of Fe3O4 microspheres increased the adsorption site, which were beneficial to Hg(II) adsorption. In addition, the EDX spectra after adsorption were conducted to confirm the adsorption process. As shown in Fig. S1,† the high contents of lead element on Hg-loaded adsorbent witnessed the successful adsorption of Hg(II) by EDA–Fe3O4/GO-1, and the elemental analysis results of EDA–Fe3O4/GO-Hg as shown in Table S1.† The pseudo-second order is the most suitable kinetics model for adsorption of Hg(II) onto EDA–Fe3O4/GO-1, which also suggests that the adsorption process is controlled by chemical adsorption. The intra-particle diffusion rate constants C in this work are not zero which demonstrates that the adsorption process may not be mainly controll by intra-particle diffusion.
 |
| | Fig. 13 Schematic diagram of adsorption mechanism of EDA–Fe3O4/GO. | |
4. Conclusion
In this study, the synthesized EDA–Fe3O4/GO was successfully applied as a new sorbent in magnetic solid phase extraction for convenient, fast and efficient removal of Hg(II) ions from aqueous solution. The results indicated that the EDA–Fe3O4/GO nanocomposite showed an excellent adsorption capacity a high adsorption rate for Hg(II). The maximum adsorption capacity of EDA–Fe3O4/GO-1 for Hg(II) was 127.23 mg g−1 at 298 K. The effects of the experimental conditions, such as temperature, solution pH and contact time on the adsorption of Hg(II) on EDA–Fe3O4/GO-1 were systematically studied. High temperature and neutral pH were determined to be favorable for the adsorption. The GO sheets could not only prevent agglomeration of the Fe3O4 microspheres and enable a good dispersion of these oxide microspheres, but also substantially enhance the specific surface area of the composite, which was favorable for the removal of Hg(II). The kinetics and isotherm data fitted well with pseudo-second-order kinetics and Langmuir isotherm model. The adsorption reaction between Hg(II) and the EDA–Fe3O4/GO nanocomposite was determined to be a spontaneous endothermic process. In addition, the method takes advantage of both the adsorption capacity of the amine-functionalized graphene oxide and the convenience of magnetic phase separation at the same time. Therefore, the combination of the magnetic properties of the Fe3O4 microspheres and the superior properties of the GO sheets makes a powerful separation material to removal from wastewater.
Acknowledgements
The financial supports from National Natural Science Foundation of China (Grant No. 30900325) and Natural Science Foundation of Tianjin (Grant No. 13ZXCXSY14200) are well acknowledged.
References
- B. S. Inbaraj, J. Wang, J. Lu, F. Siao and B. Chen, Bioresour. Technol., 2009, 100, 200–207 CrossRef CAS PubMed.
- Y. Niu, R. Qu, C. Sun, C. Wang, H. Chen, C. Ji, Y. Zhang, X. Shao and F. Bu, J. Hazard. Mater., 2013, 244, 276–286 CrossRef PubMed.
- M. A. Tofighy and T. Mohammadi, J. Hazard. Mater., 2011, 185, 140–147 CrossRef CAS PubMed.
- H. Deligöz and E. Erdem, J. Hazard. Mater., 2008, 154, 29–32 CrossRef PubMed.
- A. Rezvani-Boroujeni, M. Javanbakht, M. Karimi, C. Shahrjerdi and B. Akbari-adergani, Ind. Eng. Chem. Res., 2014, 54, 502–513 CrossRef.
- J. A. Arcibar-Orozco, J. R. Rangel-Mendez and P. E. Diaz-Flores, Water, Air, Soil Pollut., 2015, 226, 1–10 CrossRef.
- M. E. Mahmoud, M. F. Amira, A. A. Zaghloul and G. A. Ibrahim, Chem. Eng. J., 2016, 293, 200–206 CrossRef CAS.
- S. Nayab, A. Farrukh, Z. Oluz, E. L. Tuncel, S. R. Tariq, H. U. Rahman, K. Kirchhoff, H. Duran and B. Yameen, ACS Appl. Mater. Interfaces, 2014, 6, 4408–4417 CAS.
- O. Akhavan, Carbon, 2010, 48, 509–519 CrossRef CAS.
- O. Akhavan and E. Ghaderi, ACS Nano, 2010, 4, 5731–5736 CrossRef CAS PubMed.
- M. L. Knetsch and L. H. Koole, Polymers, 2011, 3, 340–366 CrossRef CAS.
- D. S. Su, S. Perathoner and G. Centi, Chem. Rev., 2013, 113, 5782–5816 CrossRef CAS PubMed.
- T. Raj kumar, K. J. Babu, D. J. Yoo, A. R. Kim and G. G. Kumar, RSC Adv., 2015, 5, 41457–41467 RSC.
- P. A. Bedekar, S. D. Kshirsagar, A. R. Gholave and S. P. Govindwar, RSC Adv., 2015, 5, 99228–99239 RSC.
- G. G. Kumar, K. Justice Babu, K. S. Nahm and Y. J. Hwang, RSC Adv., 2014, 4, 7944 RSC.
- M. Ranjani, Y. Sathishkumar, Y. S. Lee, D. Jin Yoo, A. R. Kim and G. G. Kumar, RSC Adv., 2015, 5, 57804–57814 RSC.
- M. Vinothkannan, C. Karthikeyan, G. G. Kumar, A. R. Kim and D. J. Yoo, Spectrochim. Acta, Part A, 2015, 136, 256–264 CrossRef CAS PubMed.
- H.-P. Jing, C.-C. Wang, Y.-W. Zhang, P. Wang and R. Li, RSC Adv., 2014, 4, 54454–54462 RSC.
- P. K. Boruah, P. Borthakur, G. Darabdhara, C. K. Kamaja, I. Karbhal, M. V. Shelke, P. Phukan, D. Saikia and M. R. Das, RSC Adv., 2016, 6, 11049–11063 RSC.
- N. Senthilkumar, K. J. Babu, G. G. Kumar, A. R. Kim and D. J. Yoo, Ind. Eng. Chem. Res., 2014, 53, 10347–10357 CrossRef CAS.
- M. S. Mauter and M. Elimelech, Environ. Sci. Technol., 2008, 42, 5843–5859 CrossRef CAS PubMed.
- K. S. Novoselov, A. K. Geim, S. Morozov, D. Jiang, Y. Zhang, S. A. Dubonos, I. Grigorieva and A. Firsov, Science, 2004, 306, 666–669 CrossRef CAS PubMed.
- A. Tayyebi and M. Outokesh, RSC Adv., 2016, 6, 13898–13913 RSC.
- M. Yusuf, F. Elfghi, S. A. Zaidi, E. Abdullah and M. A. Khan, RSC Adv., 2015, 5, 50392–50420 RSC.
- P. Wang, Q. Shi, Y. Shi, K. K. Clark, G. D. Stucky and A. A. Keller, J. Am. Chem. Soc., 2008, 131, 182–188 CrossRef PubMed.
- S. Zhang, H. Li, Z. Wang, J. Liu, H. Zhang, B. Wang and Z. Yang, Nanoscale, 2015, 7, 8495–8502 RSC.
- Y. Liu, C. Luo, G. Cui and S. Yan, RSC Adv., 2015, 5, 54156–54164 RSC.
- X. Bai, R. Feng, Z. Hua, L. Zhou and H. Shi, Environ. Eng. Sci., 2015, 32, 370–378 CrossRef CAS.
- F. Gu, M. Liang, D. Han and Z. Wang, RSC Adv., 2015, 5, 39964–39972 RSC.
- M. Liu, T. Wen, X. Wu, C. Chen, J. Hu, J. Li and X. Wang, Dalton Trans., 2013, 42, 14710–14717 RSC.
- P. Bhunia, G. Kim, C. Baik and H. Lee, Chem. Commun., 2012, 48, 9888–9890 RSC.
- Y. Yoon, W. K. Park, T.-M. Hwang, D. H. Yoon, W. S. Yang and J.-W. Kang, J. Hazard. Mater., 2016, 304, 196–204 CrossRef CAS PubMed.
- H. Sun, L. Cao and L. Lu, Nano Res., 2011, 4, 550–562 CrossRef CAS.
- S. Bahar and F. Karami, J. Iran. Chem. Soc., 2015, 12, 2213–2220 CrossRef CAS.
- R. A. Bini, R. F. C. Marques, F. J. Santos, J. A. Chaker and M. Jafelicci, J. Magn. Magn. Mater., 2012, 324, 534–539 CrossRef CAS.
- L. Wang, J. Bao, L. Wang, F. Zhang and Y. Li, Chem.–Eur. J., 2006, 12, 6341–6347 CrossRef CAS PubMed.
- A. P. Herrera, C. Barrera and C. Rinaldi, J. Mater. Chem., 2008, 18, 3650 RSC.
- K. C. Barick, M. Aslam, P. V. Prasad, V. P. Dravid and D. Bahadur, J. Magn. Magn. Mater., 2009, 321, 1529–1532 CrossRef CAS PubMed.
- N. Guan, J. Xu, L. Wang and D. Sun, Colloids Surf., A, 2009, 346, 221–228 CrossRef CAS.
- M. Nickels, J. Xie, J. Cobb, J. C. Gore and W. Pham, J. Mater. Chem., 2010, 20, 4776 RSC.
- S. Singh, K. C. Barick and D. Bahadur, J. Hazard. Mater., 2011, 192, 1539–1547 CrossRef CAS PubMed.
- W. S. Hummers Jr and R. E. Offeman, J. Am. Chem. Soc., 1958, 80, 1339 CrossRef.
- X. Xin, Q. Wei, J. Yang, L. Yan, R. Feng, G. Chen, B. Du and H. Li, Chem. Eng. J., 2012, 184, 132–140 CrossRef CAS.
- K. Ouyang, C. Zhu, Y. Zhao, L. Wang, S. Xie and Q. Wang, Appl. Surf. Sci., 2015, 355, 562–569 CrossRef CAS.
- Y.-F. Sun, W.-K. Chen, W.-J. Li, T.-J. Jiang, J.-H. Liu and Z.-G. Liu, J. Electroanal. Chem., 2014, 714, 97–102 CrossRef.
- Y. Sun, D. Shao, C. Chen, S. Yang and X. Wang, Environ. Sci. Technol., 2013, 47, 9904–9910 CrossRef CAS PubMed.
- Y.-X. Ma, Y.-F. Li, G.-H. Zhao, L.-Q. Yang, J.-Z. Wang, X. Shan and X. Yan, Carbon, 2012, 50, 2976–2986 CrossRef CAS.
- S. Alwarappan, A. Erdem, C. Liu and C.-Z. Li, J. Phys. Chem. C, 2009, 113, 8853–8857 CAS.
- X. Sun, C. Zheng, F. Zhang, Y. Yang, G. Wu, A. Yu and N. Guan, J. Phys. Chem. C, 2009, 113(36), 16002–16008 CAS.
- F. Zhang, Y. Song, S. Song, R. Zhang and W. Hou, ACS Appl. Mater. Interfaces, 2015, 7, 7251–7263 CAS.
- L. Guo, P. Ye, J. Wang, F. Fu and Z. Wu, J. Hazard. Mater., 2015, 298, 28–35 CrossRef CAS PubMed.
- L. Cui, Y. Wang, L. Gao, L. Hu, L. Yan, Q. Wei and B. Du, Chem. Eng. J., 2015, 281, 1–10 CrossRef CAS.
- W. J. Weber and J. C. Morris, J. Sanit. Eng. Div., 1963, 89, 31–60 Search PubMed.
- Y. Liu, X. Chang, D. Yang, Y. Guo and S. Meng, Anal. Chim. Acta, 2005, 538, 85–91 CrossRef CAS.
- F.-S. Zhang, J. O. Nriagu and H. Itoh, Water Res., 2005, 39, 389–395 CrossRef CAS PubMed.
- B. Nandi, A. Goswami and M. Purkait, Appl. Clay Sci., 2009, 42, 583–590 CrossRef CAS.
- Y. Takagai, A. Shibata, S. Kiyokawa and T. Takase, J. Colloid Interface Sci., 2011, 353, 593–597 CrossRef CAS PubMed.
- J. Goel, K. Kadirvelu, C. Rajagopal and V. K. Garg, J. Chem. Technol. Biotechnol., 2005, 80, 469–476 CrossRef CAS.
- B. C. Kim, J. Lee, W. Um, J. Kim, J. Joo, J. H. Lee, J. H. Kwak, J. H. Kim, C. Lee and H. Lee, J. Hazard. Mater., 2011, 192, 1140–1147 CrossRef CAS PubMed.
- A. Walcarius, M. Etienne and B. Lebeau, Chem. Mater., 2003, 15, 2161–2173 CrossRef CAS.
- Y. Zhang, R. Qu, C. Sun, C. Wang, C. Ji, H. Chen and P. Yin, Appl. Surf. Sci., 2009, 255, 5818–5826 CrossRef CAS.
- M. Mureseanu, A. Reiss, N. Cioatera, I. Trandafir and V. Hulea, J. Hazard. Mater., 2010, 182, 197–203 CrossRef CAS PubMed.
- H. Parham, B. Zargar and R. Shiralipour, J. Hazard. Mater., 2012, 205, 94–100 CrossRef PubMed.
- R. Qu, Y. Zhang, W. Qu, C. Sun, J. Chen, Y. Ping, H. Chen and Y. Niu, Chem. Eng. J., 2013, 219, 51–61 CrossRef CAS.
- J. Chen, R. Qu, Y. Zhang, C. Sun, C. Wang, C. Ji, P. Yin, H. Chen and Y. Niu, Chem. Eng. J., 2012, 209, 235–244 CrossRef CAS.
- A. Farrukh, A. Akram, A. Ghaffar, S. Hanif, A. Hamid, H. Duran and B. Yameen, ACS Appl. Mater. Interfaces, 2013, 5, 3784–3793 CAS.
- Y. Niu, H. Liu, R. Qu, S. Liang, H. Chen, C. Sun and Y. Cui, Ind. Eng. Chem. Res., 2015, 54, 1656–1664 CrossRef CAS.
- Z. Chen, L. Zhou, F. Zhang, C. Yu and Z. Wei, Appl. Surf. Sci., 2012, 258, 5291–5298 CrossRef CAS.
- Y.-F. Lin, H.-W. Chen, P.-S. Chien, C.-S. Chiou and C.-C. Liu, J. Hazard. Mater., 2011, 185, 1124–1130 CrossRef CAS PubMed.
- R. Sheha and A. El-Zahhar, J. Hazard. Mater., 2008, 150, 795–803 CrossRef CAS PubMed.
- Z.-Y. Yao, J.-H. Qi and L.-H. Wang, J. Hazard. Mater., 2010, 174, 137–143 CrossRef CAS PubMed.
- L. Li, L. Fan, M. Sun, H. Qiu, X. Li, H. Duan and C. Luo, Colloids Surf., B, 2013, 107, 76–83 CrossRef CAS PubMed.
Footnote |
| † Electronic supplementary information (ESI) available. See DOI: 10.1039/c6ra16904j |
|
| This journal is © The Royal Society of Chemistry 2016 |
Click here to see how this site uses Cookies. View our privacy policy here.