Mesoporous strontium doped nano sized sulphate hydroxyapatite as a novel biomaterial for bone tissue applications†
Ammar Z. Alshemary*,
Ahmet Engin Pazarceviren,
Aysen Tezcaner and
Zafer Evis
Engineering Sciences, Middle East Technical University, Ankara 06800, Turkey. E-mail: am84ch@gmail.com; ammar@metu.edu.tr; Tel: +90 312-210 2395
First published on 11th July 2016
Abstract
In this study a novel nano-structured hydroxyapatite (HA) incorporated with different fractions of Sr2+ and SO42− ions has been synthesized using the wet precipitation method and characterized. This study explored the potential benefits of dual doping of Sr2+ and SO42− ions for the first time, which would contribute to bone prosthetics' clinical success. The substitution of Sr2+ and SO42− ions into the HA crystal structure was confirmed using XRD, FTIR, Raman spectroscopy, FESEM, BET and XPS techniques. Fetal Bovine Serum (FBS) was used as a model protein for adsorption assay. FBS revealed higher affinity towards Sr-SHA materials rather than pure HA. In vitro bioactivity studies showed that the HA dissolution rate increased with incorporation of Sr2+ and SO42− ions in the HA structure. The highest dissolution rate was recorded on the 1st day of immersion in Simulated Body Fluid (SBF) for SHA and Sr-SHA groups. Intense growth of apatite grains on the surface of Sr-SHA with Ca/P ratio of (1.41–1.64) was observed after 14 days of incubation in SBF. In vitro cytotoxicity studies conducted with Sarcoma Osteogenic (Saos-2) cells showed that Sr-SHA was cytocompatible. It was observed that Sr-SHA promoted cell adhesion, spreading and proliferation of Saos-2 cells compared to pure HA. Saos-2 cells seeded on Sr-SHA had statistically higher alkaline phosphatase (ALP) activity and intracellular calcium deposition compared to HA. Collectively, our results showed that Sr-SHA materials with enhanced bioactivity, cytocompatibility and osteogenic activity hold great potential to be used as materials for bone tissue regeneration.
1. Introduction
Biomaterials have helped to improve the quality of life of patients and are constantly being used to overcome various orthopedic and surgical disorders including trauma injuries, osteoporosis and critical defects.1 Utilization of biomaterials has significantly increased the lifetime of patients suffering from large bone defects, however the chief enhancements are still awaited to improve the biological and physicochemical properties of biomaterials to mimic the natural bone.2An ideal biomaterial should be highly biocompatible to avoid infections that can cause serious health issues and at the same time it should be bioactive so it can expedite tissue regeneration. The increasing demand of these artificial bone materials is continuously provoking scientists to explore novel materials with superior properties which may be able to replace the existing inferior material. Calcium phosphate (CP) based materials have been in use for bone replacement and augmentation due to their resemblance with the natural hard tissues.3 Synthetic hydroxyapatite (HA, Ca10(PO4)6(OH)2) is a stoichiometric apatite with a Ca/P ratio of 1.67. HA is considered as one of the most important phases of the CP group due to its similarity to the human bone mineral4 and because of its excellent biocompatibility behavior.5
The biological apatite is a non-stoichiometric apatite (Ca/P ratio of ≤1.67) with a poor crystalline structure, which was attributed to co-incorporated different ions on trace levels, such as (Na+, Sr2+, Mg2+, Zn2+, SiO44−, SO42−, F−, etc.)6,7 and it significantly varies from synthetic HA. These ions play a vital role in biochemical reactions associated with bone metabolism.7 Absence of these trace ions in the synthetic HA may lead to obtaining an inferior bone repair material which has a low ability to promote bone formation and resorption by bone cells.7 To overcome these issues, ionic substitution with different types of essential ions into HA structure is done to mimic the biochemistry of biological HA. However, single doped HA has been widely reported and deeply investigated in various studies.8–10 Dual substitution where two different ions are incorporated into HA structure is still a hot subject for research groups. Improving the resorption rate and surface activity of HA can help the investigator to improve the biological properties of HA and tailor them towards the desired objectives. Along these lines, a novel composition of HA substituted with different fractions of SO42− and Sr2+ ions have been synthesized and characterized in this study. We believe that the incorporation of these ions may play an essential role to improve the biological properties of synthetic HA and this new composition can mimic the biological HA more closely.
Sulphur is an important part of different amino acids like methionine and cysteine. It is one of the amino acids in the composition of antioxidants like glutathione.11 Sulphate (SO42−) compounds such as calcium sulphate (CaSO4) which is considered as safe and bioactive implant material12 has been used as filler material for bone imperfections for over 100 years13,14 and as carrier material for drug delivery.15 Barium sulphate (BaSO4), another sulphate based biocompatible material was used to support in vitro osteoblast proliferation.16 These interesting applications make it a necessary ion to take into consideration as to enhance the properties of the supplements and especially the bone substitution materials. However, synthesis of sulphate doped HA is rarely reported, however, these studies have mainly focused on the synthesis and structural characterization of the materials.17,18 Similarly, strontium (Sr2+) ion has been reported as beneficial for bone growth where its low dosage helps in enhancing bone mass and volume.19 Moreover, it increases the osteogenic differentiation of mesenchymal stem cells and enhances the functionality of the osteoblasts.20 Furthermore, Sr2+ ion can balance the bone formation and resorption processes in vivo.21,22 Positive effect of Sr2+ ion doped HA on bone regeneration has been reported by different groups.23–26 Therefore, it is assumed that co-substitution of SO42− and Sr2+ ions in the HA structure will not only stimulate proliferation, but also enhances the differentiation of osteoblasts which will improve the bone regeneration more effectively than the conventional HA.
2. Materials and methods
2.1. Preparation of Sr-SHA samples
Calcium nitrate tetrahydrate (Ca(NO3)2·4H2O) (Merck, Germany), di-ammonium hydrogen phosphate ((NH4)2HPO4) (Merck, Germany), sodium sulphate (Na2SO4) (Merck, Germany) and strontium nitrate (Sr(NO3)2) (Merck, Germany) were used as Ca2+, PO43−, SO42− and Sr2+ sources, respectively. Ammonia solution (NH4OH) (Merck, Germany) was used to adjust the pH.A mixture of Ca(NO3)2·4H2O (1 − x M) and different fractions of Sr(NO3)2 (x M) was prepared in 200 ml of double distilled water (DDW) to prepare solution A. A mixture of ((NH4)2HPO4) (0.6 − y M) and (y M) of (Na2SO4) was prepared in 200 ml of DDW to obtain solution B. The Ca/P ratio was kept at 1.67 to produce stoichiometric HA. The solution B was added dropwise to a solution A under constant stirring, the resulting mixture was stirred at room temperature for 30 min during which the pH was maintained at 10 by adding NH4OH solution. The reaction mixture was heated at 90 °C for 1 h, then stirred for 24 h at room temperature. The solution was filtered through a fine filter paper and washed several times to remove the remaining ammonia. The filtered wet cake was dried at 80 °C in an oven overnight to remove the excess water. Finally, dried HA particles were ground to fine powder and calcined in a muffle furnace at 700 °C for 2 h. Sr-SHA samples prepared according to eqn (1) in this study are listed in Table 1.
| 10 − xCa2+ + xSr2+ + 6 − yPO43− + ySO42− + 2 − yOH− → Ca10−xSrx(PO4)6−y(SO4)y(OH)2−y | (1) |
| Sample ID | Reactants (mole) | |||
|---|---|---|---|---|
| Ca2+ | PO43− | SO42− | Sr2+ | |
| HA | 1.00 | 0.60 | 0.00 | 0.00 |
| SHA | 1.00 | 0.55 | 0.05 | 0.00 |
| 1Sr-SHA | 0.98 | 0.55 | 0.05 | 0.02 |
| 2Sr-SHA | 0.94 | 0.55 | 0.05 | 0.06 |
| 3Sr-SHA | 0.90 | 0.55 | 0.05 | 0.10 |
2.2. Characterization
Phase purity of all powders was examined by using X-ray diffractometer (XRD, Rigaku Ultima IV) operated at 40 kV and 30 mA utilizing CuKα radiation, at a step size of 0.02° and step time of 1 s. All diffractograms were obtained in the range (20–80°) of 2θ angles. The degree of crystallinity was calculated according to the fraction of crystalline phase available in the analysed volume from X-ray diffraction data using eqn (2):27,28| XC = 1 − (V1 1 2/3 0 0/I3 0 0) × 100 | (2) |
The average crystallite size was calculated using Scherrer's equation (eqn (3)):29
D = 0.9λ/β![[thin space (1/6-em)]](https://www.rsc.org/images/entities/char_2009.gif) cos cos![[thin space (1/6-em)]](https://www.rsc.org/images/entities/char_2009.gif) θ θ
| (3) |
Lattice parameters (a and c) and cell volume (V) of the Sr-SHA materials were calculated by using the UnitCell program of Holland and Redfern.30,31
Functional groups of entire materials were identified by Fourier transform infrared spectroscopy (FTIR, Bruker IFS66/S). Raman spectra of the samples were recorded using a spectrometer (Bruker FRA 106/S) with excitation at 514 nm. The surface topologies and diameter of Sr-SHA composites were examined through field emission scanning electron microscopy (FESEM, Quanta 400F). To evaluate the particle size distribution, size of the particles were measured in 100 random locations in FESEM image using image analysis software ImageJ (National Institutes of Health, USA). Specific surface area (SSA), pore volume and pore diameter of the materials were measured by using Brunauer, Emmett and Teller (BET-Multiple point, Quantachrome Corporation – Autosorb 6). X-ray phosphorous spectrometer (XPS, PHI 5000) was used as a quantitative tool to determine the chemical composition of the samples.
2.3. Disc shaping and sterilization
Samples (300 mg) were uniaxially pressed into discs (14 mm × 1 mm) by using automatic hydraulic machine [Carver, Inc.] at 10 kN load, then sintered at 700 °C for 2 h. Discs were sterilized by dry heat method (2 h holding time at 200 °C) in a sealed container prior to use in the in vitro tests (in vitro bioactivity test, in vitro protein adsorption and in vitro cell culture studies).2.4. In vitro bioactivity test
Simulated body fluid (SBF) was prepared according to the procedure reported by Kokubo and Takadama.32 The discs were placed in 50 mL SBF and incubated at 37 °C in a shaking water bath for 14 days. At different incubation periods discs were removed gently from SBF, washed with 50 mL DDW, then with 20 mL ethanol and dried at room temperature. FESEM was used to study the morphology of the apatite layer formed on the disc surface, while the Ca/P ratio of the newly formed apatite layer was estimated using EDX attachment of FESEM. Filtrate of SBF aliquots (n = 3) was analysed by inductively coupled plasma mass spectrometry (ICP-MS, Perkin Elmer model DRC II) to determine the amount of Ca2+, Sr2+and S6+ ions released. pH of the filtrate was recorded by using a pH meter (Thermo Orion 3 Star).2.5. In vitro protein adsorption
The protein adsorption assay was conducted using Fetal Bovine Serum (FBS, Marka-ülke). The compressed discs were immersed in 5 ml of FBS solution (3 mg ml−1) prepared in Phosphate Buffered Saline (PBS, 0.1 M, pH 7.4). The solution was kept under shaking incubator (100 rpm) for 24 h at 37 °C under 5% CO2 atmosphere. The amount of residual serum protein in the supernatant was determined using bicinchoninic acid assay using the calibration constructed with bovine serum albumin. The amount of FBS (mg) adsorbed on disc surface was calculated according to (eqn (4)):
 | (4) |
2.6. In vitro cell culture studies
In vitro cell culture studies were conducted using Human Osteosarcoma Cell Line (Saos-2, ATCC). Saos-2 cells were cultured in cell culture medium consisting phenol red-free Dulbecco's MEM supplemented with 10% FBS and 100 units penicillin/streptomycin at 37 °C in 5% CO2 atmosphere in carbon dioxide incubator (5215 Shel Lab., Cornelius, OR, USA). After reaching 80% confluency, cells were sub cultured using 0.1% of Trypsin/EDTA solution.The morphology of cells seeded on discs after 1 and 7 days of incubations was examined by FESEM. At days 1 and 7, the discs were removed gently and rinsed 3 times with PBS, then dehydrated with graded ethanol-water solution series (50%, 60%, 70%, 80% and absolute). Cells were then fixed with 4% paraformaldehyde solution and kept in hexamethyldisilazane (HMDS) for 1 h. The experiments were conducted in duplicates for each group.
Briefly, 2 × 10⁴ cells/50 μL were seeded on each disc. The seeded discs were incubated in growth medium (DMEM supplemented with 10% FBS, 1% penicillin-streptomycin) for 3 days to ensure cell proliferation. On 3rd day, the discs were removed and washed 3 times with PBS and then incubated in osteogenic differentiation medium (DMEM containing 10% FBS, 1% penicillin–streptomycin, 50 μg mL−1 ascorbic acid, 10 mM β-glycerophosphate and 10−8 M dexamethasone) for 14 days. The media were refreshed in 2 day intervals. At the end of 7 and 14 days, ALP activity of the cells was analysed with the ALP detection kit (Abcam, UK). Cell-free discs served as negative controls. ALP activity of the cells was expressed in terms of specific activity (nmol ALP per mg protein per min). Protein contents of the lysates were determined by μBCA assay according to the manufacturer's instructions using the calibration curve constructed with bovine serum albumin (BSA). The enzyme activity of cells was given in terms of specific enzyme activity.
Furthermore, the intracellular calcium concentration was measured by o-cresopthalein assay. Shortly, an aliquot (20 μL) of the cell lysate from each sample was mixed with 200 μL of o-cresopthalein and 8 hydroxyquinone-5-sulfonic acid in 2-amino-2-methyl-1,3-propanediol. The intensity of the colour was measured at 560 nm using Microplate Reader to determine intracellular calcium concentration. Different concentrations of CaCl2·2H2O (0 to 250 μg mL−1) solution were used to construct the calibration curve for this assay. Intracellular calcium activity was normalized with their respective cellular total protein amounts determined by μBCA assay as described above.
2.7. Statistical analysis
Data were statistically analysed with one-way analysis of variance (ANOVA) with Tukey's post hoc test for multiple comparisons using SPSS software (ver. 23.0; IBM Corporation, NY, USA). Differences were considered significant at p ≤ 0.05. The results are expressed as mean ± standard deviation (SD).3. Results and discussion
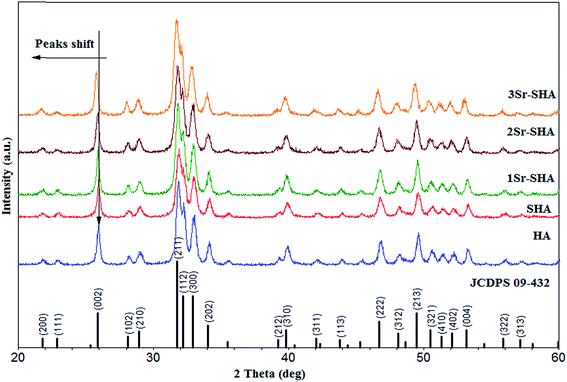
The XRD patterns of Sr-SHA series are shown in Fig. 1. All the patterns are in good agreement with standard HA (JCDPS no: 09-432), as they showed no peak corresponding to other phases such as (βTCP, CaO, etc.). XRD patterns indicated that Sr-SHA samples exhibited the phase purity and the apatite characteristics with good crystal structure. However, with an incorporation of SO42− ion reduction in peak intensities along with expansion in the peak width was observed, suggesting that crystallite size and crystallinity of HA particles had deteriorated.18 Furthermore, the incorporation of SO42− ion showed no peak shifting for that no obvious change was observed in the lattice parameter of SHA (Table 2).| Sample ID | Lattice parameters | D (nm) | XC (%) | ||
|---|---|---|---|---|---|
| a (Å) ±SD | c (Å) ±SD | V (Å)3 | |||
| HA | 9.4181 ± 6 × 10⁻⁴ | 6.8845 ± 5 × 10⁻⁴ | 528.85 | 28.15 | 78 |
| SHA | 9.4183 ± 8 × 10⁻⁴ | 6.8846 ± 6 × 10⁻⁴ | 528.88 | 26.75 | 70 |
| 1Sr-SHA | 9.4234 ± 8 × 10⁻⁴ | 6.8890 ± 5 × 10⁻⁴ | 529.79 | 25.33 | 66 |
| 2Sr-SHA | 9.4386 ± 7 × 10⁻⁴ | 6.8997 ± 6 × 10⁻⁴ | 532.32 | 24.68 | 62 |
| 3Sr-SHA | 9.4511 ± 7 × 10⁻⁴ | 6.9143 ± 6 × 10⁻⁴ | 534.86 | 22.90 | 60 |
Furthermore, our results revealed that incorporation of Sr2+ ion showed typical HA peaks with no additional mineral phase and the peaks observed were also in agreement with standard Sr-HA (JCDPS 34-0484). The XRD pattern showed that with an incorporation of Sr2+ and SO42− an increase in their width and little shifting towards lower theta occurred which means that the material is becoming amorphous and crystal expanded along with a and c axis (Table 2). This behaviour could be due to the replacement of Ca2+ ions (0.99 Å) with larger sized Sr2+ ions (1.12 Å). Furthermore, our result which was in line with previous results of the Sr2+ doped HA refinements conducted using the Rietveld method, demonstrated that the Sr2+ ion substitution for Ca2+ was approved by the linear increase of the unit cell parameters of HA along with a reduced degree of crystallinity.25 Same results have been reported and confirmed later by ref. 33.
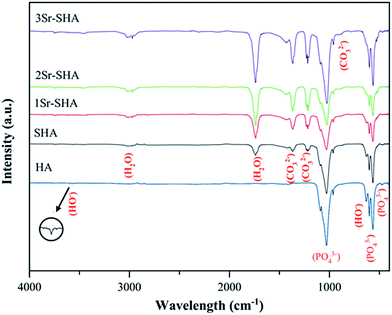
The FTIR spectra of Sr-SHA powders contained characteristic vibrational bands of apatite structure (Fig. 2). The absorption peak at 474 cm−1 belonged to the bending mode of (υ2) O–P–O and two peaks located at 565 and 601 cm−1 were attributed to the bending mode of (υ4) O–P–O. Similarly, absorption peak positioned at 963 cm−1 was assigned to the bending mode of (υ1) P–O and two absorption peaks at around 1029 and 1090 cm−1 were attributed to the stretching mode of (υ3) P–O. Two bands around 631 and 3575 cm−1, which can be attributed to the bending and stretching mode of OH group, respectively. However, a peak located at 1460 cm−1 was assigned to B-type CO32−substitution of the carbonate group34 which may be due to the absorbed CO2 through the preparation process.
Incorporation of SO42− ions into the HA structure had a notable effect on the FTIR of HA. The intensity of PO43− peaks decreased upon the incorporation of SO42− ions and the peaks became broader, confirming the formation of SO42− doped HA with a reduced degree of crystallinity (Table 2). Absorption bands of SO4 stretching were not detected in FTIR due to overlapping with an absorption band of (υ3) P–O.35 However, special peak assigned to the symmetric S–O stretching mode (υ1) was detected at about 1007 cm−1 using Raman spectra (Fig. S1†).36 Intensity of OH− band decreased as the doping of SO42− ions increased inside the HA lattice due to the partial replacement of OH− by SO42− of HA lattice to overcome charge compensation of substitution of PO43− by SO42−, thus resulting in the weak of OH− signal.37 Furthermore, another absorption peak was detected around 1736 cm−1, which was attributed to absorbed water. Moreover, absorption bands of carbonate group have been detected at 1216, 1368 and 1420 cm−1 were ascribed to A and B-type substitution.
Incorporation of Sr2+ ions in SHA structure showed a similar FTIR spectra with the pure HA. The effect of increased concentration of Sr2+ ions was observed on the FTIR spectra and results indicated that an increasing Sr2+ amount showed a shifting in the bending mode of (υ1) phosphate groups at 963 cm−1 towards lower wave numbers to 961 cm−1 (1Sr-HA), 960 cm−1 (2Sr-HA), 958 cm−1 (3Sr-HA). However, shifting of phosphate group was considered as a clear indication for the incorporation of Sr2+ ion in SHA structure and this shifting could be attributed primarily to the effect of decreased anion–anion repulsion concomitant with increased lattice dimensions (Table 2).25,38 An increasing Sr2+ ion led to increase in absorption bands of absorbed water and carbonate group. The decrease in crystallinity was observed by a loss in the resolution and in the broadening of the phosphate absorption bands. FTIR study was in good agreement with XRD observations.
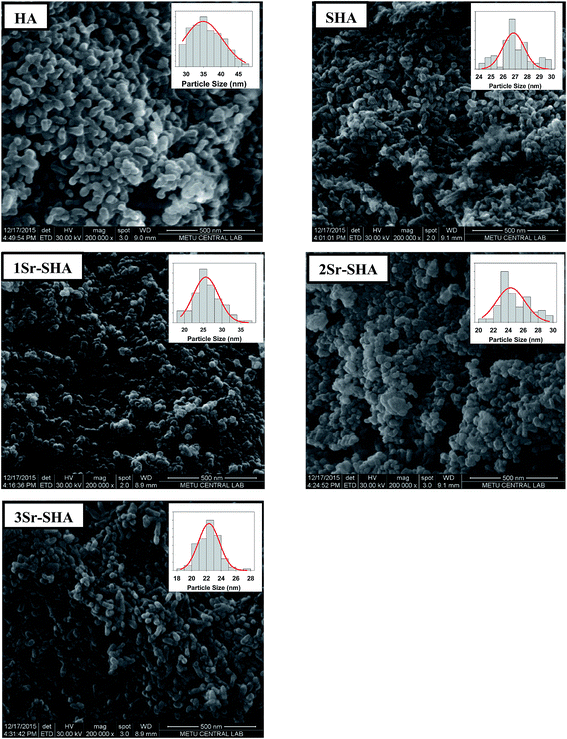
SEM micrographs and particle size distribution of Sr-SHA series are presented in Fig. 3. It was observed that Sr-SHA materials contained nano spherulite agglomerates, demonstrating that the substitution of SO42− and Sr2+ had no noteworthy effect on the morphology of HA particles. However, considerable reduction in HA particle size was observed with the incorporation of Sr2+ and SO42− ions. Particle size of SHA decreased with the increase in Sr2+ doping, a trend which is usually associated with the loss in degree of crystallinity (Table 2). Size of particles measured from the SEM images was higher than the size calculated by using Scherrer equation (Table 2) because particles observed by SEM could in fact be an agglomerate of several small particles.39
The specific surface area (SSA), pore volume and pore diameter of the Sr-SHA materials are summarized in Table 3. Synthetic HA has shown SSA of at about 40.26 m2 g−1 which was lower than SSA of biological HA (∼110 m2 g−1).40,41 However, incorporation of SO42− ion in HA structure helped to expand the SSA to 53.31 m2 g−1 for SHA and increased in SSA could be indexed to the reduction in crystallite size of SHA with respect to HA. On the other hand, Sr2+ ion substitution resulted firstly with a decrease in the SSA to 47.51 m2 g−1 for 1Sr-SHA, then in an increase to the highest value (53.88 m2 g−1) for 2Sr-SHA, finally decreased again to 42.84 m2 g−1 for 3Sr-SHA. These fluctuations in the SSA value could probably be attributed to the different particle sizes (Fig. 3). However, in general incorporations of Sr2+ and SO42− ions in HA structure furnish a large SSA in comparison with HA. Sr-SHA with large SSA has the potential to enhance the ingrowth of blood vessels and bone42 as well as improved loading of proteins and drugs.43 Besides these SSA results were also supported by pore volume measurements. The pore volume increased gradually with incorporation of Sr2+ and SO42− in HA structure. It is known that large pore volume provides a large accessible pore volume for the adsorption and encapsulation of different sizes of biomolecules.44 However, the average pore diameter of HA nanoparticles decreased with the incorporation of Sr2+ and SO42− ions. Sr-SHA nanoparticles with a nano porous shell are considered to be a promising candidate for drug delivery applications, whereas the mesoporous distributed on material surface acts as gatekeepers to control the in-and-out of the guest molecules.45
| Sample ID | Surface area (m2 g−1) | Pore V (cc g−1) | Pore size (Å) | Pore interconnectivity (%) |
|---|---|---|---|---|
| HA | 40.26 | 0.21 | 35.39 | 16 |
| SHA | 53.31 | 0.27 | 34.98 | 22 |
| 1Sr-SHA | 47.51 | 0.24 | 33.76 | 25 |
| 2Sr-SHA | 53.88 | 0.27 | 35.27 | 26 |
| 3Sr-SHA | 42.84 | 0.22 | 35.00 | 28 |
The pore interconnectivity of Sr-SHA discs was calculated based on equations reported by46,47 (eqn (1)–(4)S†) and data are presented in Table 3. Incorporation of SO42− and Sr2+ ions in HA structure resulted with a larger fraction of interconnected pores comparing to pure HA. Similar observation has been reported by Ke et al.48. They showed that the pore interconnectivity was improved with an incorporation of 1 wt% SrO into calcium phosphates. Interconnected pores in the implant can facilitate osteocyte and neovascularized ingrowths,48 furthermore, they are essential for diffusion of nutrients and cells during bone healing.49
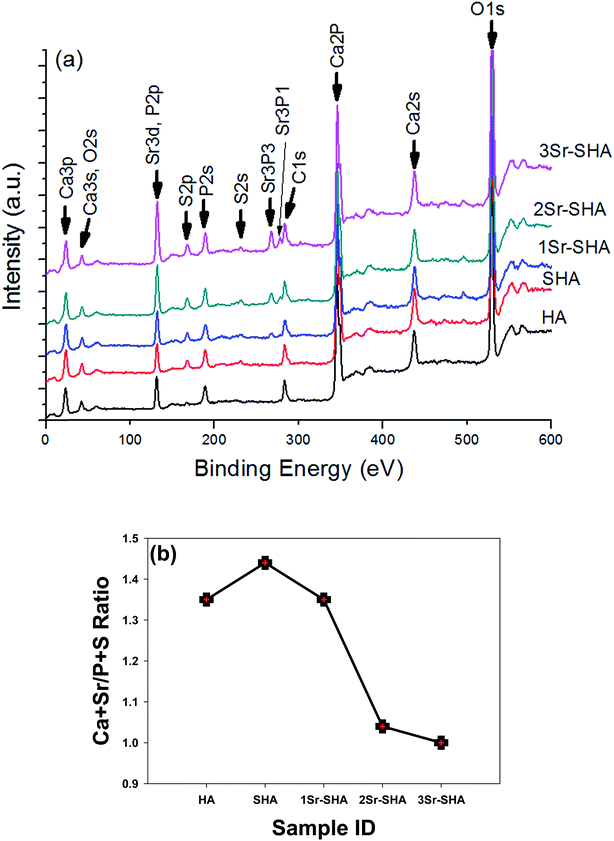
XPS wide energy survey scan spectra for the Sr-SHA powders are shown in Fig. 4 (a). Peaks corresponding to Ca2p (344.8 eV), P2p (131.1 eV) and O1s (529.4 eV) were indexed to the main component of HA, and they matched closely to those mentioned in the literature for HA.50 However, peak observed around 283.1 eV (C1s), confirmed the absorbance of CO32− and this result was in agreement with the FTIR results (Fig. 2). Incorporation of SO42− has been detected with binding energy at about 167.4 eV (S2p) and 231.5 eV (S2s).51 Replacing PO43− with SO42− most likely, led to a shift of P2p from 131.1 eV for HA to 131.9 eV for SHA and a reduced relative intensity of P2p peak with the incorporation of SO42− ions. Owing to the incorporation of Sr2+ into SHA structure a peak belonging to Sr3d was detected at 133.5 eV which was overlapping with P2p (131.9 eV) and the peak intensity increased linearly with increasing Sr2+ amount in SHA structure. The other two peaks were located at 267.2 eV and 277.5 eV ascribed to Sr3p3 and Sr3p1 respectively. These findings were in agreement with a previous study.26 Furthermore, the incorporation of Sr2+ led to shift the binding energy spectra of Ca2p to higher range, from 344.8 eV for HA to 345.9 eV for 3Sr-SHA.52
Measured Ca + Sr/P + S ratios in these runs were all consistently lower than the theoretical Ca + Sr/P + S ratio (1.67) (Fig. 4(b). This reduction in Ca/P ratio can be attributed to (i) exposure of the HA materials to X-ray, whereas some X-ray-induced breakdown of the Ca substituent in HA structure might have occured,53 (ii) XPS is a surface analysis technique and only takes data from the upper 5–10 nm of any sample.50 However, the cutback in the Ca/P ratio leads to enhanced solubility of the surface and thus further induces the roughness and wetness on the HA surface.54
The variation in the Ca2+ ion concentrations (ΔCa) after immersing in the SBF as a function of soaking duration is shown in (Fig. 5(a)). Ca2+ ion release from pure HA decreased in SBF during 14 days of incubation and this behaviour might be due to the highly crystalline structure which led to a low release of Ca2+ ions (Table 2). With incorporation of SO42− and Sr2+ ions an enhancement in dissolution rate was noted i.e. maximum release for Ca2+ ion was observed after 24 h, indicating that the dissolution process was dominating for the first day of incubation. After 3 days, the amount of Ca2+ ion in SBF began to decrease and a negative value of ΔCa was observed after 7 days of incubation. This behaviour can be attributed to the Ca2+ ions, which are being consumed gradually to deposit the apatite layer and thus suggesting a continuous precipitation of the bone-like apatite layer. These observations are considered beneficial for rapid growth of new apatite layer.55 However, results showed that ΔCa was stabilized and equilibrium has been established between the dissolution and deposition process between 7 and 14 days of incubations.
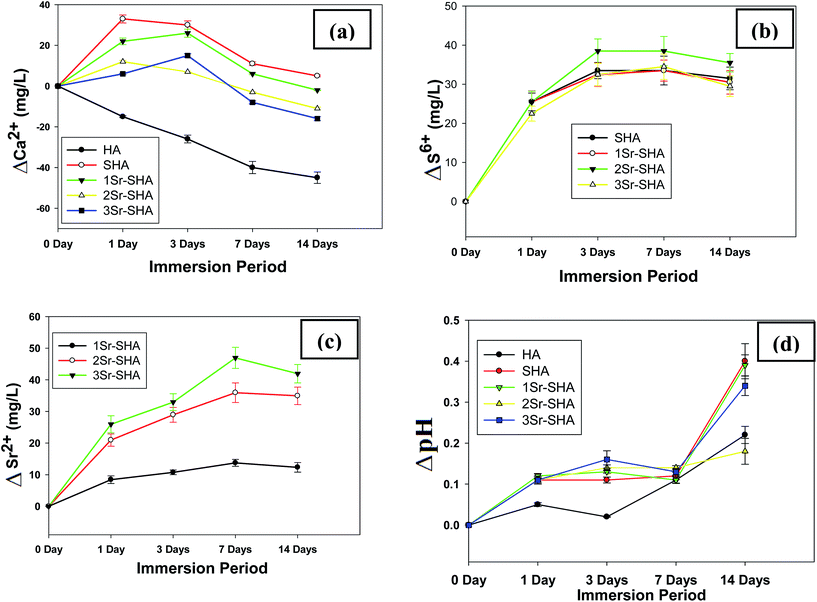 | ||
| Fig. 5 (a)–(c) Ion release profiles of Ca2+, S6+ and Sr2+ respectively, (d) change in pH value vs. soaking time. | ||
Variation in the S6+ ion release in SBF as a function of time is shown in (Fig. 5(b)). The concentration of S6+ ion increased steadily and reached the highest level after 3 days of soaking and stabilized at this range during 7 days of incubation in SBF. The concentration of S6+ ions began to decline after the first 7 days, which was ascribed to the redeposition of the ions on the newly forming apatite layer. The release of Sr2+ ion in SBF is depicted in (Fig. 5(c)). A gradual increase in the amount of Sr2+ ion release in SBF was observed with time. Maximum release of Sr2+ ion was observed at day 7. However, gradual decrease in Sr2+ was observed after this period, which was ascribed to their consumption in the formation of apatite layer. However, the presence of S6+ and Sr2+ ions in the apatite layer was also confirmed by the EDX of the apatite layer formed on the surface of the samples during SBF incubation. Furthermore, this re-deposition of Ca2+, S6+ and Sr2+ ions is considered beneficial as it will prevent the concentration of Ca2+, S6+ and Sr2+ ions from reaching potentially toxic levels in vivo. In general, the dissolution rate of HA in SBF is related with the degree of crystallinity. Ionic substitution in HA, resulting in the deterioration of degree of crystallinity enhances the dissolution rate of HA.56 In this study, Sr2+ and SO42− doped HA exhibited higher dissolution compared to pure HA due to the reduced degree of crystallinity as well as Sr-SHA had a larger fraction of interconnected pores (Table 3) and exhibited faster dissolution rates under physiologic conditions.48
The change in pH of SBF is depicted in (Fig. 5(d)). The pH value was around 7.40 before immersing the samples in SBF (ΔpH = 0) but after samples were placed in SBF, a gradual increase in pH value was observed during first 24 h. This increase was ascribed to the ionic exchange between the released cations (Ca2+ and Sr2+) from the outer shell of the samples and the H+ from SBF. Pure HA showed lowest pH change among of all materials. Highly crystalline structure of HA led to a low dissolution rate in SBF as a result less ionic exchange with H+ of SBF as well as less release of OH− ion from materials surface. However, a decrease in the pH value after 7 days was observed and this reduction was attributed to the consumption of OH− ions from SBF in the formation of the apatite layer. However, prolonging the immersion time beyond 14 days led to an increase in the pH value (pH: 7.78) for 3Sr-SHA. This pH value is a bit higher than the pH of human blood plasma, therefore there will be no harmful effect on the human tissues.57 Based on previous observations it is expected that the pH of SBF will be stabilized within the timeframe of 14–28 days.58
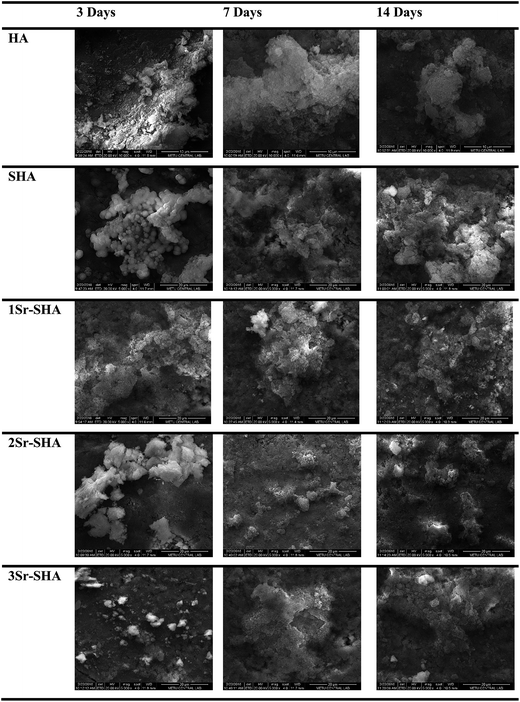
Growth of an apatite layer on the surface of Sr-SHA discs during SBF immersion is illustrated in Fig. 6. It was observed that the surface of discs was covered with tightly packed granules after 3 days of immersion in SBF. The degree of growth of apatite particles increased with the incorporation of Sr2+ and SO42− ions in HA lattice, which was attributed to the reduced degree of crystallinity of samples leading to faster and higher release of Ca2+ ions (Fig. 5(a)). After 7 and 14 days of immersion, homogeneous growth covering the entire surface of Sr-SHA series was observed and the growth became more dense where irregular agglomerate particles were observed. The number and the size of these granules deposited on the surface increased with increase in Sr2+ amount, indicating that the Sr2+ and SO42− ions favoured the growth of apatite particles.
EDX analysis confirmed that the agglomerates of particles formed on the surface were predominantly composed of Ca, P, O and C with Ca/P ratio of 1.406–1.626 (Table 4). Sr-SHA exhibited Ca/P ratio close to stoichiometric HA, indicating that the incorporation of Sr2+ and SO42− ions in HA structure resulted in the formation of an apatite layer with similar composition to HA. The Ca/P ratio slightly decreased with increase in immersion time which was due to incorporated of minor ions such as Na+, Mg2+, S6+ and Sr2+on the surface of the apatite layer in addition to the major ions.
| Sample ID | Ca/P ± SD | ||
|---|---|---|---|
| 3 days | 7 days | 14 days | |
| HA | 1.487 ± 0.004 | 1.507 ± 0.050 | 1.486 ± 0.021 |
| SHA | 1.406 ± 0.091 | 1.626 ± 0.024 | 1.571 ± 0.022 |
| 1Sr-SHA | 1.615 ± 0.083 | 1.642 ± 0.004 | 1.551 ± 0.062 |
| 2Sr-SHA | 1.505 ± 0.167 | 1.579 ± 0.012 | 1.561 ± 0.025 |
| 3Sr-SHA | 1.499 ± 0.047 | 1.557 ± 0.021 | 1.558 ± 0.010 |
FBS protein adsorption on Sr-SHA discs was studied for 24 h at 37 °C (Fig. 7). 0.27 mg was the total amount of FBS adsorbed per HA disc at the end of 24 h incubation. Incorporation of SO42− ion into HA structure reduced the adsorption of serum proteins on SHA (about 0.14 mg) which could be due to electrostatic repulsion between negative charges of SHA and negative groups of serum proteins.59 It was also noticeable that the amount of serum proteins adsorbed on HA discs with Sr2+ incorporation was significantly higher than that observed on SHA discs without Sr2+ incorporation (Fig. 7). Results also showed that amount of adsorbed serum proteins increased steadily with the increasing amount of Sr2+ ion in SHA structure and this behaviour can be attributed to electrostatic attraction of positive charge (Ca2+, Sr2+, H+) on Sr-SHA surface with the negative terminal groups (COO−) of the FBS proteins.59,60 Increasing the number of positively charged ions may help to increase the chance to counteract negative charges of serum proteins.
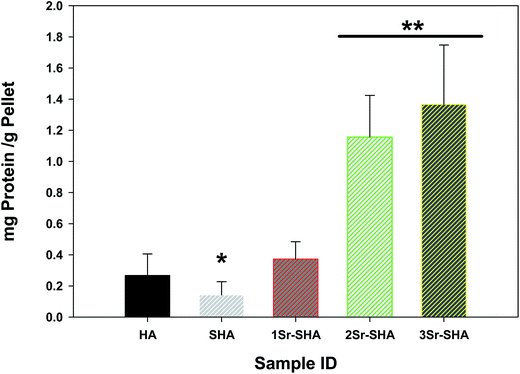 | ||
| Fig. 7 FBS protein adsorption on Sr-SHA discs 24 h incubation at 37 °C. Values are means ± SD, n = 3; p* < 0.05, p** < 0.05 significantly different when compared with HA (control) group. | ||
Cell proliferation on Sr-SHA materials discs was evaluated using a PrestoBlue viability assay and results are illustrated in Fig. 8. A time dependent increase in the viability of cells seeded on all discs was observed indicating that the cells proliferated on the discs and discs are cytocompatible. HA is well known that it is a biocompatible material and it promotes cell proliferation.61 Incorporation of SO42− and Sr2+ ions in HA resulted with enhancement in the cell proliferation. This enhancement of cell proliferation on SHA and Sr-SHA discs can be ascribed to various factors such as (i) dissolution rate: SHA and Sr-SHA showed a higher dissolution rate than HA (Fig. 5(a)) which, in turn, showed a higher release of beneficial ions such as Ca2+, PO43−, Sr2+ and SO42− ions into the culture medium. It is reported that Sr2+ ion promotes the calcium sensitive receptor (CaR) which may lead to increase the osteoblasts proliferation.62,63 In an another study it has been reported that leaching of Sr2+ ions from doped HA encouraged the mesenchymal cell for proliferation.64 Furthermore, it has been shown that release of Ca2+ and PO43− ions facilitated to precipitate bone-like apatite particles on disc surface which helped in cell proliferation.65 However, the biological role of leached SO42− ions and the mechanism how these ions affect cell proliferation are still not clear. We believe that it can be consumed in amino acid production (thiol group), which is further required in DNA replication during cell proliferation. (ii) Surface reactivity: SHA and Sr-SHA structure reveals more negative sites on the disc surface due to the presence of PO43−, OH− and SO42− groups on disc surface. A higher rate of cell proliferation on SHA and Sr-SHA was observed compared to that observed on pure HA and this can be attributed to electrostatic interaction between disc surface and cell membrane. Similarly, Lee et al. demonstrated that higher cell proliferation was observed on HA treated with citric acid.66 However, no significant difference was noted between the samples for various incubation periods.
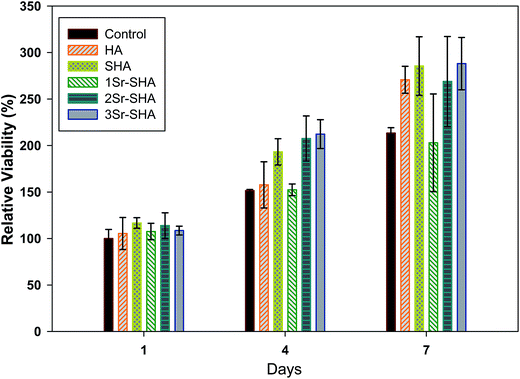 | ||
| Fig. 8 Cell proliferation of Saos-2 cell on Sr-SHA discs over 7 days. Values are means ± SD and n = 4. No statistical difference at a significance level of 0.05 was observed among groups. | ||
The morphology of cells seeded on Sr-SHA discs was examined with SEM after 1 and 7 days of incubation (Fig. 9). Generally, the cells attached and became spread on all Sr-SHA discs on day 1. Additionally, SEM examinations revealed that Saos-2 cells proliferated till day 7, which was in good agreement with cells viability results (Fig. 8). It was also observed that cells gained more flattened morphology on SHA and Sr-SHA discs than those cells on pure HA discs. This behaviour can be attributed to highly negative surfaces of SHA and Sr-SHA than HA, which can attract positive ions such as Ca2+ and proteins that support cell attachment such as fibronectin and vitronectin. Binding of positive ions and proteins, in turn, reduced the gap between disc surface and cell membrane which had polyelectrolyte nature.66–68 Furthermore, a higher negativity of the disc surface promoted cell adhesion. Similarly Ohgaki et al. demonstrated that negatively charged HA surface promoted osteoblast adhesion and proliferation.69 In another study reported by Lee et al. it was shown that HA blended with citric acid shifted the surface charge towards negative value, which promoted osteoblast-like cell attachment on HA.66 However, anion repulsion can take place between negative groups of cell membrane with PO43− and SO42− groups of the disc surface, this can be overcome by van der Waals force for SHA and Sr-SHA.67,70 Moreover, irregular agglomerations deposited on disc surface were observed along with flattened cells (Fig. 9 (inside the red circle)) which could have formed due to a higher release of Ca2+ and PO43− ions. Actually re adsorption of these ions was considered as a good sign to prevent these ions to reach to toxic levels in culture medium as reported by Xue et al. who demonstrated that the deposition of bone-like apatite particles can improve cell attachment on disc surface.65
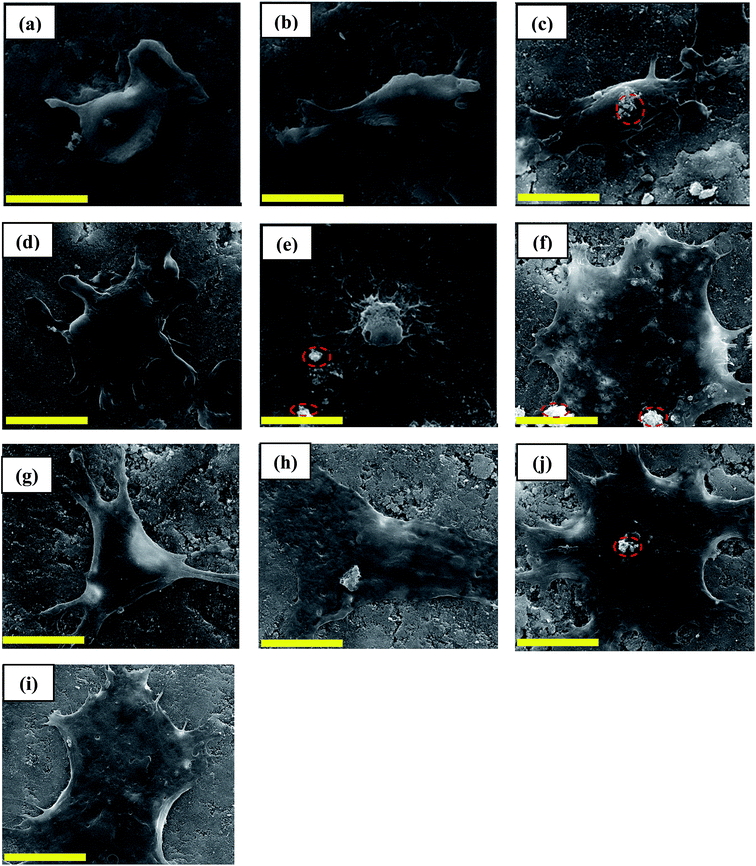 | ||
| Fig. 9 SEM images (scale bar = 10 μm) of Saos-2 cells seeded on discs, at days 1 and 7 respectively, pure HA (a and b), SHA (c and d), 1Sr-SHA (e and f), 2Sr-SHA (g and h), and 3Sr-SHA (i and j). | ||
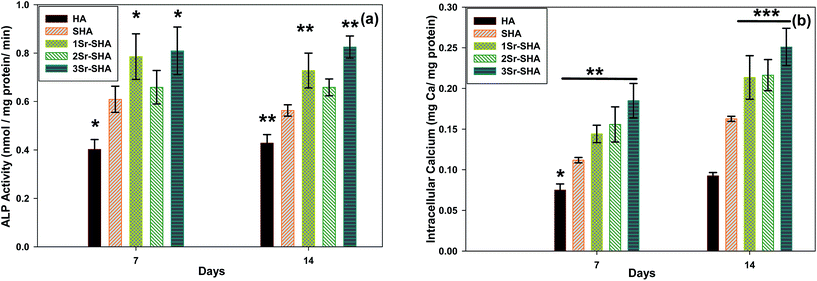
Osteogenic differentiation of Saos-2 cells seeded on discs was evaluated with ALP activity and intracellular calcium amount after 7 and 14 days of culture in osteogenic differentiation medium. At day 7, ALP activity of cells seeded on SHA and Sr-SHA discs was higher than on observed on pure HA disc. The highest ALP activity was observed on day 14 for all groups (Fig. 10 (a)). Intracellular calcium amounts showed similar trends with ALP activity (Fig. 10(b)). Intracellular calcium amounts significantly increased with the incorporation of dopant.
ALP activity and intracellular calcium of cells on Sr-SHA discs were statistically higher than on observed on HA disc at days 7 and 14. Generally, the results indicated that that presence of Sr2+ supported osteogenic differentiation of Saos-2 cells.71 This behaviour can be attributed to the dissolution rate of materials. However, higher degradation rate, resulting in higher Ca2+ ion release is considered as the major factor that drives osteogenic differentiation.72 Raucci et al. reported that the incorporation of Sr2+ in HA structure upregulated the expression of ALP related genes.20,73 Consequently, taking these results into account, leaching of Sr2+ ions may play a pivotal role in osteogenic differentiation.
4. Conclusion
In summary, Sr2+ and SO42− ions were successfully incorporated in the HA structure and phase analysis results revealed the expansion cell parameters along a and c axis of HA crystal. Results also showed that the incorporation of dopants decreased the crystallinity of HA. Microstructure analysis revealed that dopants had no significant effect on the particle morphology. BET analysis showed that the surface area of Sr-SHA (53.8 m2 g−1) was larger than HA and Sr-SHA materials were in mesoporous form with a pore size in the range of 3.3–3.5 nm. Ca/P ratio was found lower than the theoretical ratio (1.67). Sr2+ ion addition increased serum protein adsorption on HA. In vitro bioactivity study showed that incorporation of Sr2+and SO42−ions improved the dissolution rate of HA, and consequently better growth of apatite layer was observed with a Ca/P ratio in the range of 1.41–1.64. In vitro cell culture studies showed that Sr-SHA materials were cytocompatible and higher cell proliferation was observed than observed on HA. It was further confirmed that incorporation of Sr2+ in the HA structure encouraged initial osteogenic differentiation. Our findings, revealed that biological properties of HA were clearly improved with the incorporation of Sr2+ and SO42− ions and 3Sr-SHA is suggested to have potential as a biomaterial for bone implant applications.Acknowledgements
The authors would like to thank TÜBİTAK for providing financial support via 2221 Visiting Scientists Fellowship Programme.References
- S. Bhat and A. Kumar, Biomatter, 2013, 3, e24717 CrossRef PubMed.
- M. M. Stevens, Mater. Today, 2008, 11, 18–25 CrossRef CAS.
- P. Wang, L. Zhao, J. Liu, M. D. Weir, X. Zhou and H. H. K. Xu, Bone Res., 2014, 2, 14017 CrossRef CAS PubMed.
- A. F. Fraga, E. D. A. Filho, E. C. D. S. Rigo and A. O. Boschi, Appl. Surf. Sci., 2011, 257, 3888–3892 CrossRef CAS.
- K. Li, C. Y. Yeung, K. W. K. Yeung and S. C. Tjong, Adv. Eng. Mater., 2012, 14, B155–B165 CrossRef.
- S. V. Dorozhkin and M. Epple, Angew. Chem., Int. Ed., 2002, 41, 3130–3146 CrossRef CAS.
- M. Šupová, Ceram. Int., 2015, 41, 9203–9231 CrossRef.
- W. Yanhua, H. Hao, Y. Li and S. Zhang, Colloids Surf., B, 2016, 140, 297–306 CrossRef PubMed.
- M. A. Surmeneva, A. Kovtun, A. Peetsch, S. N. Goroja, A. A. Sharonova, V. F. Pichugin, I. Y. Grubova, A. A. Ivanova, A. D. Teresov, N. N. Koval, V. Buck, A. Wittmar, M. Ulbricht, O. Prymak, M. Epple and R. A. Surmenev, RSC Adv., 2013, 3, 11240–11246 RSC.
- U. Anjaneyulu, V. K. Swaroop and U. Vijayalakshmi, RSC Adv., 2016, 6, 10997–11007 RSC.
- D. Steinfurth, C. Zörb, F. Braukmann and K. H. Mühling, J. Plant Physiol., 2012, 169, 72–77 CrossRef CAS PubMed.
- J. Gu, T. Wang, G. Fan, J. Ma, W. Hu and X. Cai, J. Mater. Sci.: Mater. Med., 2016, 27, 1–11 CrossRef CAS PubMed.
- L. F. Peltier and R. Jones, J. Bone Jt. Surg., 1978, 60, 820–822 CAS.
- T. T. Yan, X. P. Wu, Y. S. Cui, Q. H. Chen and Z. D. Yang, Adv. Mater. Res., 2013, 738, 38–41 CrossRef CAS.
- B. R. Orellana, J. Z. Hilt and D. A. Puleo, J. Biomed. Mater. Res., Part B, 2015, 103, 135–142 CrossRef PubMed.
- C. Fang, R. Hou, K. Zhou, F. Hua, Y. Cong, J. Zhang, J. Fu and Y.-J. Cheng, J. Mater. Chem. B, 2014, 2, 1264–1274 RSC.
- K. Ramesh, E. G. Y. Ling, C. G. Gwie, T. J. White and A. Borgna, J. Phys. Chem. C, 2012, 116, 18736–18745 CAS.
- A. Z. Alshemary, Y.-F. Goh, M. Akram, I. R. Razali, M. R. Abdul Kadir and R. Hussain, Mater. Res. Bull., 2013, 48, 2106–2110 CrossRef CAS.
- K. Johal, G. Mendoza-Suarez, J. Escalante-Garcia, R. Hill and I. Brook, J. Mater. Sci.: Mater. Med., 2002, 13, 375–379 CrossRef CAS PubMed.
- F. Yang, D. Yang, J. Tu, Q. Zheng, L. Cai and L. Wang, Stem Cells, 2011, 29, 981–991 CrossRef CAS PubMed.
- A. D. Bakker, B. Zandieh-Doulabi and J. Klein-Nulend, Bone, 2013, 53, 112–119 CrossRef CAS PubMed.
- J. Rodriguez, N. Escudero and P. Mandalunis, Acta Odontol. Latinoam., 2011, 25, 208–213 Search PubMed.
- M. Raucci, M. Alvarez-Perez, D. Giugliano, S. Zeppetelli and L. Ambrosio, Regenerative Biomaterials, 2016, 3, 13–23 CAS.
- J. Zhou, B. Li, S. Lu, L. Zhang and Y. Han, ACS Appl. Mater. Interfaces, 2013, 5, 5358–5365 CAS.
- A. Bigi, E. Boanini, C. Capuccini and M. Gazzano, Inorg. Chim. Acta, 2007, 360, 1009–1016 CrossRef CAS.
- A. R. Boyd, L. Rutledge, L. Randolph, I. Mutreja and B. J. Meenan, J. Mater. Sci.: Mater. Med., 2015, 26, 1–14 CrossRef CAS PubMed.
- A. Z. Alshemary, M. Akram, Y.-F. Goh, U. Tariq, F. K. Butt, A. Abdolahi and R. Hussain, Ceram. Int., 2015, 41, 11886–11898 CrossRef CAS.
- E. Landi, A. Tampieri, G. Celotti and S. Sprio, J. Eur. Ceram. Soc., 2000, 20, 2377–2387 CrossRef CAS.
- K. Shiba, S. Motozuka, T. Yamaguchi, N. Ogawa, Y. Otsuka, K. Ohnuma, T. Kataoka and M. Tagaya, Cryst. Growth Des., 2016, 16, 1463–1471 CAS.
- A. Z. Alshemary, Y. F. Goh, M. Akram, M. R. A. Kadir and R. Hussain, Sci. Adv. Mater., 2015, 7, 249–257 CrossRef CAS.
- T. J. B. Holland and S. A. T. Redfern, Mineral. Mag., 1997, 61, 65–77 CAS.
- T. Kokubo and H. Takadama, Biomaterials, 2006, 27, 2907–2915 CrossRef CAS PubMed.
- C. Capuccini, P. Torricelli, E. Boanini, M. Gazzano, R. Giardino and A. Bigi, J. Biomed. Mater. Res., Part A, 2009, 89, 594–600 CrossRef CAS PubMed.
- G. Xu, I. A. Aksay and J. T. Groves, J. Am. Chem. Soc., 2001, 123, 2196–2203 CrossRef CAS PubMed.
- R. Manimekalai, A. P. Raj and C. R. Raja, Opt. Photonics J., 2012, 2, 1–4 CrossRef.
- R. P. Hapanowicz and S. R. A. Condrate, J. Solid State Chem., 1996, 123, 183–185 CrossRef CAS.
- N. Y. Mostafa, H. M. Hassan and O. H. Abd Elkader, J. Am. Ceram. Soc., 2011, 94, 1584–1590 CrossRef CAS.
- B. O. Fowler, Inorg. Chem., 1974, 13, 207–214 CrossRef CAS.
- T. S. de Araujo, Z. S. Macedo, P. A. de Oliveira and M. E. Valerio, J. Mater. Sci., 2007, 42, 2236–2243 CrossRef.
- J. Kolmas, A. Ślósarczyk, A. Wojtowicz and W. Kolodziejski, Solid State Nucl. Magn. Reson., 2007, 32, 53–58 CrossRef CAS PubMed.
- S. Mukherjee, Y. Song and E. Oldfield, J. Am. Chem. Soc., 2008, 130, 1264–1273 CrossRef CAS PubMed.
- P. Liu, N. Wang, Y. Hao, Q. Zhao, Y. Qiao, H. Li and J. Li, Med. Princ. Pract., 2014, 23, 264–270 CrossRef PubMed.
- S. V. Dorozhkin, Materials, 2009, 2, 399–498 CrossRef CAS.
- M. Filippousi, P. Siafaka, E. Amanatiadou, S. Nanaki, M. Nerantzaki, D. Bikiaris, I. Vizirianakis and G. Van Tendeloo, J. Mater. Chem. B, 2015, 3, 5991–6000 RSC.
- Y.-H. Yang, C.-H. Liu, Y.-H. Liang, F.-H. Lin and K. C.-W. Wu, J. Mater. Chem. B, 2013, 1, 2447–2450 RSC.
- J. Liu and X. Miao, J. Mater. Sci., 2005, 40, 6145–6150 CrossRef CAS.
- J. I. G. Ocampo, D. M. E. Sierra and C. P. O. Orozco, J. Adv. Res., 2016, 7, 297–304 CrossRef PubMed.
- D. Ke, W. Dernell, A. Bandyopadhyay and S. Bose, J. Biomed. Mater. Res., Part B, 2015, 103, 1549–1559 CrossRef CAS PubMed.
- R. Z. LeGeros, Chem. Rev., 2008, 108, 4742–4753 CrossRef PubMed.
- A. R. Boyd, L. Rutledge, L. D. Randolph and B. J. Meenan, Mater. Sci. Eng. C, 2015, 46, 290–300 CrossRef CAS PubMed.
- H. Zhao, S. Bennici, J. Shen and A. Auroux, J. Catal., 2010, 272, 176–189 CrossRef CAS.
- Y. Zhao, D. Guo, S. Hou, H. Zhong, J. Yan, C. Zhang and Y. Zhou, PloS one, 2013, 8, e69339 CAS.
- C. C. Chusuei, D. W. Goodman, M. J. Van Stipdonk, D. R. Justes and E. A. Schweikert, Anal. Chem., 1999, 71, 149–153 CrossRef CAS PubMed.
- Y. Abe, Y. Okazaki, K. Hiasa, K. Yasuda, K. Nogami, W. Mizumachi and I. Hirata, BioMed Res. Int., 2013, 2013, 1–9 CrossRef PubMed.
- Y. Cai, S. Zhang, X. Zeng, Y. Wang, M. Qian and W. Weng, Thin Solid Films, 2009, 517, 5347–5351 CrossRef CAS.
- A. Z. Alshemary, M. Akram, Y.-F. Goh, M. R. Abdul Kadir, A. Abdolahi and R. Hussain, J. Alloys Compd., 2015, 645, 478–486 CrossRef CAS.
- X. Fan, J. Chen, J.-P. Zou, Q. Wan, Z.-C. Zhou and J.-M. Ruan, Trans. Nonferrous Met. Soc. China, 2009, 19, 347–352 CrossRef CAS.
- M. Liyana, N. M. S. Adzali and M. Zamzuri, Adv. Mater. Res., 2014, 980, 13–17 Search PubMed.
- V. S. Chandra, K. Elayaraja, K. T. Arul, S. Ferraris, S. Spriano, M. Ferraris, K. Asokan and S. N. Kalkura, Ceram. Int., 2015, 41, 13153–13163 CrossRef.
- S. Tarafder, S. Banerjee, A. Bandyopadhyay and S. Bose, Langmuir, 2010, 26, 16625–16629 CrossRef CAS PubMed.
- T. Hemalatha, G. Krithiga, B. S. Kumar and T. P. Sastry, Acta Metall. Sin. (Engl. Lett.), 2014, 27, 1152–1158 CrossRef CAS.
- O. Fromigué, A. Barbara, E. Hay, C. Petrel, E. Traiffort, M. Ruat and P. Marie, Osteoporosis Int., 2006, 17(suppl. 2), S351–S352 Search PubMed.
- P. Römer, B. Desaga, P. Proff, A. Faltermeier and C. Reicheneder, Ann. Anat., 2012, 194, 208–211 CrossRef PubMed.
- J. Caverzasio, Bone, 2008, 42, 1131–1136 CrossRef CAS PubMed.
- W. Xue, J. L. Moore, H. L. Hosick, S. Bose, A. Bandyopadhyay, W. Lu, K. Cheung and K. D. Luk, J. Biomed. Mater. Res., Part A, 2006, 79, 804–814 CrossRef PubMed.
- W.-H. Lee, C.-Y. Loo, A. V. Zavgorodniy, M. Ghadiri and R. Rohanizadeh, RSC Adv., 2013, 3, 4040–4051 RSC.
- J. Vandiver, D. Dean, N. Patel, C. Botelho, S. Best, J. D. Santos, M. A. Lopes, W. Bonfield and C. Ortiz, J. Biomed. Mater. Res., Part A, 2006, 78, 352–363 CrossRef PubMed.
- M. Cohen, D. Joester, B. Geiger and L. Addadi, ChemBioChem, 2004, 5, 1393–1399 CrossRef CAS PubMed.
- M. Ohgaki, T. Kizuki, M. Katsura and K. Yamashita, J. Biomed. Mater. Res., 2001, 57, 366–373 CrossRef CAS PubMed.
- I. Smith, M. Baumann and L. McCabe, J. Biomed. Mater. Res., Part A, 2004, 70, 436–441 CrossRef CAS PubMed.
- C. Capuccini, P. Torricelli, F. Sima, E. Boanini, C. Ristoscu, B. Bracci, G. Socol, M. Fini, I. N. Mihailescu and A. Bigi, Acta Biomater., 2008, 4, 1885–1893 CrossRef CAS PubMed.
- A. M. C. Barradas, H. A. M. Fernandes, N. Groen, Y. C. Chai, J. Schrooten, J. van de Peppel, J. P. T. M. van Leeuwen, C. A. van Blitterswijk and J. de Boer, Biomaterials, 2012, 33, 3205–3215 CrossRef CAS PubMed.
- M. G. Raucci, D. Giugliano, M. Alvarez-Perez and L. Ambrosio, J. Mater. Sci.: Mater. Med., 2015, 26, 1–11 CrossRef CAS PubMed.
Footnote |
| † Electronic supplementary information (ESI) available. See DOI: 10.1039/c6ra16809d |
| This journal is © The Royal Society of Chemistry 2016 |

