DOI:
10.1039/C6RA16676H
(Paper)
RSC Adv., 2016,
6, 79153-79159
Reduction of Mn3+ to Mn2+ and near infrared plasmonics from Mn–Sn codoped In2O3 nanocrystals†
Received
28th June 2016
, Accepted 14th August 2016
First published on 15th August 2016
Abstract
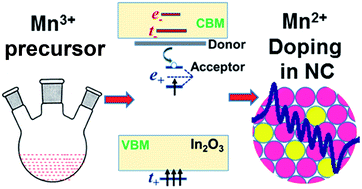
Colloidal Sn doped In2O3 nanocrystals have gained considerable attention for exhibiting surface plasmon resonance (SPR) which can be easily tuned in the near to mid infrared region by controlling the dopant concentration. Codoping these NCs with magnetic ions such as Fe3+, Mn2+/3+ can help develop interactions between delocalized electrons and localized magnetic spins which are required for spin-based applications. We prepared colloidal Mn–Sn codoped In2O3 nanocrystals with a diameter of ∼6–7 nm, starting from a Mn3+ precursor for Mn doping. Detailed characterization including Q-band electron paramagnetic resonance spectroscopy show that Mn exists in the 2+ oxidation state in both Mn-doped and Mn–Sn codoped In2O3 nanocrystals, in spite of using the Mn3+ precursor. This aliovalent Mn2+ doping along with charge neutralization through oxygen vacancies are energetically more favorable when compared to isovalent Mn3+ substitution in the In2O3 lattice. The SPR band decreased both in intensity and energy with increasing Mn content in the Mn–Sn codoped In2O3 nanocrystals. This is because Mn2+-doping introduces a hole in the lattice promoting electron–hole recombination reducing the free electron density. Also, Mn2+ dopants scatter the electrons thereby broadening the SPR band.
1. Introduction
Transparent conducting oxides (TCO) like indium tin oxide (ITO) and fluorine doped tin oxide (FTO) are high band gap materials with a significant density of conduction band (CB) electrons (e) which gives them a combination of otherwise mutually exclusive properties like transparency to visible light and high electrical conductivity.1 Doping magnetic ions in these TCOs can lead to the much required interaction of delocalized electrons with localized magnetic spins. Such interactions can give rise to ferromagnetism at a higher temperature2–4 along with possible magneto-optic and magneto-electric properties.5 Doped oxides showing such properties are popularly known as dilute magnetic semiconductor oxide (DMSO)6,7 and can act as future spintronic materials.8–10 However, it has been difficult to observe ferromagnetism from high quality single crystals of magnetically doped TCOs, instead, ferromagnetism have been found in their polycrystalline films.8,11–13 Other than magnetism, the doping of magnetic transition metal ions in TCOs also affects their optical and electrical behavior.12–16 Most of the TCO films exhibit nonmetallic behavior in electrical conductivity data which would suggest localization of charge carriers but extensive contribution from insulating grain boundaries makes it difficult to judge whether carriers are localized or delocalized within a given grain.17
Interestingly, nanocrystals (NCs) of ITO exhibit a strong surface plasmon resonance (SPR) band characterizing delocalized electrons within a NC. Such characterization of delocalized electrons using SPR band do not suffer from the grain boundary problem, unlike electrical measurements.18 In addition to SPR band, recent reports from our group involved codoping of transition metal ions (Fe3+, Mn2+) in Sn-doped In2O3 NCs18–20 showing carrier mediated magnetic coupling, where distant magnetic ions interact with each other via the delocalized CB e. Unfortunately, in both the cases, the SPR band generated due to aliovalent Sn4+ doping was dampened due to scavenging of free electrons by Fe3+ (facilitating partial conversion of Fe3+ to Fe2+), Mn2+ (through electron–hole recombination of Mn2+-hole with Sn4+-electron) and scattering of electrons by ionized dopants.18,20,21
Therefore, we were encouraged to replace Mn2+ dopant by Mn3+ which would have ideally led to isovalent doping by replacing In3+ in In2O3 lattice and hence retaining the strong SPR properties in Mn–Sn codoped In2O3 NCs. Here we show that even after starting with Mn3+ precursor aimed at isovalent doping, our final Mn doped In2O3 and Mn–Sn codoped In2O3 NCs were aliovalently doped i.e. Mn3+ reduces to Mn2+. Possible reasons for conversion of Mn3+ to Mn2+ along with its influence on SPR have been studied.
2. Experimental section
2.1 Chemicals
All the chemicals used were acquired commercially. Indium(III) acetylacetonate (Sigma-Aldrich, purity ≥99.99%), manganese(III) acetylacetonate (Sigma-Aldrich, purity >99.99%) and tin(IV) bis(acetylacetonate)dichloride (Sigma-Aldrich, purity 98%), oleylamine (Sigma-Aldrich, purity 70%), toluene (Rankem, 99.5% purity), methanol (Rankem, 99.9% purity), tetrachloroethylene (Sigma-Aldrich, purity ≥99%).
2.2 Colloidal synthesis of Mn–Sn codoped In2O3 NCs
We report here the first synthesis strategy for making colloidal Mn–Sn codoped In2O3 NCs using Mn3+ precursor. The colloidal Mn–Sn codoped In2O3 NCs were synthesized through a simple single pot strategy using standard schlenk line technique, similar to our previous reports.18–20 Indium(III) acetylacetonate, manganese(III) acetylacetonate, and tin(IV) bis(acetylacetonate) dichloride were taken in stoichiometric amounts to synthesize NCs of desired compositions. For example, to synthesize 10% Mn–10% Sn codoped In2O3 NCs, 1.2 mmol In(III), 0.15 mmol Mn(III), and 0.15 mmol Sn(IV) precursors were mixed with 10 mL oleylamine in a 50 mL three-necked round-bottom flask and degassed at room temperature using N2 atmosphere and vacuum conditions alternatively for 30 min. The temperature was then raised to 100 °C under vacuum conditions for 30 min followed by heating to 220 °C at ∼10 °C min−1. The reaction was then continued at 220 °C for 5 h under N2 atmosphere along with magnetic stirring. Subsequently, the reaction mixture was allowed to cool to room temperature followed by addition of excess methanol (∼30 mL) as a non-solvent to precipitate the NCs. The precipitated NCs were centrifugated at 6000 rpm for 6 min and the washing process was repeated twice to get rid of excess oleylamine. These oleylamine capped NCs were dispersed in different non-polar solvents like tetrachloroethylene, toluene and chloroform to study various properties.
2.3 Characterization
Energy dispersive X-ray (EDX) analysis was carried out using Zeiss Ultra Plus Scanning Electron Microscope and inductively coupled plasma optical emission spectroscopy (ICP-OES) was carried out using Arcos M/s. Spectro, Germany for determining elemental composition of Mn–Sn codoped In2O3 NCs. Perkin Elmer, Lambda-950 UV/vis spectrometer and Shimadzu UV-3600 Plus UV-Vis-NIR spectrophotometer were used to record UV-vis-NIR absorption spectra of NCs dispersed in tetrachloroethylene (TCE). Powder X-ray diffraction (XRD) patterns of NCs were obtained on a Bruker D8 Advance X-ray diffractometer using Cu Kα (1.54 Å) X-ray source. Transmission Electron Microscopy (TEM) was performed on JEOL JEM 2100F and Tecnai G2 FEI F12 TEM microscope being operated at 200 kV. Electron paramagnetic resonance (EPR) spectra were recorded on a JEOL JES-FA200 ESR spectrometer with X and Q band attachment. Electrical conductivity was determined on ∼1.5 mm thick pellets using a Keithley four probe conductivity instrument consisting of Model 6220/6221 Current Source and Model 2182A nanovoltmeter. All the pellets were annealed in N2 atmosphere at 200 °C for 2 hours prior to conductivity measurements. Magnetic data were obtained from a SQUID magnetometer (Quantum Design MPMS XL-7 Magnetometer). Zero-field cooled (ZFC) and field-cooled (FC) data were acquired by varying the temperature between 2 and 300 K at 100 Oe magnetic field after cooling the samples in zero field or in a 100 Oe field, respectively.
3. Results and discussion
3.1 Structure and morphology
Elemental analysis of Mn–Sn codoped In2O3 NCs obtained using EDX has been summarized in Table 1 (representative EDX spectra are shown in Fig. S1 of ESI†). We note here that, EDX analyses were done by recording multiple spectra over different regions of a given sample, and the reported composition was then calculated after averaging out the compositions obtained from multiple spectra. Such averaging is done to reduce the error in the measured composition, particularly at smaller doping levels where EDX analysis can lead to large errors. Furthermore, elemental compositions were obtained using ICP-OES, which agrees with the EDX data, as shown in Table ST1 of the ESI.† All these elemental analyses show that product NCs exhibit compositions similar to the precursor ratios. Therefore, for simplicity, we have used the nominal precursor ratios throughout the manuscript. However, EDX and ICP-OES cannot distinguish between metal ions doped in the core of NCs and those present as secondary impurity phases.
Table 1 Elemental composition (atomic ratio) of Mn–Sn codoped In2O3 NCs. EDX data reveals that NC composition is almost same as that expected from the precursor ratios
In : Mn : Sn (atomic ratio) |
Precursor ratio |
EDX analysis |
95 : 5 : 0 |
95.5 : 4.5 : 0 |
85 : 10 : 5 |
87.3 : 8.3 : 4.5 |
85 : 5 : 10 |
84.1 : 5.5 : 10.4 |
89 : 1 : 10 |
90.2 : 0.8 : 9.0 |
99 : 1 : 0 |
98.9 : 1.1 : 0 |
80 : 10 : 10 |
83.8 : 8.1 : 8.1 |
90 : 5 : 5 |
89.4 : 5.6 : 5.0 |
Fig. 1a compares XRD patterns of different Mn doped In2O3 NCs. It can be clearly observed that all doped and undoped In2O3 NCs exhibit the same cubic bixbyite structure (space group Ia3, 206) as that of the reference bulk In2O3 (JCPDS number 88-2160) with no signs of impurity peaks or secondary phases. Additionally, Mn doping causes a slight shift of diffraction angles to higher values or in other words, a decrease in interplanar distances following Bragg's law of diffraction. Previous literature has attributed this shift extensively to the lattice doping of Mn ions. It is important to note that while Mn3+ has a smaller crystal radii than In3+ ion (rMn3+ = 65 pm, rIn3+ = 79 pm), Mn2+ has a crystal radii greater than that of In3+ (rMn2+ = 82 pm).22 Therefore, ideally Mn3+ doping would result in lower interplanar distances in In2O3 whereas Mn2+ doping would cause them to be greater than that in In2O3. However, Mn2+ ion is not isovalent with In3+ and replaces In3+ in the lattice along with an oxygen vacancy to compensate the charge imbalance.23 An increase in oxygen vacancy concentration would also be reflected in the position of peaks in XRD pattern as loss of atoms would cause the lattice to shrink (lower interplanar distances) and thus higher angles of diffraction. This creates a confusion over the plausible oxidation state of Mn ion and due to this reason, the extent of presence of mixed valency in Mn doped In2O3 system has been largely inconclusive as per the literature reports from different groups.18,23–26
 |
| Fig. 1 Powder X-ray diffraction (XRD) patterns of (a) Mn doped In2O3 NCs, and (b) Mn–Sn codoped In2O3 NCs. Comparison of the XRD patterns of NCs with bulk In2O3 reference reveal cubic bixbyite structure for all samples without presence of any secondary phase. | |
Sn doped In2O3 NCs (Fig. 1b) exhibit lattice parameters similar to the undoped sample which is consistent with earlier reports.19 Also, Mn–Sn codoped In2O3 NCs (Fig. 1b) have similar lattice parameters as compared to their only Mn doped counterparts. This observation suggests us that the oxidation of Mn state remains largely the same in both presence and absence of Sn codopant, even though Sn4+ doping provides an extra electron that can reduce any Mn3+ to Mn2+ (reduction potential +1.51 V).27 Such a scenario can possibly occur because Mn3+ in the system are already reduced to Mn2+ by surrounding oxygen vacancies in Mn-doped In2O3 NCs, in the absence of Sn codopant. This possibility has been discussed in detail in later part of the manuscript.
Fig. 2 shows transmission electron microscopy (TEM) images for undoped and different Mn–Sn doped In2O3 NCs with all NCs being nearly spherical in shape. Undoped In2O3 NCs are approximately 9.1 nm in size whereas Mn and/or Sn doped In2O3 NCs have an average diameter of 6–7 nm which is in good correlation with that obtained from XRD pattern using Debye–Scherrer equation.28 High resolution TEM (HRTEM) images of undoped and 10% Sn doped In2O3 NCs depicted as insets of Fig. 2a and b show highly crystalline single phase NC with lattice fringes. Calculations result in interplanar distances of 2.93 Å and 2.94 Å for undoped and 10% Sn doped In2O3 NCs respectively corresponding to {222} lattice planes of In2O3 cubic bixbyite structure. Representative HRTEM images from 1% Mn doped and 1% Mn–10% Sn codoped In2O3 NCs (insets to Fig. 2c and d) also show lattice fringes with interplanar distances of 2.93 Å and 2.94 Å respectively corresponding to {222} plane. These values of interplanar distances for undoped and doped In2O3 NCs obtained from HRTEM match very closely with those calculated from their corresponding XRD patterns which confirms that our NCs are indeed phase pure and possibility of any secondary phase can be ruled out.
 |
| Fig. 2 Transmission electron microscopy (TEM) images along with high resolution TEM (HRTEM) images in the inset for (a) undoped In2O3 NCs showing spherical NCs with an average diameter ∼9.1 nm. (b) 10% Sn doped In2O3 NCs having spherical NCs with ∼6.5 nm average diameter (c) 1% Mn doped In2O3 NCs showing nearly spherical NCs with average diameter ∼7.1 nm (d) 1% Mn–10% Sn codoped In2O3 NCs showing narrow size distribution of nearly spherical NCs with average diameter ∼7.0 nm. | |
3.2 Oxidation state and local structure of Mn using EPR spectroscopy
EPR spectroscopy is an excellent tool to probe oxidation state and local structure around a paramagnetic ion.29 We used Q-band EPR spectroscopy to elucidate the oxidation state of Mn in both Mn-doped and Mn–Sn codoped In2O3 NCs. Fig. 3 compares Q-band EPR spectra of 1% Mn doped and 1% Mn–10% Sn codoped In2O3 NCs. Both the EPR spectra consist of six hyperfine line pattern centered at g = 2.003. This sextet splitting pattern is characteristic of the presence of Mn2+ ions which arises as a result of hyperfine coupling between nuclear spin of Mn (I = +5/2) and 3d electrons of Mn2+ ion.30 The location of these Mn2+ ions can be estimated through the hyperfine coupling constant which is approximately ∼7.1 mT. This value of hyperfine coupling constant is similar to those observed in Mn doped bulk oxides suggesting that Mn–O bonds show significant covalent behavior31 and hence most of our Mn2+ ions are lattice doped rather than being present on the surface, for which hyperfine coupling constant is expected to be much higher.32
 |
| Fig. 3 Q-Band EPR spectra of 1% Mn and 1% Mn–10% Sn codoped In2O3 NCs showing hyperfine structure consisting of six lines centered at g = 2.003 for the presence of Mn2+ ions. | |
On the other hand, Mn3+ belongs to a non-kramer category (integral spin) and suffers with high zero field splitting energy which often makes it silent to X-band (∼9.35 GHz) EPR. However, we have employed here Q-band EPR (∼35 GHz) that can probe Mn3+ ion. It is known that Mn3+ exhibits an EPR signal centered around g = 2.21 under high spin environment of In2O3.33 Therefore, the absence of Mn3+ EPR signal for both our Mn-doped and Mn–Sn codoped NC samples suggests that the oxidation state of Mn is 2+ with insignificant amount (or absence) of Mn3+ ions. This is interesting as we started off with a Mn3+ precursor and ended up with Mn2+ in the final NC product.
3.3 Insights on conversion of Mn3+ to Mn2+
The observed conversion of Mn3+ in precursor to Mn2+ in product NC might have multiple correlated origins, for example, (i) Mn3+ reduces to Mn2+ because of applied reaction conditions and/or (ii) Mn3+ is not stable after incorporation into the In2O3 lattice. We discuss here both the possibilities. A control experiment was performed to study the spontaneity of this conversion under the same reaction conditions but in the absence of In2O3 lattice. This control reaction was carried out with Mn3+ precursor, in the absence of In(III) and Sn(IV) precursors, and applying rest of the synthesis strategy same as that for Mn–Sn codoped In2O3 NCs. XRD pattern of the product obtained from this control experiment (shown in Fig. 4) is compared with reference patterns of bulk MnO, Mn2O3 and Mn3O4. XRD pattern of the product resembles more to that of the MnO in terms of 2θ values and significantly different when compared to both Mn2O3 and Mn3O4. These results suggest that Mn3+ precursor in the control reaction preferably reduces to Mn2+ forming MnO as the preferred composition even in the absence of In2O3. Though the energetics involved in the formation of MnO and Mn-doped In2O3 would be very different, but the results confirm that Mn2+ is more stable compared to Mn3+ in both synthesis. In addition to the observed preference for Mn2+ oxidation state even in the absence of In2O3 lattice, theoretical studies of Zunger et al.10 also suggested the possibility of reduction of Mn3+ to Mn2+ after incorporation into In2O3 lattice. They calculated the position of defect levels created by different 3d transition metals after substitution of In3+ in In2O3 lattice.10 Schematic in Fig. 5 shows the case of Mn3+ ion doped in In2O3 lattice, after adapting the figure from ref. 10 along with our modifications. Crystal structure of In2O3 has two substitution sites b and d, both of which are nearly octahedral in symmetry.1 Under the nearly octahedral symmetry of lattice sites, the d levels of dopant gets split into sets of t and e levels where the spin configuration (spin up or spin down) further splits them into t+, e+, t− and e− levels. For a Mn3+ ion with 4d-electrons in high-spin configuration the highest occupied two degenerate e+ levels are only half filled and therefore undergoes a Jahn–Teller distortion34 lifting the degeneracy. Both the non-degenerate e+ level lie in the mid-gap region of the host, as shown in Fig. 5. The e+ with lower energy is occupied, whereas the other e+ level is unoccupied. This unoccupied e+ level can accept an electron from both the conduction band minimum (CBM) of In2O3 and oxygen defect states that are energetically closer to CBM. Oxygen vacancies are known to form shallow electron donor levels near the CBM of In2O3.35 Energetically favorable electron transfer from oxygen vacancies (donor levels) to unoccupied e+ (acceptor levels) can reduce Mn3+ to Mn2+. This possible electron transfer is one of the important reasons for stabilizing Mn2+ in In2O3 lattice, which is known to form oxygen vacancies.
 |
| Fig. 4 Comparison of XRD pattern of the sample obtained from control experiment using manganese(III) acetylacetonate with bulk MnO, Mn2O3 and Mn3O4 reference. The major peaks in XRD pattern correspond to MnO suggesting dominance of +2 oxidation of Mn in the product in spite of using Mn3+ precursor. | |
 |
| Fig. 5 Schematic showing the mechanism for reduction of Mn3+ to Mn2+ in In2O3 lattice. Donor–acceptor transition between 3d levels of Mn3+ (acceptor) and those created by oxygen vacancies/Sn4+ codoping (donor) leads to conversion of Mn3+ to Mn2+ ions. The figure has been prepared by using the theoretical calculation data reported by Zunger et al. in ref. 10. | |
It is worthy to note that oxygen vacancy concentration in undoped In2O3 NCs is usually low (<1% of the total oxygen concentration),1 so ideally, in only Mn doped In2O3 NCs, the number of electrons released by creation of oxygen vacancies won't suffice for the conversion of all Mn3+ to Mn2+ with charge imbalance further complexing the scenario. However, previous literature has suggested that Mn2+ doping in In2O3 is usually assisted with creation of additional oxygen vacancies23 following eqn (1)
|
 | (1) |
In the previous equation,
represents that substitution of In atoms at an In site leaving a neutral charge on the site (denoted by x),
means that a Mn2+ ion has substituted an In3+ ion at an In site and left a negative charge (′) on the In site and
represents creation of an oxygen vacancy at an oxygen site leaving +2 positive charge (denoted by ˙) on the oxygen site.
Therefore both the possibilities, (i) converting Mn3+ to Mn2+ under our reaction conditions even in the absence of In2O3, and/or (ii) reduction of Mn3+ to Mn2+ by accepting electrons from oxygen vacancies in the In2O3 lattice can be responsible for formation of Mn2+ doped In2O3 NCs in spite of using Mn3+ precursor. Similarly, Mn2+–Sn4+ codoped In2O3 NCs are also formed with Mn3+ precursor. In fact, reduction of Mn3+ to Mn2+ ions can become even more favorable for the codoped samples, where the electron released by Sn4+ ion can be used for the reduction, in addition to electrons donated by oxygen vacancies. Though some literature have reported possibilities of a mixture of Mn2+ with smaller amount of Mn3+ in In2O3, a careful survey of literature points out that most prior literature qualitatively agree with our observation that Mn2+ is the stable dopant species in spite of the fact that it is not isovalent with In3+.18,23,25,26,36 The charge neutrality in this case is being maintained by easy creation of oxygen vacancy as shown in ref. 23. The quantitative differences, where some literature finds reasonable quantity of Mn3+,25,26 whereas, very small or negligible amount of Mn3+ in other literature18,23,36 is expected to arise due to different sample preparation procedures which would yield a different local structure around a Mn ion and consequently, can fine-tune the formation energies of different oxidation states.
3.4 Plasmonics
Fig. 6a shows UV-vis-NIR spectra for Mn–Sn codoped In2O3 NCs with varying doping levels of Mn and constant 10% Sn doping. 10% Sn doped In2O3 NCs exhibits an intense SPR band with peak at ∼2200 nm, similar to prior literature.19,37,38 With increasing doping percentages of Mn in Mn–Sn codoped NCs, this SPR peak gets shifted to a longer wavelength in the mid IR region with a decrease in intensity, similar to our previous report.18 This tuning of SPR peak by Mn ions serves as an additional proof that both the dopant ions Mn and Sn are part of the same NC and do not indulge in formation of a secondary impurity phase. According to Drude theory, the SPR wavelength is primarily governed by the electron density in the nanostructure and is also dependent upon the size, shape and dielectric constant of the medium.39,40 We note here that Mn codoping doesn't result in a colossal change in size or shape of NCs (evident from Fig. 2) and doping in such small percentages is unlikely to affect the dielectric constant of the NCs (the dielectric constant for the surrounding medium, tetrachloroethylene being same for all samples). This means that the variation in SPR has more to do with electron trapping around Mn centres than any other factor. We note here that almost all our Mn ions reside in +2 oxidation state as observed from Q-band EPR. The substitution of In3+ by Mn2+ leaves a hole in the lattice which can be compensated by the free electrons released by Sn4+ ions, shifting the SPR peak to longer wavelengths. Furthermore, the decrease in intensity of SPR along with broadening can happen because of scattering of charge carriers by ionized impurities.21 Such scattering increases with increase in Mn doping percentage. This can be estimated from half width at half maxima (HWHM) for the SPR band which is a function of scattering by the charge carriers. Expectedly, Fig. 6b shows an increase in HWHM with increasing Mn content in Mn–Sn codoped NCs, suggesting an increase in scattering by Mn centers. This decrease in effective electron concentration and increased scattering of electrons by Mn doping is also evident from electrical resistivity data (Fig. 6c) where Mn doping brings down the electrical conductivity from 22 S cm−1 for 10% Sn doped In2O3 NCs to 1.8 S cm−1 for 1% Mn–10% Sn codoped In2O3 NCs.
 |
| Fig. 6 (a) UV-vis-NIR spectra for x% Mn–10% Sn codoped In2O3 NCs showing SPR band shifting to longer wavelengths with increase in Mn codoping percentage. (b) Variation of half width at half maxima (HWHM) with Mn codoping showing enhancement in the electron scattering with ionized Mn2+ impurity as Mn codoping levels increase. The circles represent experimental data and solid lines are just guide to the eye. (c) V–I curve for Mn–Sn codoped In2O3 NCs suggesting decrease in effective electron concentration on codoping with Mn ions. | |
We also mention here that, preliminary magnetic measurements were carried out with the example of 10% Mn doped In2O3 NCs. Both magnetization vs. magnetic field and temperature dependent magnetization curves are shown in Fig. S2 of ESI.† The results show predominant paramagnetic behavior, similar to ref. 18.
4. Conclusions
We prepared only Mn2+ doped and Mn2+–Sn4+ codoped In2O3 NCs using Mn3+ as one of the precursors. The reduction of Mn3+ precursor to Mn2+ in the product NC has been confirmed by Q-band EPR spectroscopy. Though Mn3+ is isovalent to In3+, substitution of In3+ in the In2O3 lattice with Mn2+ is more favorable as compared to Mn3+ ion. This aliovalent doping of Mn2+ in In2O3 lattice is probably caused by the interaction between the acceptor d-levels of Mn3+ in the mid-gap region with electron donor levels formed by oxygen vacancies. These oxygen vacancies can also maintain the charge neutrality after substitution of In3+ with Mn2+ ion. In the case of Mn2+–Sn4+ codoped In2O3 NCs, Sn4+ doping provide additional donor electrons. Also, reaction conditions play an important role in converting Mn3+ to Mn2+. These Mn–Sn codoped NCs exhibit SPR band in the near to mid IR region. Increase in Mn content shifts the SPR band of codoped NCs toward longer wavelengths along with broadening of the SPR peak. This is because of electron–hole recombination between hole provided by Mn2+ doping and free electrons released through Sn4+ doping, and scattering of electrons by the ionized Mn2+ impurities which reduces the effective free electron concentration. Accordingly, electrical conductivity also decreases from 22 S cm−1 for 10% Sn doped In2O3 NCs to 1.8 S cm−1 for 1% Mn–10% Sn codoped In2O3 NCs. This understanding of Mn2+ doping mechanism and its influence on plasmonic data will be useful to design and understand dilute magnetic semiconductors using Mn2+ doping in different oxide materials.
Acknowledgements
We acknowledge SAIF, IIT-Bombay for Q-band EPR and ICP-OES measurements and IISER Pune for instrumental facilities. We also thank Dr Janardan Kundu from NCL-Pune for providing access to TEM facility and Dr Sunil Nair for SQUID measurements. A. N. acknowledges Science and Engineering Research Board (SERB) for Ramanujan Fellowship (SR/S2/RJN-61/2012) and DST-Nano Mission grant (SR/NM/NS-1474/2014) Govt. of India. B. T. and A. Y. thank CSIR and INSPIRE respectively for fellowships.
References
- G. B. González, Mater., 2012, 5, 818–850 CrossRef.
- G. K. Liang Goh, K. Y. Seng Chan and T. Liu, CrystEngComm, 2011, 13, 524–529 RSC.
- W. Wan, J. Huang, L. Zhu, L. Hu, Z. Wen, L. Sun and Z. Ye, CrystEngComm, 2013, 15, 7887–7894 RSC.
- R. Viswanatha, D. Naveh, J. R. Chelikowsky, L. Kronik and D. D. Sarma, J. Phys. Chem. Lett., 2012, 3, 2009–2014 CrossRef CAS.
- Q. Sun, Y. Zeng and D. Jiang, CrystEngComm, 2012, 14, 713–718 RSC.
- S. A. Chambers, T. C. Droubay, C. M. Wang, K. M. Rosso, S. M. Heald, D. A. Schwartz, K. R. Kittilstved and D. R. Gamelin, Mater. Today, 2006, 9, 28–35 CrossRef CAS.
- S. B. Ogale, Adv. Mater., 2010, 22, 3125–3155 CrossRef CAS PubMed.
- J. M. D. Coey, M. Venkatesan and C. B. Fitzgerald, Nat. Mater., 2005, 4, 173–179 CrossRef CAS PubMed.
- J. Philip, A. Punnoose, B. I. Kim, K. M. Reddy, S. Layne, J. O. Holmes, B. Satpati, P. R. Leclair, T. S. Santos and J. S. Moodera, Nat. Mater., 2006, 5, 298–304 CrossRef CAS PubMed.
- H. Raebiger, S. Lany and A. Zunger, Phys. Rev. B: Condens. Matter Mater. Phys., 2009, 79, 165202 CrossRef.
- C. N. R. Rao and F. L. Deepak, J. Mater. Chem., 2005, 15, 573–578 RSC.
- J. Philip, N. Theodoropoulou, G. Berera, J. S. Moodera and B. Satpati, Appl. Phys. Lett., 2004, 85, 777–779 CrossRef CAS.
- T. Ohno, T. Kawahara, M. Murasugi, H. Tanaka, T. Kawai and S. Kohiki, J. Magn. Magn. Mater., 2007, 310, e717–e719 CrossRef CAS.
- A. P. Caricato, M. Cesaria, A. Luches, M. Martino, G. Maruccio, D. Valerini, M. Catalano, A. Cola, M. G. Manera, M. Lomascolo, A. Taurino and R. Rella, Appl. Phys. A, 2010, 101, 753–758 CrossRef CAS.
- M. Cesaria, C. Anna Paola, G. Leggieri, A. Luches, M. Martino, G. Maruccio, M. Catalano, M. Maria Grazia, R. Rella and A. Taurino, J. Phys. D: Appl. Phys., 2011, 44, 365403–365410 CrossRef.
- K. Nomura, J. Sakuma, T. Ooki and M. Takeda, Hyperfine Interact., 2008, 184, 117–121 CrossRef CAS.
- A. Hakimi, M. G. Blamire, S. M. Heald, M. S. Alshammari, M. S. Alqahtani, D. S. Score, H. J. Blythe, A. M. Fox and G. A. Gehring, Phys. Rev. B: Condens. Matter Mater. Phys., 2011, 84, 085201 CrossRef.
- B. Tandon, A. Yadav and A. Nag, Chem. Mater., 2016, 28, 3620–3624 CrossRef.
- B. Tandon, G. S. Shanker and A. Nag, J. Phys. Chem. Lett., 2014, 5, 2306–2311 CrossRef CAS PubMed.
- G. S. Shanker, B. Tandon, T. Shibata, S. Chattopadhyay and A. Nag, Chem. Mater., 2015, 27, 892–900 CrossRef CAS.
- S. D. Lounis, E. L. Runnerstrom, A. Llordés and D. J. Milliron, J. Phys. Chem. Lett., 2014, 5, 1564–1574 CrossRef CAS PubMed.
- R. D. Shannon and C. T. Prewitt, Acta Crystallogr., Sect. B: Struct. Crystallogr. Cryst. Chem., 1969, 25, 925–946 CrossRef CAS.
- Y. An, S. Wang, L. Duan, J. Liu and Z. Wu, Appl. Phys. Lett., 2013, 102, 212411 CrossRef.
- T. Okazaki, T. Yoshioka, Y. Kusakabe, T. Yamamoto and A. Kitada, Solid State Commun., 2011, 151, 1749–1752 CrossRef CAS.
- S. S. Farvid, N. Dave, T. Wang and P. V. Radovanovic, J. Phys. Chem. C, 2009, 113, 15928–15933 CAS.
- S. S. Farvid, T. Sabergharesou, L. N. Hutfluss, M. Hegde, E. Prouzet and P. V. Radovanovic, J. Am. Chem. Soc., 2014, 136, 7669–7679 CrossRef CAS PubMed.
- J. Zimmerman, Biochem. Mol. Biol. Educ., 2005, 33, 382 CrossRef CAS.
- A. L. Patterson, Phys. Rev., 1939, 56, 978–982 CrossRef CAS.
- D. M. Murphy, in Metal Oxide Catalysis, Wiley-VCH Verlag GmbH & Co. KGaA, 2009, pp. 1–50 Search PubMed.
- B. Bleaney, Discuss. Faraday Soc., 1955, 19, 112–118 RSC.
- O. Matumura, J. Phys. Soc. Jpn., 1959, 14, 108 CrossRef.
- N. S. Norberg, K. R. Kittilstved, J. E. Amonette, R. K. Kukkadapu, D. A. Schwartz and D. R. Gamelin, J. Am. Chem. Soc., 2004, 126, 9387–9398 CrossRef CAS PubMed.
- A. R. Vazquez-Olmos, J. I. Gomez-Peralta, R. Y. Sato-Berru and A. L. Fernandez-Osorio, J. Alloys Compd., 2014, 615, S522–S525 CrossRef CAS.
- A. D. Liehr, in Progress in Inorganic Chemistry, John Wiley & Sons, Inc., 2007, pp. 281–314f Search PubMed.
- S. Lany and A. Zunger, Phys. Rev. Lett., 2007, 98, 045501 CrossRef PubMed.
- G. Peleckis, X. L. Wang and S. X. Dou, J. Magn. Magn. Mater., 2006, 301, 308–311 CrossRef CAS.
- T. Wang and P. V. Radovanovic, J. Phys. Chem. C, 2011, 115, 406–413 CAS.
- A. M. Schimpf, S. D. Lounis, E. L. Runnerstrom, D. J. Milliron and D. R. Gamelin, J. Am. Chem. Soc., 2015, 137, 518–524 CrossRef CAS PubMed.
- J. Pérez-Juste, I. Pastoriza-Santos, L. M. Liz-Marzán and P. Mulvaney, Coord. Chem. Rev., 2005, 249, 1870–1901 CrossRef.
- M. M. Alvarez, J. T. Khoury, T. G. Schaaff, M. N. Shafigullin, I. Vezmar and R. L. Whetten, J. Phys. Chem. B, 1997, 101, 3706–3712 CrossRef CAS.
Footnote |
† Electronic supplementary information (ESI) available: EDX, ICP-OES, and magnetic data. See DOI: 10.1039/c6ra16676h |
|
This journal is © The Royal Society of Chemistry 2016 |
Click here to see how this site uses Cookies. View our privacy policy here.