A visible light mediated synergistic catalyst for effective inactivation of E. coli and degradation of azo dye Direct Red-22 with mechanism investigation

Saraschandra Naraginti, Yi Li* and Yunbo Wu
Key Laboratory of Integrated Regulation and Resource Development on Shallow Lakes, Ministry of Education, College of Environment, Hohai University, Nanjing – 210098, PR China. E-mail: envly@hhu.edu.cn

Received 22nd June 2016 , Accepted 4th August 2016

First published on 5th August 2016


Abstract

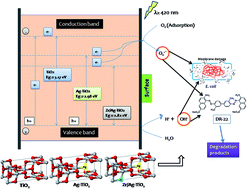
Novel zirconium and silver co-doped TiO2 nanoparticles were fabricated and utilized as effective multifunctional visible light photocatalysts for inactivation of bacteria (E. coli) as well as degradation of dye pollutant (Direct Red-22) for the first time. Results revealed co-doping of Ag and Zr in the lattice of TiO2 could remarkably narrow the band gap (2.82 eV) indicated by UV-Vis and photoluminescence studies. The degradation pathway for Direct Red-22 (50 mg L−1) proposed using LC-MS, reveals the breaking of the dye into low-toxic metabolites after 5 h. The bactericidal effect against E. coli was found to be high for Zr/Ag–TiO2 (100% inhibition) compared to Ag–TiO2 (74% inhibition) and Zr–TiO2 (48% inhibition), which was further supported by TEM and K+ release assay (3.21, 2.34 and 1.62 ppm of K+ for Zr/Ag–TiO2, Ag–TiO2 and Zr–TiO2, respectively). DNA analysis indicated no fragmentation during inactivation. Detailed analysis of the reaction mechanism was performed by active species (˙OH and O2˙) trapping experiments, NBT transformation and terephthalic acid-photoluminescence probing technique (TA-PL). The activity is found to correlate with the concentration of radicals and is found to be maximum for Zr/Ag–TiO2. This work is expected to provide new insights into multifunctional nanomaterials for applications in solar photocatalytic degradation of harmful organics and common pathogenic bacteria in wastewater.

Introduction

Wastewater is composed of different pollutants including toxic chemicals, bacteria and viruses. Though various strategies have been studied,1–3 it still remains a great challenge to eliminate harmful chemicals and disease-causing microorganisms employing a single material. One means of attaining this objective would be the preparation of new multifunctional composite materials capable of efficiently degrading organic pollutants and eliminating common pathogenic bacteria via an eco-friendly process.

Azo dyes have been extensively used in textile industries and up to 10–15% are released into wastewater during their production and application procedures.4,5 These dyes cause severe threat to the aquatic environment owing to their bio-resistance, visibility, toxicity and carcinogenic effects.6,7 Further, azo dye-rich textile wastewaters are resistant to the conventional biological treatments because of the stability of azo dyes. The complex structures of these dyes make them highly refractory and their complete mineralization is difficult to attain. Hence, removal of these dyes without causing secondary pollution is significant from an environmental viewpoint.

The use of visible light photocatalysis for the degradation of organic pollutants and elimination of pathogenic bacteria over multifunctional semiconductors showed promising results towards environmental remediation using abundant solar energy. Doping of transition and alkaline earth elements into TiO2 lattice by physical and chemical processes was been found to be useful in obtaining visible light active catalysts.8 However, these metal dopants have to be used in small quantities to avoid the recombination of photo-generated electrons and holes, which is bolstered by the large amount of these dopant species.9 Thus, a low concentration co-doping could be an effective solution to enhance the visible light absorption efficiency as well as to reduce the recombination of the photo-generated charges.

Semiconductors are known to be a promising material as photocatalysts for decontamination and purification of wastewater. Doping of two different elements into TiO2 photocatalysts has attracted significant interest since it can exhibit higher photocatalytic activity and unique characteristics compared to doping with a single element in visible light.10–12 Furthermore, few reports are also available on the synergistic effects of the co doped TiO2 photocatalysts.13,14 As a transition metal, addition of zirconium to TiO2 lattice could lead to enhanced phase stability, smaller particles, suppression of electron–hole recombination, and increased surface area, ultimately enhancing the photocatalytic activity.15–17 Wang et al. reported that incorporation of Zr4+ into TiO2 led to small grain size, high surface area, large lattice deformation, and formation of electron capture traps, all of which facilitates higher separation efficiency of the photogenerated carriers.18,19 These electron–hole pairs induce a series of reactions which involves the formation of sufficient concentrations of highly reactive oxygen species (ROS) which are believed to drive the photocatalytic disinfection process. In fact, the photo-generated holes and electrons trapped on the surface of the semiconductor react with adsorbed species to initiate the formation of highly ROS, ˙OH and O2˙, capable of mineralizing pollutants.

Though reports are available for visible light driven metal doped TiO2 nanoparticles for disinfection of bacteria,20–22 to the best of our knowledge this is the first report on Zr and Ag co-doped TiO2 as a multifunctional visible light photocatalyst. In continuation to our previous study,23 the present work is focused mainly on degradation of Direct red 22 (DR-22) and disinfection of Escherichia coli (E. coli) bacterium using Zr/Ag–TiO2 nanoparticles under visible light conditions. Further, investigation of reaction mechanism involved in the degradation and disinfection process was carried out by active species trapping and quantification experiments of O2˙ and ˙OH production over Zr/Ag–TiO2 composite. Disinfection experiments in the dark suggest presence of metallic Ag and Zr and adsorption of bacterial cells on the nanoparticles causes significant loss in cell viability. However, visible light mediated disinfection experiments revealed that the significantly improved photocatalytic activity could be attributed to the incorporation of two metals into TiO2 resulting in the more efficient charge separation and reduced recombination probability of photoexcited electron–hole pairs, thus enabling highly powerful oxidation and reduction capability. Hence, the enhanced disinfection ability of the nanoparticles suggests a synergistic effect.

Materials and methods

Materials

Titanium(IV) isopropoxide terephthalic acid (TA) and nitro blue tetrazolium chloride (NBT) from Sigma Aldrich, Direct Red 22 dye from local textile industry, hydrazine hydrate and zirconyl nitrate [ZrO(NO3)2] from SRL chemicals, Tween 20 and Müller–Hinton agar from Himedia, were used in the present study.

Synthesis of Zr and Ag co-doped TiO2 nanoparticles

Pure TiO2 nanoparticles are prepared as follows; a mixture of 5 mL of titanium(IV) isopropoxide in 50 mL isopropanol was added drop wise to 200 mL of distilled water maintained at pH 1.5 while the solution was continuously stirred. This TiO2 sol was dried at 100 °C for 24 h, and then calcined at 450 °C for 4 h to obtain the nano particles. Ag/TiO2, Zr/TiO2 and Zr/Ag–TiO2 nano particles were prepared by the above method with few modifications. For Ag–TiO2 nanoparticles preparation, required amount of aqueous solutions of AgNO3 (0.2–0.8 mol%), for Zr–TiO2 nanoparticles, required amount of aqueous solutions of ZrO(NO3)2 (0.2–0.8 mol%), while for Zr/Ag–TiO2 nanoparticles required amounts of aqueous solutions of both AgNO3 and ZrO(NO3)2 (0.2–0.8 mol%) were added drop wise to the TiO2 sol with continuous stirring for 45 min. A small aliquot of distilled water, 0.05 M hydrazine hydrate and 5 mL of Tween 20 were added to all the above solutions with stirring continued for additional 30 min. The resultant sol was sonicated at 80 MHz for 90 min and then dried at 100 °C in a hot air oven for 24 h to get the dry gel. The gel was then calcinated at 450 °C to obtain required nanoparticle powders.

Characterization of nanocomposite

Powder XRD crystallogram was recorded using X-ray BRUKER D8 Advance X-ray diffractometer with Cu Kα source (λ = 1.5406 Å). The crystalline phase of the nanoparticles was identified by comparing the major peak positions with standard JCPDS files. JEOL JEM 2100 high resolution transmission electron microscope (HRTEM) was used for imaging, SAED pattern and energy dispersive X-ray pattern with an accelerating voltage of 200 kV at different magnification. Diffuse reflectance spectra were recorded using JASCO V-670 UV-Vis spectrophotometer. The photoluminescence (PL) spectra were obtained using HITACHI F-7000 fluorescence spectrophotometer. XPS data was acquired using Kratos Axis Ultra 165 Spectrometer with a monochromated Al Kα X-ray source ( = 1486.6 eV).

Photocatalytic degradation of dye

The photo-catalytic activity was assessed by measuring the decomposition of the aqueous solution of Direct Red 22 (DR-22) under visible irradiation using a 300 W Xe lamp and cut off filter (λ ≥ 420 nm). For carrying out the photo-catalysis experiments, 50 mL of the dye solution containing appropriate quantity of the catalyst suspensions was used. DR-22 solutions (50 mg L−1) containing 25 mg of photocatalyst samples were put in a sealed glass beaker and first ultrasonicated, and then stirred in the dark for 1 h to ensure absorption–desorption equilibrium. After visible light illumination, 2 mL of samples were withdrawn at regular time intervals and separated through centrifugation. The supernatants were analyzed by recording variations of the absorption band maximum in the UV-Vis spectra of the dye molecule by using JASCO V-670 UV-Vis spectrophotometer at 549 nm.

HPLC and LC-MS analysis

The degraded metabolites were extracted (0 h and 5 h) from the supernatant using equal volume of ethyl acetate. The extracts were then evaporated to dryness in rotary evaporator and dissolved in 2 mL HPLC grade methanol. HPLC analysis was carried out (Agilent 1260 series) on Reverse Phase C18 column (symmetry, 4.6 × 150 mm) equipped with dual λ UV-Vis detector. The mobile phase used was a mixture of methanol and water (40[thin space (1/6-em)]:[thin space (1/6-em)]60) with an eluant flow rate of 0.8 mL min−1 for 10 min. HPLC-MS analysis for the degraded metabolites was carried out using Thermo Finnigan Surveyor-Thermo LCQ Deca XP MAX. The mobile phase used was a mixture of methanol and water (50[thin space (1/6-em)]:[thin space (1/6-em)]50) at a flow rate of 0.2 mL min−1 for 60 min. The separation was carried out on a BDS HYPERSIL C-18 (4.6 × 250 mm, 5.0 μm) HPLC column. The mass spectra were obtained using Electro Spray Ionization (ESI) under the flow of helium gas at 1 mL min−1 approximately and the fragment voltage was of 16 V.

Bactericidal activities of samples

For the photocatalytic inactivation test, a Gram negative bacterium Escherichia coli (ATCC 25922) was selected. Log phase bacterial culture comprising 108 cfu mL−1 (colony-forming unit per mL) grown in nutrient broth was used for antibacterial experimentation. The photocatalytic inactivation was carried out using a 300 W Xe lamp with cut-off filter (λ ≥ 420 nm) as visible light source. Fig. 1 illustrates the photocatalytic inactivation experiment. For bactericidal activity, Zr/Ag–TiO2 photocatalyst (5 mg) was stirred with bacterial suspension in saline solution (10 mL, 0.9% NaCl at pH 7.0) and irradiated to visible light. Small aliquots (100 μL) from the test suspension samples were withdrawn at regular time intervals (every 1 h) and spread on freshly prepared Mueller–Hinton agar plates. These plates were then incubated at 37 °C for 24 h. Standard plate count method was used to determine viable number of cells as cfu mL−1. Similar experiment was conducted for Ag–TiO2 and bare TiO2 nanoparticles. A dark experiment was performed similarly with photocatalyst without light irradiations for all samples. Control runs were carried out under the same irradiation conditions without photocatalyst. All experiments were performed under sterile conditions.
image file: c6ra16141c-f1.tif
Fig. 1 Experimental setup for photocatalytic inactivation of bacteria.

In order to further investigate the effect of the composite on the bacterial cells, the best sample Zr/Ag–TiO2 was selected as the antibacterial composite from the viable bacterial numbers after incubation for 24 h. 5 mg of the photocatalyst was then added to pre cultured strain with cell concentration of 108 cfu mL−1. The cell suspension was then irradiated under visible light for different times (0, 3 h and 5 h). For TEM characterization of untreated and treated bacterial samples, 10 μL of each cell dispersion was loaded on TEM copper grids and air-dried copper grids were examined using the TEM (JEOLJEM-2100).

Active species trapping and O2˙ & ˙OH quantification experiments

Terephthalic acid (TA) and nitro blue tetrazolium (NBT) were used in order to investigate the main active species, such as hydroxyl radicals (˙OH) and superoxide radicals (˙O2) produced during the photoreaction process respectively. To determine the production of ˙OH radicals, 25 mg of the photocatalyst was added to a 50 mL mixture of TA solution (3 mmol) and NaOH (10 mmol). The production of ˙OH radicals under visible light irradiation was monitored by HITACHI F-7000 Fluorescence Spectrophotometer. TA readily reacts with ˙OH hydroxyl radicals to generate 2-hydroxyterephthalic acid (TAOH) which emits fluorescence around 426 nm on excitation of its own 312 nm absorption band. The increase in photoluminescent intensity of TAOH with time is directly proportional to the ˙OH radicals generation. Similarly, NBT (10 ppm) was used to detect the amount of ˙O2 radicals generated from 25 mg of catalyst. The production of superoxide radicals in suspension was quantitatively analyzed by monitoring the concentration of NBT in the supernatant solutions through measuring the absorbance at 259 (λmax) in a UV-Vis spectrophotometer (Thermo Scientific Orion aqua mate 8000).

DNA analysis

Bacterial cell suspensions at different time intervals were harvested and the DNA was extracted with OMEGA Bacteria DNA Kit (D3350-01). The amount of DNA was quantified with a micro volume spectrophotometer (Nano Drop 2000, Thermo Scientific) at 260 nm. Electrophoresis was performed to separate and visualize DNA fragment in a 0.8% agarose gel at 130 V for 25 min. Genomic DNA was stained with the gel stain.

Potassium release assay

To determine potassium ion (K+) release during inactivation process 10 mL of cell suspension was removed at various time intervals and filtered through a (0.22 μm) filter unit (Ronghua Scientific, China) into a plastic centrifuge tube. These cell-free solutions were used for assay of leaked potassium by a Perkin-Elmer Analyst 700 atomic absorbance spectrometer.

Results and discussion

Characterization of catalyst and degradation of DR-22 under visible light

Optical properties. In order to prove the mechanism responsible for the improved visible-light induced photocatalysis, we conducted a series of tests such UV-Vis absorption spectra (DRS mode) and photoluminescence spectra (PL). UV-Vis absorption spectra of pure TiO2, Ag–TiO2 and Zr/Ag–TiO2 are shown in Fig. S1(a). A well defined band edge in the UV region of 300–350 nm seen could be attributed to the photo-excitation taking place from valence band to conduction band.

The energy gap is calculated from the following equation,

 
(αhν)2 = A(Eg)n (1)
where α is the absorption coefficient, A is a constant and n = 2 for direct transition; n = 1/2 for indirect transition.24 An extrapolation of Kubelka Munk plot of hν vs. (αhν)2 was used to get the value of the optical energy gap (Eg) as shown in Fig. S1(b).

The energy band gap values for the pure TiO2, Ag doped TiO2 & Zr and Ag co-doped TiO2 nanoparticles were found to be approximately 3.17 eV, 2.98 eV and 2.82 eV respectively. It was observed that the doping of titanium dioxide with transition metals (silver and zirconium) was accompanied with a decrease in the band energy and an increase in the wave length (red shift). These results indicate that both silver and zirconium doped TiO2 nanocomposites have greater possibility to exhibit a higher photo-catalytic activity in the visible region. Fig. S1(c), shows the photoluminescence spectra of the prepared composites. The PL spectrum of the undoped TiO2 is also displayed for comparison. All spectra show near band gap emission (NBE) and blue or deep level emission. From the PL spectra it reveals suppression of NBE on doping TiO2 with silver as well as zirconium. This may be due to the suppression of recombination of the photogenerated electron–hole pairs on doping TiO2 with silver and zirconium. Creation of hetero junction slows down the electron–hole recombination and hence reduces the emission.

X-Ray diffraction. Fig. 2 shows the X-ray diffraction pattern of Zr–Ag/TiO2 (a) and (b) Ag–TiO2 nanoparticles (0.2–0.8 mol%). In all the samples, anatase phase was confirmed by the 2θ peaks at 25.3°, 37.9°, 47.9°, 55.0° and 62.8°, all of them are in complete agreement with peaks corresponding to the anatase phase TiO2. Neither diffraction peaks corresponding to metallic zirconium nor to silver particles are present and hence their doping did not result in any significant changes in the phase crystallinity; in addition, the corresponding oxide compounds (ZrxOy or AgxOy) are not observed either. It seems Ag and Zr did not show any phase changes suggesting that aggregates might have been formed on the crystal borders and on the surface of the photocatalyst, thus promoting visible light absorption as discussed earlier.
image file: c6ra16141c-f2.tif
Fig. 2 X-ray diffraction pattern of synthesized nanoparticles.
TEM and EDX analysis. The morphologies of the nanoparticles were analyzed under TEM. Fig. S2(a) and S3(a), show images of Ag doped TiO2 & Zr and Ag co-doped TiO2 sample showing highly uniform nano-crystalline nanostructures with uniform grain size, as indicated by the XRD data. From the images it could be inferred that the uniformly distributed particles range from 6 to 20 nm and 7 to 19 nm, for Ag doped TiO2 & Zr and Ag co-doped TiO2 respectively, with irregular sized spherical morphologies and slight agglomeration. The SAED patterns of these samples are shown in Fig. S2(b) and S3(b), in which the dark rings on the right correspond to the standard polycrystalline diffraction rings for the anatase phase (indexed). Interestingly, no signs of diffraction rings related to other phases were observed. From the EDX profile [Fig. S2(d) and S3(d)] the composition of elements present in Ag–TiO2 sample was measured and the weight% of Ag, Ti, and O was found to be 25.09, 24.73, and 50.18. Similarly the elemental composition of Zr/Ag–TiO2 was measure and weight% of Zr, Ag, Ti and O was found to be 20.08, 19.19, 19.87 and 40.86 respectively. The stoichiometry of both AgTiO2 (1[thin space (1/6-em)]:[thin space (1/6-em)]1[thin space (1/6-em)]:[thin space (1/6-em)]2) and ZrAgTiO2 (1[thin space (1/6-em)]:[thin space (1/6-em)]1[thin space (1/6-em)]:[thin space (1/6-em)]1[thin space (1/6-em)]:[thin space (1/6-em)]2) materials was confirmed by this measurement. HR-TEM images [Fig. S2(c) and S3(c)] were used to obtain more discernible microstructure information to enable accurately analyze the single grains and grain boundaries.
XPS analysis. In order to investigate the surface composition and chemical state of the Zr/Ag–TiO2 powders prepared (0.8 mol%), XPS analysis was performed on the Kratos Axis Ultra 165 Spectrometer with Al Kα radiation. The detailed XPS scans were obtained for Ag 3d, Zr 3d, Ti 2p and O 1s to distinguish whether dopant atoms weaved into crystal lattice of TiO2 or formed various compounds with Ti, O, and dopant elements. Fig. 3(a) shows XPS data of Ag at 3d core levels. The Ag 3d5/2 and Ag 3d3/2 core level binding energies appeared at 368.1 and 374.1 eV, respectively, which are in good agreement with bulk silver metallic values.25,26 The Zr 3d photoelectron peaks have been observed at 182.4 and 184.6 eV corresponding to Zr 3d5/2 and Zr 3d3/2 respectively, [Fig. 3(c)], and are assigned to the +4 oxidation state of zirconium.27 The binding energies of Ti 2p [Fig. 3(c)] photoelectron peaks at 459.2 and 464.9 eV corresponds to Ti 2p3/2 and Ti 2p1/2 lines, respectively.28,29 These values indicate that titanium is present in the +4 oxidation state. Fig. 3(d) shows the broad spectrum of Zr/Ag–TiO2 nanocomposite. These results indicate that in Ag/Zr–TiO2 nanocomposite silver, titanium and zirconium metal ions are present in their highest oxidation state. The existence of Ag and Zr in broad XPS spectrum and detection of no new compound between Ag, Zr, O, and Ti atoms other than TiO2, clearly ascertain that Ag and Zr atoms are doped into TiO2 crystal lattice.
image file: c6ra16141c-f3.tif
Fig. 3 XPS spectra of Ag 3d (a) Zr 3d (b) Ti 2p (c) and broad spectrum (d) of Zr/Ag–TiO2 nanocomposite.
Photocatalytic degradation of DR-22. To explain the photocatalytic activity of the Zr/Ag–TiO2 nanocomposite sample, the kinetic behavior was investigated using DR-22 (50 ppm). The photocatalytic degradation reaction kinetics of DR-22 can be described by a Langmuir–Hinshelwood model. The plot of ln(C0/C) versus the irradiation time interval with various photocatalysts in 5 h under visible light irradiation is shown in Fig. 4. From the results it is revealed that degradation of DR-22 follows first-order kinetics because the regression coefficients (R2) are all above 0.8856. Evidently, among the tested photocatalysts for degradation, Zr/Ag–TiO2 nanocomposite exhibits best performance with rate constant k = 0.1745 min−1.
image file: c6ra16141c-f4.tif
Fig. 4 Degradation of DR-22 under visible light irradiation at different time intervals.
Plausible degradation pathway of DR-22. The HPLC analysis report of the dye sample at the initial time (0 h) showed a single peak of DR-22 at a retention time of 1.45 min. After a period of 5 h as the photo degradation proceeded, the HPLC chromatogram of the degraded sample showed the presence of new peaks at 1.42 and 1.55 min respectively (Fig. S4). The HPLC profile indicates the fragmentation of DR-22 into various compounds.

The LC-MS analysis was carried out in order to verify the possible intermediates formed during the photocatalytic degradation by Zr/Ag–TiO2 nanoparticles. The degradation of DR-22 dye is confirmed by LC-MS chromatograms of dye (0 h) and its degraded sample (5 h) shown in Fig. 5. The retention times of all the degraded products are in the range of 13.03–15.72 which are different from the retention time of control dye DR-22 at 8.69. The LC-MS analysis of DR-22 and its degraded product confirms the photocatalytic degradation of dye by Zr/Ag–TiO2 nanoparticles under visible light irradiation.


image file: c6ra16141c-f5.tif
Fig. 5 LC-MS chromatograms of DR-22 dye and degraded sample.

The structure of the DR-22 dye is confirmed through LC-MS spectral analysis. The purity of DR-22 is represented as a single peak in the LC-MS chromatogram at a retention time of 8.69 min. The base peak appeared at m/z 96.90 and the high intense fragment ion peaks appeared at m/z 648.11, 287.18 & 79.09 in the LC-MS spectrum confirming the chemical structure of DR-22 dye (Fig. S5 and 6).


image file: c6ra16141c-f6.tif
Fig. 6 Proposed mass fragmentation pattern of DR-22 dye.

The absence of dye peak in the LC-MS chromatogram of degraded sample indicates the complete degradation of dye and formation of colorless low molecular fragments by Zr/Ag–TiO2 nanoparticles. LC-MS analysis of the DR-22 dye degraded sample demonstrated the presence of compounds with molecular weight of 648.75, 227.30 and 110.18 which could be interpret as structure A, C and D respectively. Similarly compounds with molecular weights 726.73, 696.12, 684.78, 652.79, 603.19, 556.61, 474.25, 459.10, 159.21 and 128.17 which could be interpreted as structures B, E, F, G, H, I, J, K, L and M respectively (Fig. 7 and S6). The higher mass present in the LCMS pattern could be due to the recombination of two different intermediate compounds in the solution during the photodegradation, further systematic analysis is required to further confirm the precise structures.


image file: c6ra16141c-f7.tif
Fig. 7 Proposed mass fragmentation pattern of DR-22 from LC-MS pattern.
Bactericidal activity against E. coli.
Visible light photocatalytic disinfection. To study the effect on the visible light bactericidal activity of transition metal doped in TiO2, the antibacterial effect of bare TiO2, Ag–TiO2 and Zr/Ag–TiO2 was tested. For this, the light and dark (in the absence of visible light irradiation) experiments were carried out. Fig. 8 shows that Ag–TiO2 and Zr/Ag–TiO2 nanoparticles have shown some effect on bacterial survival in dark. The antibacterial activities of these prepared samples in the dark could be due to the presence of antibacterial agents (Ag or Ag+ nanoparticles) and their penetration into the cell membrane, leading to the cell death. Ag–TiO2 nanoparticles showed 41% inhibition while Zr/Ag–TiO2 nanoparticles showed 46% inhibition in the dark after 5 h incubation. Bare TiO2 and control samples in the presence of visible light did not show any effect on bacterial survival; however Ag–TiO2 and Zr/Ag–TiO2 nanoparticles showed remarkable effect on bacterial viability.
image file: c6ra16141c-f8.tif
Fig. 8 % survival of E. coli with prepared nanoparticles as a function of time.

Fig. 9 and 10, clearly demonstrated the bactericidal effect of Ag–TiO2 and Zr/Ag–TiO2 nanoparticles under visible light irradiation. It can be seen from the figure that nearly 74% inhibition was found in the case of Ag–TiO2, while 100% inhibition was observed for Zr/Ag–TiO2 nanoparticles after 5 h incubation. E. coli colonies were absent in samples treated with Zr/Ag–TiO2 nanoparticles. In contrast, few colonies were observed in Ag–TiO2 treated samples.


image file: c6ra16141c-f9.tif
Fig. 9 Photographs of bactericidal effect on E. coli by Ag–TiO2 nanoparticles under visible light exposure.

image file: c6ra16141c-f10.tif
Fig. 10 Photographs of bactericidal effect on E. coli by Zr/Ag–TiO2 nanoparticles under visible light exposure.

The enhanced bactericidal activity of both Ag–TiO2 and Zr/Ag–TiO2 nanoparticles under visible light irradiation could be attributed to the synergistic effect of the nanoparticles. To understand the synergistic effect of nanoparticles on bacterial inactivation, disinfection experiments were conducted in dark. All doped and undoped TiO2 nanoparticles shown significant inhibition in bacterial cell growth (Fig. 8). This was possibly due to the adsorption of bacterial cell onto nanoparticles surfaces; the stress caused by the adsorption may increase cell mortality. Ag–TiO2 nanoparticles reduced the viable cell count to 34% and Zr–TiO2 reduced to 21% while Zr/Ag–TiO2 nanoparticles reduced to 41% in 5 h. In the absence of light, the inactivation mechanism was mainly due to direct contact with metallic Ag & Zr nanoparticles. Formation of toxic Ag species such as Ag+, Ag(0), AgCl, and AgCl2-lead to more disinfection in the case of Ag–TiO2 compare to Zr–TiO2 as suggested by the previous reports.30–32

Visible light irradiation induces photoexcitation of the catalyst which finally leads to the generation of reactive oxygen species (ROS) ˙OH and O2˙ radicals which causes more disinfection. These radicals initially damage the surfaces of the bacterial cells before breaking the cell membrane at weak points. A relatively high rate of bactericidal activity was found in the case of Zr/Ag–TiO2 nanoparticles which could be due to the co-doping of two metals leading to high photoexcitation and ˙OH and O2˙ radicals production. Our results are in good agreement with some previous reports.33–35

Transmission electron microscopic analysis. Transmission electron microscope was used to identify the morphological changes in the bacterial membrane on photocatalytic degradation by Zr/Ag–TiO2 nanoparticles (Fig. 11). The figure clearly showed the undamaged cell wall membrane of E. coli in the control sample (0 h) indicating cells were healthy. However, after 1 h and 3 h of visible light irradiation in the presence of the catalyst showed significant damage in the cell wall membrane. The damaged cell membrane could be clearly seen in the figure after 5 h of irradiation. The presence of nanoparticles on bacterial cells is shown by red arrow and ruptured cells are indicated by yellow arrow. These results indicate that the cell membrane ruptured during the photooxidation process.
image file: c6ra16141c-f11.tif
Fig. 11 TEM images of E. coli treated with Zr/Ag–TiO2 nanoparticles at different time intervals.
K+ release assay. To further support the results of bacterial membrane damage the amount of K+ was estimated during the photodegradation. K+ is present virtually in all bacteria and plays an important role in the regulation of polysome content and protein synthesis. The leakage of K+ from the inactivated bacteria is because of the permeability change in the membrane resulting in the loss of cell viability. The leakage of K+ from inactivated E. coli at different time intervals was measured by a Perkin-Elmer Analyst 700 atomic absorbance spectrometer and the result is shown in Fig. 12. There was no significant leakage of K+ from E. coli in the case of bare TiO2 in dark as well as in the presence of visible light, indicating that the control experiments had no bactericidal effect or very low bactericidal activity. However, both Ag–TiO2 and Zr/Ag–TiO2 nanoparticles have shown significant bactericidal activity in dark and the concentration of K+ released in this treatment was 1.0 and 1.2 ppm respectively. This could be due to the release of Ag+ and penetration of nanoparticles into the bacterial membrane as discussed earlier. Interestingly, much higher concentration of K+ was released (2.34 and 3.21 ppm) from the inactivated E. coli in the presence of visible light (5 h) with Ag–TiO2 and Zr/Ag–TiO2 respectively. In the case of Zr/Ag–TiO2 after 5 h of irradiation the cell membrane is completely destroyed along with severe leakage of intracellular contents. This indicates that the cell is completely inactivated and decomposed during the photocatalytic process by various ROSs, especially ˙OH, O2˙ and H2O2 originating from the hybrid photocatalyst under visible light irradiation which agrees with the above results of TEM analysis. All our results are in good agreement with some previous reports.36–39
image file: c6ra16141c-f12.tif
Fig. 12 Leakage of K+ from E. coli by prepared nanoparticles at different time intervals.
DNA analysis. In order to verify whether bacterial inactivation was a result of DNA damage, we carried out experiments to examine the effects using Zr/Ag–TiO2 nanoparticles by gel electrophoresis (Fig. S7). It indicates that the DNA extracted from E. coli suspension did not undergo fragmentation during the photocatalysis process, this result revealed that the disinfection is mainly due to the membrane damage (Fig. 11).
Mechanism investigation on enhanced photocatalytic activity. Many researchers reported that ROS plays a crucial role in photocatalytic inactivation of bacteria as well as degradation of organic pollutant experiments.40–42 In photocatalytic inactivation of bacteria, ROS initially damaged the surface of the bacterial cells before breakage of the cell membrane at weak points. This finally lead to leakage of the internal bacterial components from the cells through the damaged sites.43

Experiments have been carried out to further support the mechanism and it was found that the ˙O2 and ˙OH radicals mainly contribute to the degradation of both bacteria and dye molecule with Zr/Ag–TiO2 under visible light irradiation (λ ≥ 420 nm). Quantification experiments of ˙O2 production have been done through the transformation of NBT (detection agent of ˙O2) during the photocatalytic reaction.44 Fig. 13 represents the spectra of the transformation percentage of NBT at different time intervals. The result indicate that Zr/Ag–TiO2 nanoparticles showed much higher transformation percentage of NBT (Fig. 13(d)), compared to Ag–TiO2 (Fig. 13(c)) after 5 h of visible irradiation. This could be attributed to the lower band gap energy of Zr/Ag–TiO2 (2.82 eV) than Ag–TiO2 (2.98 eV) nanoparticles as seen from the Tauc plot (Fig. S1(b)), and also to the lower recombination rate of the photogenerated electron–hole pairs on doping depicted by PL intensities (Fig. S1(c)). After the photoexcitation of the catalyst, most of the electrons generated remain in the CB (conduction band) to react with O2 to generate more ˙O2. It was proved by the highest transformation percentage of NBT in case of Zr/Ag–TiO2 as shown in Fig. 13(d). Due to smaller band gap, the photogenerated electrons in VB (valence band) can easily transfer to the CB of Zr/Ag–TiO2 resulting in more effective charge separation and reducing the probability of recombination of electron–hole pairs in the Zr/Ag–TiO2 nanoparticles, which finally leads to more photogenerated electrons for reaction with O2 to produce ˙O2 and take part in decomposition of DR-22 as well as membrane damage of E. coli, which is in good agreement with the active species trapping experiments [Fig. 13].


image file: c6ra16141c-f13.tif
Fig. 13 Fluorescence spectra of a TAOH solution generated by (a) Ag–TiO2, (b) Zr/Ag–TiO2 nanoparticles and spectra of NBT transformation generated by (c) Ag–TiO2, (d) Zr/Ag–TiO2 nanoparticles.

To further quantify ˙OH radicals, the terephthalic acid photoluminescence probing technique (TA-PL) was employed since TA could readily react with ˙OH radicals to from a highly fluorescent 2-hydroxyterephthalic acid (TAOH).45,46 Compared with Ag–TiO2 nanoparticles (Fig. 13(a)), the highest PL intensity was observed for Zr/Ag–TiO2 nanoparticles (Fig. 13(b)). This could be attributed to the easy charge transfer, which results in the improvement of holes on the VB of Zr/Ag–TiO2 to produce more ˙OH, resulting in the highest PL peak of Zr/Ag–TiO2 with respect to time. These results are consistent with previous report.47,48 Based on the results of NBT transformation and TA-PL results, it can be concluded that ˙O2 and ˙OH radicals play a major role in the photodegradation of DR-22 as well as inactivation of E. coli by Zr/Ag–TiO2 nanoparticles.

Conclusion

Silver and zirconium co-doped TiO2 nanoparticles have been synthesized by a facile sol–gel method for the first time. The obtained nanoparticles demonstrated remarkable visible light harvesting due to simultaneous doping of two metals (Ag and Zr) over one metal (Ag). Visible light driven degradation of toxic azo dye DR-22 was demonstrated and the plausible pathway was proposed by LC-MS. Bactericidal performance on E. coli revealed the disinfection due to damage of cell membrane and leakage of cellular components (K+). The detailed reaction mechanism of the prepared nanoparticles has been investigated by radicals capture experiments. Our results showed that active ROS (˙O2 and ˙OH) produced under visible light illumination are considered to play major role for efficient photocatalytic degradation of DR-22 and inactivation of pathogenic bacteria. The report of this study could work toward the possibility of new multifunctional composite materials for application in photocatalytic degradation of pollutants as well as bacteria in wastewater.

Acknowledgements

The study was financially supported by the National Natural Science Foundation of China for Foreign Youth Scholars, the China Postdoctoral Science Foundation (2016M591767), the Foundation for Innovative Research Groups of the National Natural Science Foundation of China (No. 51421006), Program for Environmental Protection in Jiangsu Province (2015037), and Priority Academic Program Development of Jiangsu Higher Education Institutions.

References

  1. S. Kumar, W. Ahlawat, G. Bhanjana, S. Heydarifard, M. M. Nazhad and N. Dilbaghi, J. Nanosci. Nanotechnol., 2014, 14, 1838–1858 CrossRef CAS PubMed.
  2. A. B. Baranda, A. Barranco and I. M. de Maranon, Water Res., 2012, 46, 669–678 CrossRef CAS PubMed.
  3. A. Zapata, S. Malato, J. A. Sanchez-Perez, I. Oller and M. I. Maldonado, Catal. Today, 2010, 151, 100–106 CrossRef CAS.
  4. M. García Hernandez, D. J. F. Carrillo Romo, A. García Murillo, D. Jaramillo Vigueras, M. A. Meneses Nava, P. Bartolo Perez and G. Chadeyron, J. Sol-Gel Sci. Technol., 2010, 53, 246–254 CrossRef.
  5. M. Kasiri, H. Aleboyeh and A. Aleboyeh, Appl. Catal., B, 2008, 84, 9–15 CrossRef CAS.
  6. M. Kasiri and A. Khataee, Desalination, 2011, 270, 151–159 CrossRef CAS.
  7. R. Idel-aouad, M. Valiente, A. Yaacoubi, B. Tanouti and M. López-Mesas, J. Hazard. Mater., 2011, 186, 745–750 CrossRef CAS PubMed.
  8. W. Zhao, W. H. Ma, C. C. Chen, J. C. Zhao and Z. G. Shuai, J. Am. Chem. Soc., 2004, 126, 4782–4783 CrossRef CAS PubMed.
  9. R. Dholam, N. Patel, M. Adami and A. Miotello, Int. J. Hydrogen Energy, 2009, 34, 5337–5346 CrossRef CAS.
  10. X. Zhou, F. Peng, H. Wang, H. Yu and J. Yang, J. Solid State Chem., 2011, 184, 134–140 CrossRef CAS.
  11. N. Zhao, M. Yao, F. Li and F. Lou, J. Solid State Chem., 2011, 184, 2770–2775 CrossRef CAS.
  12. X. Yanga, F. Mab, K. Li, Y. Guob, J. Hub, W. Li, M. Huoa and Y. Guob, J. Hazard. Mater., 2010, 175, 429–438 CrossRef PubMed.
  13. X. Ma, Y. Wu, Y. Lu, J. Xu, Y. Wang and Y. Zhu, J. Phys. Chem. C, 2011, 115, 16963–16969 CAS.
  14. A. Kubacka, B. B. Baeza, G. Colon and M. F. Garcıa, J. Phys. Chem. C, 2009, 113, 8553–8555 CAS.
  15. X. C. Wang, J. C. Yu, Y. L. Chen, L. Wu and X. Z. Fu, Environ. Sci. Technol., 2006, 40, 2369–2374 CrossRef CAS PubMed.
  16. P. Cheng, M. Zheng, Y. Jin, Q. Huang and M. Gu, Mater. Lett., 2003, 57, 2989–2994 CrossRef CAS.
  17. S. T. Pantelides, Rev. Mod. Phys., 1978, 50, 797–858 CrossRef CAS.
  18. Y. M. Wang, S. W. Liu, M. K. Lü, S. F. Wang, F. Gu, X. Z. Gai, X. P. Cui and J. Pan, J. Mol. Catal. A: Chem., 2004, 215, 137–142 CrossRef CAS.
  19. D. Das, H. K. Mishra, K. M. Parida and A. K. Dalai, J. Mol. Catal. A: Chem., 2002, 189, 271–282 CrossRef CAS.
  20. D. M. Tobaldi, C. Piccirillo, R. C. Pullar, A. F. Gualtieri, M. P. Seabra, P. M. L. Castro and J. A. Labrincha, J. Phys. Chem. C, 2014, 118, 4751–4766 CAS.
  21. H. M. Yadav, S. V. Otari, R. A. Bohara, S. S. Mali, S. H. Pawar and S. D. Delekar, J. Photochem. Photobiol., A, 2014, 294, 130–136 CrossRef CAS.
  22. X. Yang, J. Qin, Y. Jiang, K. Chen, X. Yan, D. Zhang, R. Li and H. Tang, Appl. Catal., B, 2015, 166–167, 231–240 CrossRef CAS.
  23. S. Naraginti, F. B. Stephen, A. Radhakrishnan and A. Sivakumar, Spectrochim. Acta, Part A, 2015, 135, 814–819 CrossRef CAS PubMed.
  24. N. J. Kim, Y. H. La, S. H. Im and B. K. Ryu, Thin Solid Films, 2010, 518, e156–e160 CrossRef.
  25. E. Sumesh, M. S. Bootharaju and A. T. Pradeep, J. Hazard. Mater., 2011, 189, 450–457 CrossRef CAS PubMed.
  26. Y. Lai, H. Zhang, K. Xie, D. Gong, Y. Tang, L. Sun, C. Lin and Z. Chen, New J. Chem., 2010, 34, 1335–1340 RSC.
  27. T. Sunekawa, K. Asami, S. Ito, M. Yashima and T. Sugimoto, Appl. Surf. Sci., 2005, 252, 1651–1656 CrossRef.
  28. K. V. Bineesh, S. Y. Kim, B. R. Jermy and D. W. Park, J. Ind. Eng. Chem., 2009, 15, 207–211 CrossRef CAS.
  29. Y. Kim, J. Lee, H. Jeong, Y. Lee, M. H. Um, K. M. Jeong, M. K. Yeo and M. Kang, J. Ind. Eng. Chem., 2008, 14, 396–400 CrossRef CAS.
  30. M. Li, M. E. Noriega-Trevino, N. Nino-Martinez, C. Marambio-Jones, J. Wang, R. Damoiseaux, F. Ruiz and E. M. V. Hoek, Environ. Sci. Technol., 2011, 45, 8989–8995 CrossRef CAS PubMed.
  31. X. Wang and T. T. Lim, Water Res., 2013, 47, 4148–4158 CrossRef CAS PubMed.
  32. S. Rtimi, M. Pascu, R. Sanjines, C. Pulgarin, M. Ben-Simon, A. Houas, J. C. Lavanchy and J. Kiwig, Appl. Catal., B, 2013, 138–139, 113–121 CrossRef CAS.
  33. K. Sunada, W. Toshiya and H. Kazuhito, Environ. Sci. Technol., 2003, 37, 4785–4789 CrossRef CAS PubMed.
  34. Y. S. Kim, L. T. Linh, E. S. Park, S. Chin, G. N. Bae and J. Jurng, Powder Technol., 2012, 215, 195–199 CrossRef.
  35. X. Wang and T. T. Lim, Water Res., 2013, 47, 4148–4158 CrossRef CAS PubMed.
  36. G. Li, X. Nie, J. Chen, Q. Jiang, T. An, P. K. Wong, H. Zhang, H. Zhao and H. Yamashita, Water Res., 2015, 86, 17–24 CrossRef CAS PubMed.
  37. Y. M. Chen, A. H. Lu, Y. Li, L. S. Zhang, H. Y. Yip, H. J. Zhao, T. C. An and P. K. Wong, Environ. Sci. Technol., 2011, 45, 5689–5695 CrossRef CAS PubMed.
  38. W. J. Wang, Y. Yu, T. C. An, G. Y. Li, H. Y. Yip, J. C. Yu and P. K. Wong, Environ. Sci. Technol., 2011, 46, 4599–4606 CrossRef PubMed.
  39. H. M. Yadav, S. V. Otari, V. B. Koli, S. S. Mali, C. K. Hong, S. H. Pawar and S. D. Delekar, J. Photochem. Photobiol., A, 2014, 280, 32–38 CrossRef CAS.
  40. G. Vereb, L. Manczinger, G. Bozso, A. Sienkiewicz, L. Forro, K. Mogyorosi, K. Hernadi and A. Dombi, Appl. Catal., B, 2013, 129, 566–574 CrossRef CAS.
  41. M. Li, M. E. Noriega-Trevino, N. Nino-Martinez, C. Marambio-Jones, J. Wang, R. Damoiseaux, F. Ruiz and E. M. V. Hoek, Environ. Sci. Technol., 2011, 45, 8989–8995 CrossRef CAS PubMed.
  42. P. C. Maness, S. Smolinski, D. M. Blake, Z. Huang, E. J. Wolfrum and W. A. Jacoby, Appl. Environ. Microbiol., 1999, 65, 4094–4098 CAS.
  43. P. Bansal, G. Ram Chaudhary and S. K. Mehta, Chem. Eng. J., 2015, 280, 475–485 CrossRef CAS.
  44. J. W. Liou and H. H. Chang, Arch. Immunol. Ther. Exp., 2012, 60, 267–275 CrossRef CAS PubMed.
  45. L. Ye, J. Liu, Z. Jiang, T. Peng and L. Zan, Appl. Catal., B, 2013, 142–143, 1–7 CAS.
  46. K. I. Ishibashi, A. Fujishima, T. Watanab and K. Hashimoto, Electrochem. Commun., 2000, 2, 207–210 CrossRef CAS.
  47. N. Arunkumar and R. Vijayaraghavan, RSC Adv., 2014, 4, 65223–65231 RSC.
  48. N. Tian, H. Huang, Y. He, Y. Guo, T. Zhang and Y. Zhang, Dalton Trans., 2015, 4297–4307 RSC.

Footnote

Electronic supplementary information (ESI) available. See DOI: 10.1039/c6ra16141c

This journal is © The Royal Society of Chemistry 2016
Click here to see how this site uses Cookies. View our privacy policy here.