Forced infiltration of silica beads into densely-packed glass fibre beds for thin composite laminates

Ye Chan Kima, Hyunsung Mind, Jeongsu Yud, Sung Yong Hongb, Mei Wanga, Sang Hoon Kima, Jonghwan Suhrab, Young Kwan Leec, Kwang J. Kime and Jae-Do Nam*ab
aDepartment of Energy Science, Sungkyunkwan University, 2066, Seobu-ro, Jangan-gu, Suwon-si, Gyeonggi-do, Republic of Korea. E-mail: jdnam@skku.edu
bDepartment of Polymer Science and Engineering, Sungkyunkwan University, 2066, Seobu-ro, Jangan-gu, Suwon-si, Gyeonggi-do, Republic of Korea
cDepartment of Chemical Engineering, Sungkyunkwan University, 2066, Seobu-ro, Jangan-gu, Suwon-si, Gyeonggi-do, Republic of Korea
dInformation Technology & Electronic Materials Research Institute, LG Chem, Ltd, Research Park, 104-1, Moonji-dong, Yuseong-gu, Daejeon, Republic of Korea
eDepartment of Mechanical Engineering, University of Nevada Las Vegas, 4505 S. Maryland Parkway, Box 454027, Las Vegas, NV 89154-4027, USA

Received 9th June 2016 , Accepted 31st August 2016

First published on 31st August 2016


Abstract

Along with the advancement of miniaturized mobile devices, packaging technology requires the utmost high-performance of thin composite laminates in terms of material properties such as the coefficient of thermal expansion (CTE) and stiffness. These two properties have been improved by the incorporating of secondary fillers (e.g., nano-sized silica beads) into the densely-packed glass fibre beds in the composite laminates. However, the secondary fillers are hardly impregnated, but usually filtered out by the fibrous bed, giving a poor distribution of the fillers. In this study, we used ultrasonication at a specific range of frequencies and time to induce bubble implosion and microjetting, which could repulse the adjacent fibres, desirably creating interstitial spaces for the secondary filler particles to move into through the densely-packed fibrous bed. The migrated secondary fillers facilitated stress transfer among the beads and fibres, and subsequently altered the thermo-mechanical properties to a great extent. More specifically, the coefficient of thermal expansion (CTE) was greatly decreased by the ultrasonication from 9.8 ppm K−1 to 6.1 ppm K−1 (by 38%) at 25 °C, and from 20.6 ppm K−1 to 15.8 ppm K−1 (by about 23%) at 175 °C. The storage modulus was increased from 7.3 GPa to 9.0 GPa (by 23%) at 40 °C. There achievements are thought to be critical improvements in the development of high performance micropackaging devices. Anisotropic ultrasonication was demonstrated as a driving force for the cooperative distribution of thermo-mechanical stresses through the bulk movement of densely-packed fibres and nanoparticles.

Introduction

As the mobile devices are miniaturized more and more in smart phones, tablet PCs, and wearable devices, etc., high density packaging technologies are used to reduce the assembly area of the substrates. The package-on-package (PoP) technology, which is one of the most advanced three-dimensional packaging technologies, has been massively adopted particularly for smaller and thinner systems. In this packaging method, the top memory package is integrated on the bottom application processor (AP) to reduce the occupying space as much as possible, using the most advanced materials and processing technology. PoP fabrication is carried out by using very thin (ca. 40 µm) and stiff (Young's modulus at 15 GPa) glass fibre/epoxy composite laminates, often containing over 60 vol% of silica fillers without void defects. PoP construction requires the welding assembly process, which is accompanied by repeated thermal cycles at elevated temperatures, usually up to 260 °C. These thermal curing/welding processes generate mismatched thermal expansions of different epoxy-based polymer materials, metal electrodes, and semiconductor chips, which subsequently creates a substantial amount of thermal stress. The coefficient of thermal expansion (CTE) of the semiconductor AP chip that is made from silicon is ca. 3 ppm K−1, which should be compared with 16.5 ppm K−1 of copper, 54 ppm K−1 of epoxy, and 18–20 ppm K−1 of its glass fibre composites. Consequently, these CTE mismatches and thermal stresses often lead to serious failures of the printed circuit boards (PCB) that appear as warpages of the assembled PCB parts, connection failures, long-term durability effects, etc. Accordingly, one of the key issues in advanced packaging technology is currently the development of low-CTE polymer-based composite laminates.

In addition to those thermal stresses, the UV/thermal curing of epoxy/glass-fibre prepregs, photoresists, and adhesives repeatedly provide a large amount of volumetric shrinkage due to the liquid-to-solid phase transformation of curing, which may very well give rise to internal stresses. These thermal and curing-induced stresses should be overcome by the robustness of the PCB frame structure, that is, the imbedded sheet of epoxy/glass fibre composite laminates. For example, a typical ‘flip chip chip scale package’ (FCCSP) that is recently applied to a mobile AP is often composed of 4 printed circuit layers in the thickness of 600 µm, of which the stiffness should be sustained by only 2–3 layers of epoxy/glass composite laminates, each ca. 40 µm in thickness. Therefore, increasing the modulus of the composite laminates while having low CTE values and loading contents is desperately needed. This may be achieved using the primary fibre fabric and the secondary silica bead that can maximize the interfacial area (or work of adhesion) of reinforcing fillers.1,2

Currently, the most advanced ultra-thin prepreg is extremely highly loaded with reinforcing fillers. One of the commercialized prepreg systems is, for example, composed of the stiffest glass fibre, T-glass fibre (20–25 wt%) as a main skeletal frame structure and tremendous amount of silica beads (60–70 wt%) as a secondary filler. Only 15–20 wt% of the epoxy matrix material is used. This type of composite laminate is specifically designed to minimize the CTE and simultaneously maximize the stiffness. It also provides excellent interfacial bonding and structural integrity with copper as well as silicon in such hostile thermal and stress conditions. In such highly loaded secondary filler systems, however, it should be mentioned that it is extremely difficult to achieve even distribution of the secondary beads in the densely-packed skeletal fibre structure of the fibre.

The fabrication of composite structures composed of two different sizes and different forms of shape is usually a challenge. It is difficult to force the secondary fillers to be incorporated in the primary skeletal structure particularly, when the bed is densely packed leaving little interstitial space. When the secondary fillers approach a densely-packed structure in composite fabrication, a high shear stress is developed near the interfaces of the two fillers, and subsequently, the densely-packed fibres filter the secondary fillers, leaving them outside of the primary fibre bed. Therefore, penetration or impregnation of the secondary fillers into the fibre bed can be hardly achieved in such methods as a hand lay-up or solvent impregnation processes.3 As a result, the secondary fillers filtered out by the fibres may very well give poor distribution of thermo-mechanical stresses, leading to substantial deterioration of the ultimate performance of the composites structures.4,5

The effect of the spatial distribution of fillers on the effective composite properties has drawn the attention of a number of researchers.4–9 It has been found that the spatial distribution of reinforcing fillers affects the stress–strain relation at the interfaces of reinforcement and matrix, which could substantially influence the thermo-mechanical properties of the composites.4–9 Compared with a composite material containing coagulated fillers, an even distribution of reinforcing fillers significantly increases the interface areas of fillers and matrix, where the stresses are transferred, and subsequently increases the thermo-mechanical properties such as tensile strength and elongation.10,11 Particularly, in our highly-loaded silica bead and anisotropic fibre systems, they could lead to a very complicated distribution of stresses. The anisotropic woven glass fabric and heterogeneous filler distribution could result in convex or concave bending, (“smile” or “cry” warpages) in the assembled PCB stacks. These warpages, or bending failures, can be caused by a slight imbalance of internal stresses. Thus, a homogenous distribution of silica beads is a significant and critical issue in the fabrication process of prepregs as well as in the final performance of high performance PCBs.

Ultrasonication has been utilized to clean contaminated surfaces.12–14 It is also used to disperse such fillers as titanium dioxide nanoparticles, nanoclay, and silica nanoparticles in polymers.15–18 When a liquid is ultrasonicated, the sound waves propagate through the media with an alternate pressure giving compression and rarefaction cycles at a given frequency.19 During rarefaction, ultrasonic waves create small vacuum bubbles or voids in the liquid, which is called acoustic cavitation. Both ultrasonic cleaning and ultrasonic dispersion use this collapsing energy of the cavitation bubbles to break the cluster of contaminant and/or nanoparticles. It is thought that the bubble cavity, which is repeatedly created and collapsed every 10−6–10−4 s, may be used to make space among adjacent fibres or beads desirably for them to be commingled during composite fabrication.20 Particularly, the nanoparticles may very well move along with the instantaneous fluid flow created by the bubble collapse, probably in the direction to the space where the population of nanoparticles is low. We consider that this phenomenon may spatially redistribute two different types of filler systems, forcing the nano-sized silica beads into the densely-packed fibre bed in the case of our study.

In this study, we investigated the ultrasonication-assisted secondary filler infiltration into the primary skeletal structure and the CTE of the fabricated composite laminates using the epoxy/glass fibre/bead composites as a model system. It was found that ultrasonication induced during the fabrication of composite laminates led to the even distribution of the secondary filler into the densely-packed fibre bed. The CTE of the composite laminates was significantly decreased by the well-distributed secondary fillers, which seemed to indicate that the stress was transferred in a facile manner between the filler and the matrix. Thus, ultrasonication could be used for the development of highly-loaded multiple-filler composite systems to improve the efficiency of reinforcement without increasing loading contents by achieving an even distribution.

Experimental

Materials

T-glass woven fabric, silica beads, and epoxy thermosetting resins were used to fabricate prepregs and composite laminates. The glass fabric used herein was a T-glass woven fabric with 0.025 mm thickness, 24 g m−2 weight and 5 µm fibre diameter (T-1039, Nitto Boseki Ltd) (Fig. 1A and B). Silica beads in the diameter range of 50 nm to 1.5 µm, with a mean particle size of 300 nm, were used (SFP-30MHE, DENKA) (Fig. 1C and D). Silica beads (60 wt%) were incorporated into the epoxy resin dissolved in dimethylformamide (DMF), which was supplied by LG Chem Ltd. The epoxy resin solution, including the silica beads (density about 1.52 g cm−3), was mixed until the viscosity reached 50 cps.
image file: c6ra14969c-f1.tif
Fig. 1 SEM images of glass fibre woven fabric (A), densely-packed glass fibre bed with mean glass fibre diameter of 5 µm (B), and size distribution of silica beads used as secondary filler in this study with mean particle size of 500 nm at different magnifications (C) and (D).

Preparation of silica bead incorporated epoxy/glass fibre prepregs and laminates

Prepregs were prepared using a solvent impregnation process at room temperature and ambient humidity, as schematically illustrated in Fig. S1 in the ESI. The silica beads/epoxy resin solution was mechanically stirred for about 2 h at room temperature. The glass woven fabric was immersed in the silica beads/epoxy resin solution for 120 s at room temperature, and was then squeezed by squeezing rollers. The prepreg was dried at 160 °C in a convection oven for 120 s to remove the remaining solvent. The final resin content was controlled between 15–20 wt%.

The ultrasonicated prepregs were prepared following the above procedure except the impregnation step. Herein, the glass woven fabric was immersed into a mixture solution of silica beads and epoxy resin. The mixture solution contained silica beads (60–70 wt%), epoxy matrices (15–20 wt%), and DMF as a solvent. Ultrasound (400 W/40 kHz) was applied during the solvent impregnation process using a standing wave ultrasonic bath. The ultrasonication time was varied for 10 s and 120 s in this study for comparison.

The prepregs were cut to the size of 130 mm wide and 150 mm long. Then, they were cured under a controlled temperature program where the temperature increased up to 225 °C at 2 K min−1 under a pressure of 5 MPa, and then held for 75 min to make the composite laminates. The density of the fully cured laminates was about 1.89 g cm−3.

Characterization

Scanning electron microscope (SEM) images of silica beads and the glass woven fabric were obtained using a JEOL JSM-7401F. The composite laminate samples obtained with different ultrasonication times (0, 10, and 120 s) were investigated using an optical microscope (Nikon ECLIPSE 80i) and SEM. The composite laminate samples embedded in epoxy resin were polished to investigate the cross section of the composite laminates. The in-plane direction thermal expansion coefficient of the composites was measured with the Seiko Exstar 6000 (TMA6100) thermal mechanical analyser (TMA) under the heating rate of 5°C min−1 up to 300 °C in air. The TMA samples, which are fully cured composite laminates, were prepared at the size of 3 mm wide, 30 mm long, and about 40 µm thick. Dynamic mechanical analysis (DMA) was carried out in tension mode using the Seiko Exstar 6000 (DMA/SS6100) at a frequency of 1 Hz with a 10 µm amplitude under the heating rate of 3 °C min−1 up to 300 °C. The DMA samples, which are fully cured composite laminates, were prepared at the size of 5 mm wide, 40 mm long, and about 40 µm thick. Thermogravimetric analysis (TGA, TA instruments Q50) was conducted in nitrogen atmosphere from ambient temperature to 750 °C with heating rate of 10 °C min−1.

Results and discussion

Isotropic bubble collapse and anisotropic cavitation microjet

As mentioned previously, due to the abrupt collapse of the cavitation bubble (Fig. 2A), a huge amount of energy is concentrated in the bubble and the temperature increased rapidly because the heat has no time to escape from the bubble, which almost complies with an adiabatic process. Theoretically, the temperature increases up to 5000 K and the pressure reaches about 1000 atm. Consequently, this interesting phenomena associated with such concentrated energy generates either a shock wave or a microjet, each corresponding to the isotropic and anisotropic collapse of bubbles, as seen in Fig. 2A and B, respectively.21–23 The shock waves and bubbles may well push away adjacent fibres to make space for the secondary nano-sized fillers to migrate inside.
image file: c6ra14969c-f2.tif
Fig. 2 (A) Isotropic bubble collapse generating isotropic shock waves resulting in radial wave propagation, thus facilitating bead dispersion and fibre spreading. (B) Anisotropic bubble collapse near solid interface boundaries generating a high-speed microjet, thus delivering the beads into the spread glass fibre bed.

In the theory of ultrasonic cavitation, when the solid wall is several times larger than the resonance bubble, e.g. bigger than 200 µm at 20 kHz in water,24,25 an anisotropic microjet is created from a solid wall while the potential energy of the expanded bubble is converted into kinetic energy near the solid wall. In this study, the densely-packed woven glass fabric may very well act as a solid wall. When the ultrasound is applied to the matrix liquid in the presence of the glass fabric, the anisotropic microjet occurs near the tightly packed glass fibres (Fig. 2B), which is very different from the isotropic formation of isolated bubbles (Fig. 2A). When a cavitation bubble is produced near a solid interface, an asymmetric deformation of the cavity occurs to give an asymmetric liquid motion during cavity collapse. This asymmetric cavity deformation results in a liquid microjet, which may very well carry the nano-sized fillers with the jet to penetrate into the fibrous bed. The collapse of an asymmetric cavitation bubble is described by Bernoulli's equation, restating the pressure on the free surface in terms of the velocity potential (ϕ) and the velocity of the fluid (v),

 
image file: c6ra14969c-t1.tif(1)
where Δp is the pressure difference between the ambient liquid pressure and the vapour pressure, and ρL is the density of the fluid.

In this equation, it can be assumed that the normal derivative of velocity potential must vanish at the solid interface, and the initial potential is uniformly zero.26 Then, the speed of the microjet, UJ, at the time it impacts the opposite surface of the bubble may be derived to be:

 
UJ = ξp/ρL)1/2 (2)

Impact on the opposite surface of the bubble may be derived where ξ is a constant. The collapse of the distorted bubble generates a high-speed microjet. It reaches the maximum jet speed of 110–140 ms−1 with theoretical calculations at atmospheric pressure, room temperature, and the density of 1.52 g cm−3, which seems to give sufficient impact power to the solid/liquid interfaces and subsequently expand the interstitial space between the beads and fibers.27

Secondary filler infiltration by ultrasonic bubble implosion and anisotropic microjet. Fig. 3 shows the ultrasonication-assisted migration process, where the secondary silica beads moves into the primary fibre bed during the solvent impregnation process. When the primary fibre bed is simply immersed in the secondary-filler mixture solution, the silica beads can hardly infiltrate into the glass-fibre bed (Fig. 3A). When the ultrasound energy is applied and generates cavitation bubbles in the mixture, the implosion of bubbles in the fibre bed generates a shock wave that radially propagates to push the adjacent packed fibres away (upper part of Fig. 3B). In addition, the high-speed anisotropic microjet is derived by the boundary interfaces, which provides a non-spherical implosion of the cavitation bubble in an anisotropic way into the primary fibrous filler interfaces (lower part of Fig. 3B). This microjet may carry the secondary beads to move inside the interstitial space of the fibre bed; subsequently, the secondary beads migrate along with the sonication induced resin flow. These two isotropic and anisotropic bubble implosions may very well allow the secondary fillers to move into the primary fibrous filler bed (Fig. 3C). Finally, Fig. 3D shows the stabilized feature where the secondary beads are well distributed inside the fibre beds, which should be compared with the segregated feature of the primary and secondary fillers in Fig. 3A.


image file: c6ra14969c-f3.tif
Fig. 3 Schematic of secondary filler migration of beads into the primary fibre bed during the solvent impregnation process. The secondary beads are filtered out and segregated by the fibre bed (A). When ultrasonication is induced, densely-packed fibre beds are expanded by the implosion of the cavitation bubbles in the fibre bed and generates a shock wave. The secondary beads are injected and migrated along with the high-speed anisotropic microjet, which is derived by the boundary interfaces of the fibres (B and C). As a result, the secondary beads are well distributed inside the fibre bed (D). The sizes of the cavitation bubble implosion and the microjet are not realistic. In cavitation theory, the theoretical radius of the resonance bubble is 0.1–110 µm at 20 KHz in water.

Experimental observation of silica beads and glass fibre composite comparing the ultrasonication effects

Fig. 4 shows the cross section of a typical composite laminate prepared without applying ultrasonication. As can be seen, a densely-packed glass fibre woven fabric sheet is shown at the centre (thickness of about 25 µm), and the resin solution/silica bead mixture is impregnated from left and right sides. When there is no ultrasonication, the silica beads are filtered and thus observed on both sides of the glass fabric, appearing as small grey dots in the figure. It is believed that the woven fabric is usually so densely-packed that the silica beads can hardly penetrate into the fabric. Thus, there appears a resin-rich region inside the densely-packed woven fabric, as clearly indicated in Fig. 4. It is evident that the facile migration, or even distribution, of silica beads can hardly be achieved without the assistance of ultrasonication due to the filtering effect of the densely-packed fibre bed.
image file: c6ra14969c-f4.tif
Fig. 4 Optical micrographs of epoxy/glass fibre/bead composite specimen (cross-sectional image) without ultrasonication, illustrating the filtering of silica beads by densely-spaced fibres.

Morphology change of the epoxy/glass fibre/bead composite laminates by ultrasonication

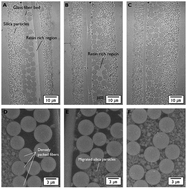
When ultrasonication is applied, the forced infiltration of silica beads into the densely-packed glass fibre bed is clearly seen in Fig. 5. It compares the epoxy/glass fibre/bead composite laminate specimens prepared without sonication (A), with 10 s sonication (B), and with 120 s sonication (C). Fig. 5A (the full image of Fig. 4) illustrates the case where no sonication is applied, clearly showing the segregated silica beads accumulated on both left and right (outsides) of the specimen. It is clear that the silica beads are filtered out by the glass fibre bed. Fig. 5B illustrates the case where the sonication is applied for a relatively short period of time (10 s in this study). It shows that small amounts of silica beads are impregnated into the glass fibre bed. The figure demonstrates that the infiltration of the silica beads into the glass fibre bed due to the shock wave and anisotropic microjet, as mentioned earlier. Fig. 5C illustrates the case that the sonication time is further increased to 120 s, showing that the glass fibre bed is completely filled with the silica beads. It is likely that the sonication distributes the silica beads without changing the loading contents of them in the composite laminates (Fig. S2 in ESI). Fig. S2 shows a similar residual weight, which is the weight of fillers for the three laminate specimens. It should be mentioned that it can hardly be achieved without ultrasonication by simply extending the impregnation time or using typical roll-to-roll pressing in the prepregnation processes. It is believed that the controlled ultrasonication can facilitate the impregnation of secondary fillers into the densely-packed fibre beds in an effective way that cannot be achieved by other conventional processing techniques.
image file: c6ra14969c-f5.tif
Fig. 5 Optical micrographs and SEM images of silica beads incorporated into the epoxy/glass fibre composite laminate specimens (cross-sectional images), illustrating the migration of the silica beads on the glass fibre bed after different ultrasonication times: w/o sonication (A and D), with 10 seconds sonication (B and E), and with 120 seconds sonication (C and F).

CTE of epoxy/glass fibre/bead composite laminates

Fig. 6 compares the thermal strain of our composite laminate specimens in the in-plane principal direction plotted as a function of temperature, comparing three specimens as used for the analysis of Fig. 5, each corresponding to the sonication times at 0, 10, and 120 s, respectively. Fig. 6 shows the same glass transition temperature (Tg) at 175 °C for all three composite laminate specimens. The slope of the specimen dimension represents the CTE. In two regions, below Tg and above Tg, the three laminate samples give different slopes (or CTEs). The CTEs are likely to decrease as the ultrasonication time increases.
image file: c6ra14969c-f6.tif
Fig. 6 Dimensional change of epoxy/glass fibre/bead composite laminates in the in-plane direction comparing three cases: w/o sonication, 10 seconds sonication, and 120 seconds sonication as a function of temperature.

From the linear region of the slopes, between 80–160 °C (below Tg) and 180–260 °C (above Tg), the CTEs of the laminate specimens were obtained and subsequently plotted as a function of temperature in Fig. 7. It is clear that the CTEs increase with temperature in a linear fashion over the whole temperature region. Accordingly, the CTEs may be fitted by the following equation.

 
α = α0 + β(TTref) (3)
where α0 is the coefficient of thermal expansion at a reference temperature, β is the gradient, and Tref is the reference temperature. The reference temperatures are taken as 25 °C for below Tg and 175 °C for above Tg for all the three specimens. The α0 and β values for two regions (below-Tg and above-Tg) are summarized in Table 1. Comparing the specimens with 120 s sonication and w/o sonication, the α0 value below-Tg is 6.1 ppm K−1 which was 38% lower than the α0 value of the specimen w/o sonication (9.8 ppm K−1). The α0 value above-Tg is 15.8 ppm K−1, was also 23% lower value than the α0 value of the specimen w/o sonication (20.6 ppm K−1). The β values of three specimens below-Tg were similar at 0.023–0.025. The β values of the specimens with 10 s sonication and w/o sonication above-Tg decreased to 0.014 and 0.013, respectively while the β values of the specimens with 120 s sonication above-Tg remains stationary.


image file: c6ra14969c-f7.tif
Fig. 7 The CTE of epoxy/glass fibre/bead composite laminates w/o sonication, 10 s sonication, and 120 s sonication, compared with the model equation (α = α0 + β (TTref)).
Table 1 The parameters (α0 and β) of the CTE model equation (α = α0 + β (TTref)) for both below and above the glass transition temperature (Tg)
  Below Tg (Tref = 25 °C) Above Tg (Tref = 175 °C)
α0 (ppm K−1) β α0 (ppm K−1) β
w/o sonication 9.8 0.025 20.6 0.013
10 s sonication 8.3 0.025 18.8 0.014
120 s sonication 6.1 0.023 15.8 0.023


It is clear that the even distribution of silica beads significantly changes the CTE of the composite laminates. In the below-Tg region, the CTE ranges 10.5–13.2 ppm K−1 for the w/o ultrasonication and 6.9–8.5 ppm K−1 for with ultrasonication. The even distribution of silica beads influences the local stress distribution, which subsequently affects the effective properties of the composite, such as thermal expansion stress, fatigue, and tensile strength.6,8,9 Especially at high loading contents of fillers, the effect of the spatial distribution of particles on the effective properties of the composites is increased.28 With our highly loaded silica beads and glass fibre system, the spatial distribution of two different fillers seem to have a strong influence on the CTE of the composite laminates. When the silica beads were uniformly distributed via ultrasonication, as seen in Fig. 5C, the silica beads are likely to redistribute silica bead interfaces, which effectively converts the thermal stresses as hoop stresses around the surface of glass fibres and the silica beads. Although the composite systems shown in Fig. 5 have the same filler content or the same surface area of filler-exposed surfaces, the apparent CTEs differ to a great extent by up to 38%. This surprising result shows the possibility that the thermo-mechanical properties of the composites are substantially influenced by the spatial distribution of fillers.

This work may propose a solution to the secondary filler filtering issues, which are faced quite often in many occasions that fabricate multiple-filler composite systems. Our work clearly demonstrates an efficient way of impregnating secondary fillers in such a densely-packed fibre system without the need of lowering the loading contents of the fillers. Moreover, this investigation can be further extended to the development of different-filler composite systems in different shapes, sizes, packing types, etc.

Dynamic mechanical analysis (DMA) of epoxy/glass fibre/bead composite laminates

The DMA results for all the specimens are plotted in Fig. 8, which shows variation of storage modulus E′, loss modulus E″, and tan[thin space (1/6-em)]δ as a function of temperature and Cole–Cole plot of the storage and loss moduli. The storage modulus E′ and loss modulus E″ (Fig. 8A and B), respectively, represents the ability of the materials to resist elastic and viscous deformation. Both storage and loss modulus are likely to increase as the ultrasonication time increases in the overall range of temperature. Storage modulus of the specimen with 120 s sonication was 9.0 GPa at 40 °C, which was 23% higher than that of the specimen w/o sonication (7.3 GPa). The difference between the two specimens gradually decreased as temperature increased. Loss modulus of the specimen with 120 s sonication was 345 MPa at 40 °C, which was 38% higher than that of the specimen w/o sonication (236 MPa). The difference between two specimens was much higher (46%) at the peak where the temperature was 260 °C. Fig. 8C shows a damping coefficient (or tan[thin space (1/6-em)]δ) of the three specimens, w/o sonication, 10 s sonication, and 120 s sonication, having the same peak (Tg) at 270 °C, reaching 0.045, 0.051, and 0.056, respectively. Fig. 8D presents Cole–Cole plot of storage and loss moduli of the three specimens. They show a parabolic shape in the modulus range of the glass transition. The plots show parallel translation to the diagonal direction as sonication time increased. It is considered that the spatial distribution of two different fillers highly affects both the stiffness and damping behaviour of composite laminates, which shows good agreement with the TMA results.
image file: c6ra14969c-f8.tif
Fig. 8 Thermo-mechanical properties of epoxy/glass fibre/bead composite laminates w/o sonication, 10 s sonication, and 120 s sonication obtained from DMA tests at 1 Hz. (A) Storage modulus E′, (B) loss modulus E″, (C) tan[thin space (1/6-em)]δ, and (D) Cole–Cole plot of E′ and E″.

It is well known that Tg is dependent on the thermal analysis techniques and the glass transition is a relaxation phenomenon that usually takes place in a range of temperatures. In this study, the Tg obtained from DMA was usually measured higher than that of TMA; and the DMA signals responded more sensitively to the reinforcing materials, which usually gave increased Tg.29 In Fig. 8B, the loss modulus of the three specimens shows a broad range of Tg transition, representing the onset point at around 150 °C, which seems to correspond to the Tg of TMA. The mechanical onset points of DMA were seemingly induced from a slight rearrangement of the woven glass fabric, stemming from the matrix softening, which seems to correspond to the volumetric changes detected by TMA.

Conclusions

We investigated the forced infiltration of the secondary fillers into the primary skeletal structure and the CTE of the fabricated composite laminates in highly-loaded multiple-filler composite systems. The secondary filler, silica bead, was infiltrated into the primary skeletal structure, the densely-packed glass fibre bed, by the shock wave and anisotropic cavitation microjet, which occurs in the glass fibre bed and its interfaces during ultrasonication. The even distribution of silica beads, which was achieved by forced infiltration, was verified by morphological analyses. The maximized stress transfer, through even distribution of two differently sized fillers, significantly reduced the CTE and enhanced the stiffness of the composite laminate. It is believed that this investigation could provide an opportunity to effectively reinforce highly loaded multiple-filler composite systems.

Acknowledgements

This work was supported by the National Research Foundation of Korea (NRF), the Ministry of Science, ICT & Future Planning (NRF-2012M1A2A2671788 and NRF-2014M3C1B2048175), and Ministry of Trade, Industry and Energy (MOTIE) (10041173). We also appreciated the project and equipment support from Gyeonggi Province through the GRRC program in Sungkyunkwan University. K. J. K. thanks the partial from the US National Science Foundation (#1545875).

Notes and references

  1. G. Gao, Nanostructures and nanomaterials: synthesis, properties and applications, London: Imperial College Press, London, 2004 Search PubMed.
  2. R. F. Gibson, Principles of composite material mechanics, CRC press, Florida, 2011 Search PubMed.
  3. M. Quaresimin and R. J. Varley, Compos. Sci. Technol., 2008, 68, 718–726 CrossRef CAS.
  4. K. Zhang, L. Wang, F. Wang, G. Wang and Z. Li, J. Appl. Polym. Sci., 2004, 91, 2649–2652 CrossRef CAS.
  5. Y. Yang, Z.-k. Zhu, J. Yin, X.-y. Wang and Z.-e. Qi, Polymer, 1999, 40, 4407–4414 CrossRef CAS.
  6. J. Sarkar, T. Kutty, K. Conlon, D. Wilkinson, J. Embury and D. Lloyd, Mater. Sci. Eng., A, 2001, 316, 52–59 CrossRef.
  7. J. Segurado, C. Gonzalez and J. Llorca, Acta Mater., 2003, 51, 2355–2369 CrossRef CAS.
  8. J. Segurado and J. LLorca, Mech. Mater., 2006, 38, 873–883 CrossRef.
  9. M. Chaturvedi and Y.-L. Shen, Acta Mater., 1998, 46, 4287–4302 CrossRef CAS.
  10. D. Zhang, K. Sugio, K. Sakai, H. Fukushima and O. Yanagisawa, Mater. Trans., 2007, 48, 171–177 CrossRef CAS.
  11. Z. d. M. Boari, W. A. Monteiro and C. A. d. J. Miranda, Mater. Res., 2005, 8, 99–103 CrossRef CAS.
  12. D. Ensminger and F. B. Stulen, Ultrasonics: data, equations and their practical uses, CRC press, Florida, 2008 Search PubMed.
  13. R. N. Weller, J. M. Brady and W. E. Bernier, J. Endod., 1980, 6, 740–743 CrossRef CAS PubMed.
  14. E. Maisonhaute, C. Prado, P. C. White and R. G. Compton, Ultrason. Sonochem., 2002, 9, 297–303 CrossRef CAS PubMed.
  15. B. Bittmann, F. Haupert and A. K. Schlarb, Ultrason. Sonochem., 2009, 16, 622–628 CrossRef CAS PubMed.
  16. C.-k. Lam, K.-t. Lau, H.-y. Cheung and H.-y. Ling, Mater. Lett., 2005, 59, 1369–1372 CrossRef CAS.
  17. M. F. Uddin and C. T. Sun, Compos. Sci. Technol., 2010, 70, 223–230 CrossRef CAS.
  18. C. Braver, M. Tumey, A. Harlow and Q. Han, ASME 2009 International Manufacturing Science and Engineering Conference, West Lafayette, Indiana, USA, October 4–7, 2009, vol. 1 Search PubMed.
  19. K. S. Suslick, Y. Didenko, M. M. Fang, T. Hyeon, K. J. Kolbeck, W. B. McNamara, M. M. Mdleleni and M. Wong, Philos. Trans. R. Soc., A, 1999, 357, 335–353 CrossRef CAS.
  20. W. Lauterborn and C.-D. Ohl, Ultrason. Sonochem., 1997, 4, 65–75 CrossRef CAS PubMed.
  21. K. Suslick and S. Doktycz, Adv. Sonochem., 1990, 1, 197–230 CAS.
  22. K. S. Suslick, Science, 1990, 247, 1439–1445 CAS.
  23. K. S. Suslick, Ultrasound: its chemical, physical, and biological effects, VCH Publishers, Weinheim, 1988 Search PubMed.
  24. A. Brotchie, F. Grieser and M. Ashokkumar, Phys. Rev. Lett., 2009, 102, 084302 CrossRef PubMed.
  25. T. Leighton, The Acoustic Bubble, Academic Press, London, 1994 Search PubMed.
  26. M. S. Plesset and R. B. Chapman, J. Fluid Mech., 1971, 47, 283–290 CrossRef.
  27. J. R. Blake and D. Gibson, Annu. Rev. Fluid Mech., 1987, 19, 99–123 CrossRef.
  28. L. Mishnaevsky Jr, K. Derrien and D. Baptiste, Compos. Sci. Technol., 2004, 64, 1805–1818 CrossRef.
  29. R. J. Seyler, Assignment of the glass transition, ASTM International, Philadelphia, 1994 Search PubMed.

Footnote

Electronic supplementary information (ESI) available. See DOI: 10.1039/c6ra14969c

This journal is © The Royal Society of Chemistry 2016
Click here to see how this site uses Cookies. View our privacy policy here.