Theoretical study and design of cyclometalated platinum complexes bearing innovatively a highly-rigid terdentate ligand with carboranyl as a chelating unit

Yanyan Xu, Yafei Luo, Wenting Zhang, Wenqian Li, Ming Li and Wei Shen*
College of Chemistry and Chemical Engineering, Southwest University, Chongqing 400715, China. E-mail: shenw@swu.edu.cn

Received 6th June 2016 , Accepted 12th August 2016

First published on 12th August 2016


Abstract

Density functional theory (DFT) and time-dependent density functional theory (TD-DFT) were employed to explore the electronic structures and phosphorescence properties of synthesized terdentate Pt(II) complexes bearing highly-rigid 3,6-bis(p-anizolyl)-2-carboranyl-pyridine as a cyclometalated ligand and triphenylphosphine (1) or t-butylisonitrile (2) as ancillary ligand. To understand the marked difference in phosphorescence quantum efficiency between 1 and 2, the relaxation dynamics of excited states were elucidated in detail. Aiming to formulate the radiative relaxation, the zero-field splitting (ZFS) and the radiative decay rate constant (kr) were calculated by SOC-perturbed TDDFT (pSOC-TDDFT). Meanwhile, the temperature-independent non-radiative relaxation was analyzed by calculating the Huang–Rhys factor (S), the SOC interaction between the emitting state and the ground state. While the temperature-dependent non-radiative decay mechanism was studied by depicting the thermal deactivation process via a metal-centered excited 3MC state. Based on the results, 1 and 2 show a few differences in their temperature-independent non-radiative rates. However, the activation barrier for the population of non-emissive 3MC is greatly raised for complex 2. Therefore, the temperature-dependent non-radiative decay behavior of 2 is considerably suppressed, which ultimately leads to a substantially enhanced phosphorescence quantum efficiency for 2. To further tune the emission wavelength towards blue, four new complexes 3–6 were theoretically designed by modifying the terdentate ligand with azole groups based on the parent complex 2. As a result, pyrazole modified complex 4 stands out with enhanced deep-blue phosphorescence located at 434 nm.

1. Introduction

The third-row organometallic complexes have attracted growing interest as phosphorescent emitters applied in flat-panel displays and solid state lighting devices,1–5 owing to their superiority in luminescence originating from both singlet and triplet excitons.6–8 Among all the transition-metal complexes, the Ir/Pt-based counterparts are the most widely utilized dopants for the construction of phosphorescent OLEDs because of their higher luminescence efficiency and better chemical stability.9–11

Nowadays, the major obstacle that impedes the widespread commercialization of high-performance full-color display devices is the lack of efficient and stable blue emitters,12 since the green/red-emitting phosphors have already been well-developed.13,14 As a result, the rational color-tuning of organometallic complexes towards blue region is of significant importance. Based on the prototypical Pt and Ir complexes bearing 2-phenyl-pyridine (ppy) ligand, several strategies have been successfully proposed to broaden the emission energy gap: (1) incorporate electron-withdrawing substituents such as fluorine into the phenyl ring of ppy ligand.15–17 However, the rapid degradation of fluorinated emitters usually leads to substantial decrease in operational lifetime of OLEDs.18 (2) Modify the ancillary ligand. As reported, Park and co-workers successfully achieved the tuning of phosphorescence color over the whole visible spectrum through adopting different novel ancillary ligands on a series of heteroleptic iridium complexes.19 (3) Replace the pyridine ring of ppy ligand with azole groups such as pyrazole, triazole, methylimidazole, or methylimidazole–carbene.20–23

In general, although great progress has been achieved in the development of organometallic complexes during the past decades, it is still a big challenge to engineer phosphors possessing phosphorescent quantum yield up to 100%. An effective solution concerning this problem is to inhibit the non-radiative deactivation via employing highly rigid structural scaffold.24,25 Therefore, designing and synthesizing Pt(II) pincer complexes supported by multidentate ligand seems to be a judicious strategy. However, as reported by Che and co-workers, although the complex [Pt(NCN)Cl] (NCN = 1,3-bis(2-pyridyl)phenyl) exhibits strong luminescence in CH2Cl2 solution at 298 K, the complex [Pt(CNC)(CNPh)] (CNC = 2,6-diphenylpyridyl2−) bearing stronger-field cyclometalated ligand than the former is non-emissive under the same condition. The main reason for this abnormal phenomenon is the occurrence of large structural distortion in the S0 to Tm transition process at [Pt(CNC)(CNPh)].26 In 2014, Yersin and co-workers synthesized two Pt(II) complexes with a terdentate ligand L (LH2 = 3,6-bis(p-anizolyl)-2-carboranyl-pyridine) as cyclometalated ligand and triphenylphosphine (1), and t-butylisonitrile (2) as ancillary ligand, respectively (see Scheme 1).27 Notably, unlike the previous reported non-emissive [Pt(CNC)X] complexes, complex 2 emits in solution with phosphorescence quantum yield as high as 82% at room temperature. The excellent luminescence efficiency exhibited by complex 2 mainly stems from the highly rigid coordination mode in which the bulky carboranyl group plays a significant role. However, complex 1, bearing the same rigid cyclometalating terdentate ligand but different ancillary ligand, emits weakly with the phosphorescence quantum yield only being 1.6% at the same conditions. What accounts for this marked difference induced by alterations in the ancillary ligand? To elucidate the nature underlying this experimental phenomenon and explore the relationship between the structure and property, we made great efforts to unveil the relaxation mechanisms of the emitting triplet excited states in Pt(II) complexes bearing carborane-functionalized terdentate ligand, including the radiative relaxation dynamic and the non-radiative relaxation dynamic. Unfortunately, up to now, there has not been well-rounded and accurate prediction on the non-radiative decay rate.28 In our study, to make a thorough elucidation on the non-radiative decay processes, despite the electron-vibrational coupling, the intersystem crossing process from Tem to S0 and the thermal population of the metal-centered d–d excited state 3MC were also taken into account.


image file: c6ra14653h-s1.tif
Scheme 1 Chemical structures of the investigated complexes 1–6.

Moreover, although complex 2 is an excellent phosphor, its maximum emission wavelength locates in the green region. In our study, to further tune the wavelength towards blue, the methylimidazole–carbene, pyrazole and methylimidazole were employed to modify the 3,6-bis(p-anizolyl)-2-carboranyl-pyridine ligand of complex 2, respectively. The corresponding complexes were denoted as 3–5 (showed in Scheme 1). Additionally, in 2016, Thomas and co-workers synthesized novel cyclometalated C^C* platinum(II) complexes with thiazole-2-ylidene as the main ligand.29 Compared with the traditional cyclometalated C^C* platinum(II) NHC complexes, these ones show enhanced phosphorescence quantum efficiency, an indicator that the replacement of N with S in the C^C* ligand is a judicious and feasible strategy for the improvement of phosphorescence performance. Therefore, based on 3, we designed complex 6 (depicted in Scheme 1) through incorporation of S atom in the cyclometalated ligand. We hope our work would offer useful information for the further understanding and design of robust deep-blue phosphors in OLEDs.

2. Computational theory

After light excitation, efficient and ultrafast intersystem crossings (ISC) from the singlet excited states (Sn) to the triplet manifold are available, owing to the strong spin–orbit couplings (SOC). After that, the triplet manifold quickly decays to the first triplet excited state (T1) through internal conversion. Therefore, only T1 state is considered to shed lighting on the relaxations of the emitting state.

2.1 The radiative relaxation

With the influence of SOC effect, the triplet excited state T1 is split into three sublevels, the energy differences between the lowest-lying sublevel and the intermediate-lying as well as the highest-lying sublevel are defined as zero-point splitting energy (ZFS1,2 and ZFS1,3).30 Generally, each sublevel possesses radiative decay behavior and contributes to the phosphorescence emission.

Under the guidance of the approximation of Born–Oppenheimer and the theory of first-order perturbation, the average radiative decay rate constant κar can be described by the following equation:31,32

 
image file: c6ra14653h-t1.tif(1)
In which, 〈Ta1|HSOC|Sn〉 is on behalf of SOC interaction between T1 and Sn, 〈Sn|M|S0〉 represents the transition dipole moment of singlet excited state Sn, which has the following expression:
 
image file: c6ra14653h-t2.tif(2)

As revealed, M is mainly influenced by the oscillator strength fn and the electronic transition energy of Sn.

As ZFS and κr greatly depend on the SOC effect, a reliable theoretical method addressing excited states with SOC is of great significance to accurately simulate these parameters. Considering the excellent performance of TDDFT in modelling excited states,33 TDDFT with the effect of SOC included is expected to be a promising method. Through expanding in E/(2c2V) and adding corrections in 1/c2 to all orders in the four-component Dirac equation, the zero order regular approximation (ZORA) Hamiltonian34 can be expressed as the following:35

 
HZORA = HSR + HSOC (3)

Clearly, SOC Hamiltonian is incorporated into the ZORA Hamiltonian. In this research, SOC is added into TDDFT as a perturbation based on the scalar relativistic orbitals, the obtained method is denoted as pSOC-TDDFT.36

2.2 The non-radiative relaxation

 
κnr(T1S0) ∝ exp{−β[E(T1) − E(S0)]} (4)
Based on the energy gap law37 (expressed by the above equation), there are two factors that influence the non-radiative behavior of T1, one is the structural deformation of T1 state with respect to S0 state (denoted as β), the other is energy splitting between the corresponding two states. Generally, if β is large, the electron-vibrational coupling between T1 and S0 would be greatly enhanced, thus leading to facilitated non-radiative deactivation. As reported recently, the structural distortion β could be well quantified by Huang–Rhys factor (denoted as S),25 the relationship between them was described in eqn (5) and Fig. 1.
 
image file: c6ra14653h-t3.tif(5)

image file: c6ra14653h-f1.tif
Fig. 1 The relationship between Huang–Rhys factor S and structural deformation ΔQ.

As demonstrated, the Huang–Rhys factor S is proportional to the geometrical deformation ΔQ. If the optimized geometry at T1 remains unchanged by contrast with that of S0, then ΔQ = 0 and S = 0. While if ΔQ ≠ 0, S would increase accompanied by the enlargement in ΔQ.

3. Computational method

For all the investigated complexes, the singlet ground state S0 was optimized by restricted DFT,38 the lowest-lying triplet excited state T1, the 3MC state and the 3TS state were optimized by unrestricted DFT, respectively. Notably, symmetry constraints were not taken into account in the conductions of optimization, no matter for singlet or triplet excited states. To guarantee the accuracy of theoretical research, four representative functionals, including B3LYP,39 PBE0,40 M062X41 and CAM-B3LYP,42 were tested on the optimization of the ground state for complex 1 which has available structural parameters measured in experiment. With guidance offered by the calculated results (see Table S1 in the ESI), PBE0 was considered as the best performer (the simulated equilibrium geometry matched best with the synthesized counterpart) and chosen as the theoretical level for the geometry optimizations. Notably, according to Vela and co-workers,43 the structures of some molecules can be greatly influenced by the environment. However, the influence may not be great for cyclometalated transition metal complexes. Moreover, only the crystal structures are available in experiment, thus we have to use the crystal structures as reference for geometry optimizations. No imaginary frequencies at S0, T1 and 3MC demonstrated that the obtained stationary point was the lowest-energy point at the potential energy surface, while one imaginary frequency at TS indicated the character featured by the intermediate state. To further verify the reliability of TS, intrinsic reaction coordinates simplified as IRC were conducted. The MECP was obtained with the assistance of sobMECP program.44,45

To study the properties of electronic transitions, TD-DFT method was employed to simulate the absorption spectra based on the equilibrium geometry of S0. To achieve an excellent accordance with experiment, TPSSH,46 B3LYP, PBE0 and M062X were adopted. According to Table S2 in which the specific computed results along with the experimental data were summarized, TPSSH stood out. In addition, to explore the luminescence properties, calculations based on TDDFT/M062X were performed at the equilibrium geometry of T1, the best aggregation with experiment in the maximum emission wavelength via utilizing M062X accounts for the adoption of this functional instead of others (M052X,47 B3LYP and PBE0) in this article, more detailed information can be seen in Table S3. It should be noted that the environmental influence was also considered in the TDDFT calculations through employing polarizable continuum model (PCM)48,49 in 2-methyltetrahydrofuran.

To reduce the cost of computation and save time, LANL2DZ50 and 6-31G* (ref. 45) basis sets were adopted for the transition metal atom Pt and light atoms, respectively. All the calculations mentioned above were conducted in Gaussian 09 program package.51

To calculate ZFS and radiative decay rate, pSOC-TDDFT-ZORA Hamiltonian method was adopted based on the optimized geometry of T1 in ADF2014.52,53 PBE0 functional with two all electron Slater-type orbital basis sets was used as the theoretical level, including triple-zeta-polarization (TZP) and double-zeta-polarization (DZP). Notably, TZP and DZP serve for Pt and other light atoms, respectively. In the pSOC-TDDFT calculations, the perturbative expansion was based on twenty singlet and twenty triplet excited states. It should be noted that the ground state S0 was also taken into consideration when discussing perturbative SOC corrections. The conductor like screening model (COSMO)54,55 using the parameters of 2-methyltetrahydrofuran was utilized to simulate the solvent effects.

4. Results and discussions

4.1 The optimized geometries at the ground state S0 and the lowest-lying triplet excited state T1

As discussed in the above part of computational method, PBE0 functional modeled the ground state geometry of complex 1 well. Thus, all the optimizations of geometry were completed at the theoretical level of PBE0. The equilibrium geometries of S0 for complexes 1 and 2 were depicted in Fig. 2 with Pt-related ligands labeled. The main optimized structural parameters of S0 and T1 states for all the investigated complexes were summarized in Table 1.
image file: c6ra14653h-f2.tif
Fig. 2 The optimized geometries of S0 for complexes 1 and 2.
Table 1 The selected bond lengths and bond angles coordinated with the metal atom Pt at the optimized geometries of the singlet ground state and the lowest-lying triplet excited state for all the studied complexes
  1 2 3
S0 T1 S0 T1 S0 T1
Bond length 1 2.09 2.10 2.08 2.08 2.08 2.10
Bond length 2 2.06 2.03 2.04 2.01 2.00 1.95
Bond length 3 2.06 2.04 2.03 2.02 2.04 2.00
Bond length 4 2.29 2.30 1.89 1.90 1.98 1.98
Bond angle 1-Pt-2 82.25 81.93 82.89 82.61 82.08 82.40
Bond angle 2-Pt-3 81.36 82.16 81.97 82.74 78.44 79.16
Bond angle 1-Pt-3 163.51 163.95 164.86 163.35 160.51 161.55

  4 5 6
S0 T1 S0 T1 S0 T1
Bond length 1 2.03 2.04 2.03 2.04 2.08 2.10
Bond length 2 1.98 1.94 1.99 1.97 1.99 1.95
Bond length 3 2.12 2.10 2.11 2.07 2.02 1.99
Bond length 4 1.99 1.99 1.99 1.99 1.99 1.99
Bond angle 1-Pt-2 82.88 82.84 82.29 83.11 82.35 82.74
Bond angle 2-Pt-3 78.20 78.86 78.65 79.64 78.49 79.73
Bond angle 1-Pt-3 161.08 161.70 161.94 162.75 160.84 162.47


As shown, all the investigated complexes possess a square-planar coordination geometry, similar to the majority of Pt(II) complexes reported previously. Based on Table 1, it can be easily found that the bond lengths 1, 2 and 3 at S0 state of complex 2 (2.08, 2.04 and 2.03 Å) are slightly shortened by 0.01, 0.02 and 0.03 Å relative to the corresponding ones at complex 1 (2.09, 2.06 and 2.06 Å), demonstrating that modifications on the ancillary ligand have little influence on the main ligand. However, the bond distance 4 at complex 2 (1.89 Å) is substantially shortened by 0.4 Å in comparison with that of complex 1 (2.29 Å), an indicator that the coordination capacity of t-butylisonitrile with Pt is stronger than that of triphenylphosphine. Undoubtedly, the strong interaction between Pt and t-butylisonitrile at complex 2 is unfavorable to the population of non-radiative 3MC state via enlarging the energy gap between the occupied d orbital and the unoccupied d* orbital. While for complexes 3, 4, 5 and 6, the modifications in the main ligand with azole groups do not cause obvious changes in the geometrical structures. By contrast with the counterpart of the parent complex 2, the bond lengths 2 at 3, 4, 5 and 6 are contracted by 0.04, 0.06, 0.05 and 0.05 Å, respectively, especially for complexes 4 and 5, the bond lengths 1 are also shortened by 0.05 Å. All these data indicate that the interaction between the metal atom and the cyclometalating ligand is facilitated in the designed complexes 3–6, which is favorable to the probability of metal to ligand charge transfer in the electronic transitions.

As the emitting state, the lowest-lying triplet excited state T1 also deserves great attention. The Pt-related bond lengths and bond angles of T1 were summarized in Table 1. A revealed, the variations in bond lengths caused by the electron excitation from S0 to T1 are in the range of 0.01–0.05 Å, while the changes at bond angles are no more than 2°. Therefore, it can be inferred that all the studied complexes here have excellent structural rigidity. The superiority owed by this type of transition metal complexes mainly stems from the steric effect of the carborane unit in the terdentate ligand. Since the structural deformation between S0 and T1 is closely related with the non-radiative behavior of the phosphors, it is of significant importance to gain thorough information on this parameter. Herein, the degree of geometric deformation was quantified for all the investigated complexes, more detailed information can be found in the part of the analysis of non-radiative decay process without dependence on temperature.

Moreover, since the spin density at the excited state reflects the distribution of unpaired electrons, the specific information concerning the electronic transitions can be gotten. Herein, the spin densities at optimized T1 geometries were calculated and depicted in Fig. 3. As shown, all the studied complexes have the similar distributions at T1, with spin density concentrating on the cyclometalating ligand and the metal center. Thus, the nature of the emissive state can be easily assigned as metal to ligand charge transfer (MLCT) and ligand-centered charge transfer (LC). Considering the little involvement of ancillary ligand in the triplet emissive state, the emissive properties are mainly controlled by the cyclometalating ligand. Additionally, it should also be noted that the proportions of spin density located at the metal center for complexes 3 and 6 are obviously larger than that of complex 2, thus marked 3MLCT character at T1 and facilitated SOC interactions between T1 and higher-lying singlet excited states Sn are predicted at complexes 3 and 6. Based on this character, it can be estimated that the radiative decay may be enhanced at complexes 3 and 6.


image file: c6ra14653h-f3.tif
Fig. 3 The spin density distribution computed at the optimized geometries of T1.

4.2 Phosphorescence in 2-methyltetrahydrofuran

To estimate the emission color of the transition metal complexes in theory, the maximum emission wavelengths were calculated based on the equilibrium geometry of the first triplet excited state T1 by employing TD-M062X method. The corresponding results were listed in Table 2 as well as the data measured in experiment. As shown, the simulated emission wavelength for complexes 1 and 2 is 519 nm, 521 nm, respectively, both of which show excellent agreement with experimental values (508 and 511 nm for 1 and 2, respectively). Therefore, TD-M062X is expected to predict the phosphorescence properties of complexes 3–6 reliably.
Table 2 Calculated emission energies of T1 and their transition nature for complexes 1–6 along with the experimental data
  State λ (nm) Character Exp.a (nm)
a Experimental data is obtained from ref. 27.
1 T1 519 3MLCT/3LC 508
2 T1 521 3MLCT/3LC 511
3 T1 441 3MLCT/3LC  
4 T1 434 3MLCT/3LC  
5 T1 512 3MLCT/3LC  
6 T1 496 3MLCT/3LC  


As demonstrated by Table 2, compared with the parent complex 2, complexes 3–6 exhibit blue-shifted behavior in emission band, especially 3 and 4, the emission wavelengths of 441 and 434 nm locate at deep-blue region of the whole visible spectrum, the degree of blue shift is as large as 87 nm. Therefore, the replacement of the pyridinyl group in the highly-rigid terdentate ligand with azole groups is proven to be a judicious strategy to tune emission wavelength towards blue in our study. Meanwhile, since electronic transitions usually contain not only one configuration, it is a complexity to accurately describe the character of the excited states. Here, to get clear phosphorescence properties, the natural transition orbitals (NTOs) were calculated based on the equilibrium geometry of T1. Notably, through expanding the transition density from S0 to T1, the transition can be simply depicted as a single-particle transition, that is to say the electron is transferred from occupied NTOs (hole) to unoccupied NTOs (electron), the specific details are plotted in Fig. 4.


image file: c6ra14653h-f4.tif
Fig. 4 NTO pairs computed at the lowest-lying triplet excited state T1 for all the studied complexes.

As shown, all the investigated complexes virtually show the similar distributions at hole and electron. In detail, hole and electron mainly reside on the metal atom and the cyclometalating ligand with few contributions from the ancillary ligand, indicating that the phosphorescent properties are mainly determined by the coordinated terdendate ligand. In addition, the composition of Pt d orbitals in hole is obviously larger than that of electron. Therefore, a noticeable 3MLCT character presents in the transition from T1 to S0. As a conclusion, the transition nature of the triplet excited state is a mixture of 3MLCT and 3LC (ligand-centered charge transfer).

4.3 The analysis of radiative decay process

TDDFT with SOC included as a perturbation based on the scalar relativistic orbitals were conducted on the optimized geometry of T1 to calculate the parameters of ZFS and the radiative decay rate constant kr. The corresponding results were listed in Table 3 along with the experimental data. As shown, the calculated kr for complexes 1 and 2 is 1.30 × 10⁴ s−1 and 1.52 × 10⁴ s−1, respectively, both of which show excellent accordance with the experimental data (1.77 × 10⁴ s−1 and 1.95 × 10⁴ s−1). Therefore, pSOC-TDDFT is a reliable method to reproduce phosphorescent properties in this research.
Table 3 The calculated values of ZFS and radiative decay rate constant kr for all the studied complexes along with the experimental data
  ΔE(ZFS) [cm−1] kr (calc.) [s−1] kr (exp.)a [s−1]
a The experimental data were obtained from ref. 27.
1 4.84 1.30 × 10⁴ 1.77 × 10⁴
2 5.40 1.52 × 10⁴ 1.95 × 10⁴
3 37.75 6.21 × 10⁴  
4 11.94 3.72 × 10⁴  
5 6.85 1.45 × 10⁴  
6 44.93 4.42 × 10⁴  


With the above-mentioned method applied, the radiative decay rate constant kr for the theoretically-designed complexes 3–6 was calculated. Based on Table 3, compared with complex 2, complexes 3, 4 and 6 show enhanced radiative decay processes, with kr increasing from 1.52 × 10⁴ s−1 to 6.21 × 10⁴ s−1, 3.72 × 10⁴ s−1 and 4.42 × 10⁴ s−1. While for complex 5, the calculated kr is 1.45 × 10⁴ s−1, comparable to the value of 1.52 × 10⁴ s−1 calculated at 2. In addition, the parameters of ZFS were also focused on, since they are reported to be important criterion to measure the suitability of phosphors as emitters in OLEDs. Generally, larger the value of ZFS, higher the proportion of 3MLCT in the transition character of T1, intensive the radiative decay. Here, the sequence of ZFS values is 6 > 3 > 4 > 5 > 2 > 1, not strictly corresponding to the order of kr, which may be rationalized by the approximately same energy shifts of the three sublevels. Therefore, in conclusion, the ZFS cannot absolutely demonstrate the efficiency of radiative decay process.

To explore the reasons for the variations in the radiative decay rate constant, the vital factors determining kr were calculated and listed in Table 4, including the transition dipole moments of singlet excited states Sn (n = 1, 2, 3), energy differences between Sn and T1, the spin–orbit coupling interaction between Sn and T1. Based on Table 4, the 〈T1|HSOC|S2〉 calculated at complexes 3 and 6 is 709.14 and 760.70 cm−1, much larger than that of complex 2 (181.92 cm−1). Moreover, the 〈T1|HSOC|S3〉 at complexes 3 and 6 is 276.39 cm−1 and 292.68 cm−1, respectively, much larger than the corresponding one 102.11 cm−1 at complex 2. All these data demonstrate that S2 and S3 states have contributed much to the happening of the originally spin-forbidden T1 → S0 transition at complexes 3 and 6. Thus, 3 and 6 have increased radiative decay rate constants with respect to the parent complex 2. While for complex 4, the enhanced radiative decay behavior relative to complex 2 may be due to the effective spin–orbit coupling between S2 and T1, with the value of 〈T1|HSOC|S2〉 being as high as 540.34 cm−1, indicating that phosphorescence at 4 has borrowed considerable intensity from the singlet excited state S2. As a conclusion, the designed complexes 3–6 exhibiting enhanced or at least comparable blue-shifted emission are superior to the parent complex 2.

Table 4 Transition dipole moments μ(Sn) (Debye) for S0–Sn transitions, singlet–triplet splitting energies ΔE(Sn − T1) (eV) and the SOC matrix elements 〈T1|HSOC|Sn〉 (cm−1) calculated at T1 optimized geometries of complexes 1–6
1 2 3
Sn μ (Sn) ΔE (Sn − T1) 〈T1|HSOC|Sn Sn μ (Sn) ΔE (Sn − T1) 〈T1|HSOC|Sn Sn μ (Sn) ΔE (Sn − T1) 〈T1|HSOC|Sn
S1 3.55 0.72 24.65 S1 3.45 0.78 30.72 S1 0.73 0.73 22.25
S2 0.56 1.35 46.64 S2 1.63 1.42 181.92 S2 1.03 1.44 709.14
S3 1.90 1.48 86.14 S3 1.37 1.45 102.11 S3 2.54 1.60 276.39
S4 0.61 1.53 423.94 S4 0.67 1.47 367.35 S4 1.75 1.81 125.47
S5 3.88 1.60 78.15 S5 3.51 1.58 67.87 S5 0.31 2.04 157.63
S6 0.82 1.64 52.35 S6 0.61 1.70 78.14 S6 4.19 2.15 45.37

4 5 6
Sn μ (Sn) ΔE (Sn − T1) 〈T1|HSOC|Sn Sn μ (Sn) ΔE (Sn − T1) 〈T1|HSOC|Sn Sn μ (Sn) ΔE (Sn − T1) 〈T1|HSOC|Sn
S1 2.60 0.87 51.62 S1 2.92 0.97 3.09 S1 0.28 0.69 29.82
S2 0.78 1.45 540.34 S2 0.69 1.63 493.45 S2 0.88 1.27 760.70
S3 0.67 1.63 15.95 S3 1.48 1.81 146.18 S3 2.46 1.54 292.68
S4 2.59 1.68 296.22 S4 2.40 2.09 198.97 S4 0.15 1.79 152.91
S5 4.26 1.93 16.04 S5 4.20 2.17 6.85 S5 2.39 1.86 133.37
S6 0.13 2.33 337.44 S6 0.13 2.52 135.20 S6 3.97 2.25 12.19


4.4 The analysis of non-radiative decay process without dependence on temperature

As discussed in the above part of computational theory, accompanied by the intensification of structural distortion at T1 and the narrowing of the energy difference between T1 and S0, the non-radiative decay process becomes facilitated. Based on the equilibrium geometries at S0 and T1, all the investigated complexes well remain the original structures during the electronic transition from S0 to T1, thus the geometrical deformations are considered small. To further quantitatively reflect the degree of distortion, the Huang–Rhys factors were calculated according to eqn (5), detailed information about the calculation of Huang–Rhys factors was listed in Tables S11–S16. Additionally, effective SOC interaction between T1 and the S0 can also promote the radiation-less relaxation of the excited state via the pathway of intersystem crossing (ISC). Therefore, 〈T1|HSOC|S0〉 was also calculated. All the corresponding results are summarized in Table 5 along with the energy slitting between S0 and T1.

On the basis of Table 5, the maximum Huang–Rhys factor (Smax) calculated on complexes 1–6 is 0.55, 0.57, 0.89, 0.99, 0.23 and 0.31, respectively. As reported, if the value of Smax is not exceeding 1, the structural deformation is believed to be extremely small, even can be neglected. In terms of this, the structural deformation can be negligible in the analysis of knr. In addition, since the data of ΔE(T1 − S0) for complexes 1–6 are close to each other, in the range of 2.5 to 3.1 eV, the factor of ΔE(T1 − S0) is also not considered in the estimation of knr. While the 〈T1|HSOC|S0〉 deserves great attention since the value varies markedly from 43.05 cm−1 to 153.04 cm−1. For complexes 1 and 2, the calculated 〈T1|HSOC|S0〉 is 47.23 and 43.05 cm−1, respectively, very close to each other. Consequently, complexes 1 and 2 should have approximately similar non-radiative decay rate constant. However, the results obtained in experiment markedly go against the theoretical expectations, the knr measured at room temperature (298 K) for complex 1 (1.08 × 10⁶ s−1) is significantly larger than that for complex 2 (4.20 × 10³ s−1). Interestingly, it should be noted that when the measured temperature in experiment is lowered to 77 K, the knr at complex 1 dramatically decreases to nearly the same value with complex 2, which is consistent with our theoretical expectations and proves the reliability of our calculations. As a conclusion, complexes 1 and 2 possess virtually the same temperature-independent non-radiative decay rate constant. While the markedly increase in knr at complex 1 with temperature rising demonstrates that there may be a higher-lying non-emissive state accounting for the radiation-less behavior of transition metal complexes. To elucidate the nature of this phenomenon, we made deep explorations on the temperature-dependence of knr in the following part. Moreover, with respect to the designed complexes 4 and 5, the calculated 〈T1|HSOC|S0〉 is comparable to that of the parent complex 2, with the value being 40.60 and 53.25 cm−1, respectively. Therefore, it can be inferred that 4 and 5 possess nearly the same temperature-independent non-radiative decay rate constant with that of 2. While for complexes 3 and 6, since the 〈T1|HSOC|S0〉 is 99.73 and 153.04 cm−1, much larger than that of 2 (43.05 cm−1), the temperature-independent non-radiative deactivation for 3 and 6 is supposed to be enhanced.

Table 5 The 〈T1|HSOC|S0〉 (cm−1), ΔE(T1 − S0) (eV), maximum Huang–Rhys factor (Smax) as well as the non-radiative decay rate constants (s−1) measured in experiment for all the investigated complexes
  〈T1|HSOC|S0 ΔE(T1 − S0) Smax knra
a The available experimental values are obtained from ref. 27.
1 47.23 2.61 0.55 1.08 × 10⁶
2 43.05 2.58 0.57 4.20 × 10³
3 99.73 3.00 0.89  
4 40.60 3.05 0.99  
5 53.25 2.78 0.23  
6 153.04 2.71 0.31  


4.5 The analysis of non-radiative decay process dependent on temperature

As reported, with enough energy provided, the lowest triplet emitting state 3ES can be rapidly converted to the transient metal-centered d–d excited state 3MC via surpassing a barrier (the transition state TS connecting 3ES and 3MC). Once 3MC is thermally populated, there are two main pathways for the decay of this triplet manifold, either returning back to the 3ES or relaxing to the ground state 1GS. The accessibility of the latter route greatly depends on the energy level of the minimum 1GS/3MC energy crossing point MECP. The whole kinetic scenario can be depicted as following:
image file: c6ra14653h-t4.tif

The barrier of the rate-limiting process (Elim) is an important parameter to evaluate the accessibility of the thermal non-radiative relaxation. Herein, to estimate the value of Elim, the 3MC minimum, the TS and the 1GS/3MC MECP along the photo-deactivation coordinate were all optimized in the following.

The geometries at 3MC were optimized upon an initial state which adopts a greatly distorted structure with respect to the ground state. The comparisons between calculated equilibrium geometries at 3MC and S0 for complexes 1–6 were depicted in Fig. S4–S9. As clearly revealed, for all the investigated complexes, the 3MC state distorts greatly from the ground state S0. Among them, complexes 1, 2, 4, 5 and 6 possess similar geometric distortion, the original co-planar coordination of terdendate ligand at S0 state is broken at 3MC state. While for complex 3, the ancillary ligands at 3MC were markedly distorted to be perpendicular with the plane of the terdendate ligand.

The spin density distributions were calculated based on the optimized geometries of 3MC for complexes 1–6, the results were depicted in Fig. 5. As shown, the spin densities are mainly concentrated on the metal atom center, which further justify the accuracy and reliability of our calculations for 3MC.


image file: c6ra14653h-f5.tif
Fig. 5 Spin density distributions computed at 3MC state for all the investigated complexes.

The transition state TS was optimized by UDFT/PBE0. However, the corresponding transition states for complexes 3 and 6 were not found in our study. The Pt-related bond stretch feature of the imaginary mode (−162.08, −185.32, −488.49, and −781.77 cm−1 for 1, 2, 4 and 5, respectively) guarantee that the TS belongs to the T13MC conversion. To further guarantee the reliability of TS, the intrinsic reaction coordinates (IRC) were calculated and depicted in Fig. S10–S13.

The MECP was optimized by DFT/PBE0, the same structures and energies of 1GS and 3MC at the crossing point depicted in Fig. S14–S17 indicate that our calculations for MECP are accurate.

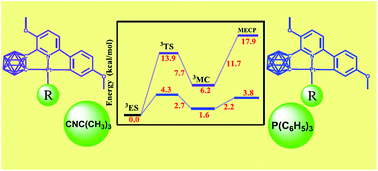
Based on the above calculations, the relative energy profiles for complexes 1, 2, 4 and 5 along the thermal deactivation coordinate with the emitting state 3ES as reference were depicted in Fig. 6. As revealed, for 1, 2, 4 and 5, since E1 > E3, the population of 3MC via TS is the rate-limiting step. However, except complex 1, the barriers E3 are all larger than E2 at complexes 2, 4 and 5, an indicator that the populated 3MC has preferred to return back to the emitting state than relax to the ground state and a pre-equilibrated 3ES–3MC situation is possible. To quantitatively reflect the efficiency of this thermal deactivation, the barrier of the rate-determining step Elim was calculated. The results and the detailed information were summarized in Table 6.


image file: c6ra14653h-f6.tif
Fig. 6 Relative energetic profiles of the thermal deactivation process for complexes 1, 2, 4 and 5 with the emitting state as the reference.
Table 6 The activation barriers (kcal mol−1) for the non-radiative thermal deactivation channels for complexes 1, 2, 4 and 5
  E1a E2b E3c Elimd
a E1 represents the energy gap between 3TS and 3ES.b E2 represents the energy gap between 3TS and 3MC.c E3 represents the energy gap between 3MC and MECP.d Elim represents the barrier of the rate-determining step. For complexes 2, 4 and 5, since the MECP barrier is larger than the TS barrier, Elim is calculated as Elim = E1 + E3E2.
1 4.3 2.7 2.2 4.3
2 13.9 7.7 11.7 17.9
4 12.7 7.2 11.3 16.8
5 16.5 4.4 10.8 22.9


According to Table 6, the value of Elim at complex 2 (17.9 kcal mol−1) is markedly larger than that of complex 1 (4.3 kcal mol−1), indicating the thermal quenching of phosphorescence can be substantially suppressed at complex 2. Therefore, the nature for the noticeable difference in phosphorescence quantum efficiency between 1 and 2 at room temperature, which cannot be solved by experiment, is successfully rationalized in our study. While for the designed complex 4, since the Elim (16.8 kcal mol−1) is comparable to that of the parent complex 2 (17.9 kcal mol−1), the temperature-dependent non-radiative decay rate of 4 is nearly the same with that of 2. For complex 5, the Elim is 22.9 kcal mol−1, 5 kcal mol−1 larger than that of 2, thus it may have the decreased temperature-dependent non-radiative decay rate. With regarding to complex 3, since the 3ES–3MC gap (2.2 kcal mol−1) is smaller than that of complex 2 (6.2 kcal mol−1), it may be inferred that 3 has increased temperature-dependent knr. While for complex 6, with the 3ES–3MC gap (8.3 kcal mol−1) being larger than the corresponding one of complex 2, it may have decreased temperature-dependent knr.

By combination with the above-discussed radiative decay and non-radiative decay rate constants, the phosphorescence quantum efficiency can be theoretically estimated for the newly designed complexes 3 to 6. By contrast with the parent complex 2, complex 4 possessing higher kr and nearly equal knr is supposed to have enhanced luminescence efficiency. While complex 5 exhibiting the similar kr and smaller knr relative to 2 is inferred to have higher phosphorescence quantum yield. With regarding to 3 and 6, since the kr and knr are both increased, it is hard to tell the variation trend of luminescence efficiency.

5. Conclusion

In this research, the DFT/TDDFT theory successfully rationalized the experimental phenomena and estimated the electronic structures and phosphorescent properties of the designed complexes. For this series of terdentate Pt(II) complexes with carborane itself as a chelating unit, the characters of the emissive states are predominated by cyclometalating ligand-based 3LC/3MLCT. Therefore, the replacement of the triphenylphosphine with t-butylisonitrile as ancillary ligand at complex 2 causes little influence on the emission color. By contrast, when azole groups are used to modify the cyclometalating ligand, the emission band shows blue-shifted behavior for all the designed complexes 3–6. Especially 3 and 4, the emission peak of whom is tuned towards blue from 521 nm to 441 and 434 nm, respectively. In addition, based on the analyses of relaxation dynamics of the emitting states, we find that it is the far smaller Elim in the thermal non-radiative deactivation process that accounts for the sharp increase in the non-radiative decay rate constant knr at room temperature for complex 1. Through comparison, it can be concluded that the replacement of triphenylphosphine with t-butylisonitrile as ancillary ligand significantly promotes 3MC, leading to the 3ES–3MC energy gap substantially widened. Therefore, modification in the ancillary ligand is a good strategy to improve phosphorescence quantum efficiency. Moreover, among the designed complexes 3–6, complex 4 with pyrazole group modified attracts our attention. Despite the phosphorescence locating in deep-blue region, it possesses higher kr and nearly equal knr with respect to the parent complex 2. As a result, complex 4 is supposed to be a promising deep-blue phosphor applied in OLEDs.

References

  1. L. Xiao, Z. Chen, B. Qu, J. Luo, S. Kong, Q. Gong and J. Kido, Adv. Mater., 2011, 23, 926–952 CrossRef CAS PubMed.
  2. S. Lamansky, P. Djurovich, D. Murphy, F. Abdel-Razzaq, R. Kwong, I. Tsyba, M. Bortz, B. Mui, R. Bau and M. E. Thompson, Inorg. Chem., 2001, 40, 1704–1711 CrossRef CAS PubMed.
  3. A. Solomatina, D. Krupenya, V. Gurzhiy, I. Zlatkin, A. Pushkarev, M. Bochkarev, N. Besley, E. Bichoutskaia and S. Tunik, Dalton Trans., 2015, 44, 7152–7162 RSC.
  4. Ł. Skórka, M. Filapek, L. Zur, J. G. Małecki, W. Pisarski, M. Olejnik, W. Danikiewicz and S. Krompiec, J. Phys. Chem. C, 2016, 120, 7284–7294 Search PubMed.
  5. A. F. Rausch, H. H. Homeier and H. Yersin, in Photophysics of Organometallics, Springer, 2010, pp. 193–235 Search PubMed.
  6. X. C. Hang, T. Fleetham, E. Turner, J. Brooks and J. Li, Angew. Chem., Int. Ed., 2013, 52, 6753–6756 CrossRef CAS PubMed.
  7. L. Wang, Y. Wu, G.-G. Shan, Y. Geng, J.-Z. Zhang, D.-M. Wang, G.-C. Yang and Z.-M. Su, J. Mater. Chem. C, 2014, 2, 2859–2868 RSC.
  8. Y. Li, L. Y. Zou, A. M. Ren, M. S. Ma and J. X. Fan, Chem.–Eur. J., 2014, 20, 4671–4680 CrossRef CAS PubMed.
  9. S.-J. Yun, H.-J. Seo, M. Song, S.-H. Jin and Y. I. Kim, Bull. Korean Chem. Soc., 2012, 33, 3645–3650 CrossRef CAS.
  10. D. Xia, B. Wang, B. Chen, S. Wang, B. Zhang, J. Ding, L. Wang, X. Jing and F. Wang, Angew. Chem., Int. Ed., 2014, 53, 1048–1052 CrossRef CAS PubMed.
  11. H.-Y. Li, L. Zhou, M.-Y. Teng, Q.-L. Xu, C. Lin, Y.-X. Zheng, J.-L. Zuo, H.-J. Zhang and X.-Z. You, J. Mater. Chem. C, 2013, 1, 560–565 RSC.
  12. K. S. Yook and J. Y. Lee, Adv. Mater., 2012, 24, 3169–3190 CrossRef CAS PubMed.
  13. J. Kavitha, S. Y. Chang, Y. Chi, J. K. Yu, Y. H. Hu, P. T. Chou, S. M. Peng, G. H. Lee, Y. T. Tao and C. H. Chien, Adv. Funct. Mater., 2005, 15, 223–229 CrossRef CAS.
  14. F. Hua, S. Kinayyigit, J. R. Cable and F. N. Castellano, Inorg. Chem., 2005, 44, 471–473 CrossRef CAS PubMed.
  15. R. Holmes, B. D'Andrade, S. Forrest, X. Ren, J. Li and M. Thompson, Appl. Phys. Lett., 2003, 83, 3818–3820 CrossRef CAS.
  16. X. Yang, Z. Wang, S. Madakuni, J. Li and G. E. Jabbour, Adv. Mater., 2008, 20, 2405–2409 CrossRef CAS.
  17. X. Yang, F.-I. Wu, H. Haverinen, J. Li, C.-H. Cheng and G. E. Jabbour, Appl. Phys. Lett., 2011, 98(3), 033302 CrossRef.
  18. R. Seifert, I. R. de Moraes, S. Scholz, M. C. Gather, B. Lüssem and K. Leo, Org. Electron., 2013, 14, 115–123 CrossRef CAS.
  19. Y. You and S. Y. Park, J. Am. Chem. Soc., 2005, 127, 12438–12439 CrossRef CAS PubMed.
  20. T. Fleetham, Z. Wang and J. Li, Org. Electron., 2012, 13, 1430–1435 CrossRef CAS.
  21. V. Adamovich, J. Brooks, A. Tamayo, A. M. Alexander, P. I. Djurovich, B. W. D'Andrade, C. Adachi, S. R. Forrest and M. E. Thompson, New J. Chem., 2002, 26, 1171–1178 RSC.
  22. K. Li, G. Cheng, C. Ma, X. Guan, W.-M. Kwok, Y. Chen, W. Lu and C.-M. Che, Chem. Sci., 2013, 4, 2630–2644 RSC.
  23. R. Holmes, S. Forrest, T. Sajoto, A. Tamayo, P. Djurovich, M. Thompson, J. Brooks, Y.-J. Tung, B. D'Andrade and M. Weaver, Appl. Phys. Lett., 2005, 87, 3507 CrossRef.
  24. A. F. Rausch, L. Murphy, J. G. Williams and H. Yersin, Inorg. Chem., 2011, 51, 312–319 CrossRef PubMed.
  25. Y. Luo, Y. Xu, W. Zhang, W. Li, M. Li, R. He and W. Shen, J. Phys. Chem. C, 2016, 120, 3462–3471 CAS.
  26. G. S. M. Tong and C. M. Che, Chem.–Eur. J., 2009, 15, 7225–7237 CrossRef CAS PubMed.
  27. A. M. Prokhorov, T. Hofbeck, R. Czerwieniec, A. F. Suleymanova, D. N. Kozhevnikov and H. Yersin, J. Am. Chem. Soc., 2014, 136, 9637–9642 CrossRef CAS PubMed.
  28. D. Escudero, Chem. Sci., 2016, 7(2), 1262–1267 RSC.
  29. H. Leopold, A. Tronnier, G. Wagenblast, I. Münster and T. Strassner, Organometallics, 2016, 35, 959–971 CrossRef CAS.
  30. S.-W. Lai and C.-M. Che, in Transition Metal and Rare Earth Compounds, Springer, 2004, pp. 27–63 Search PubMed.
  31. S. Obara, M. Itabashi, F. Okuda, S. Tamaki, Y. Tanabe, Y. Ishii, K. Nozaki and M.-A. Haga, Inorg. Chem., 2006, 45, 8907–8921 CrossRef CAS PubMed.
  32. Q. Cao, J. Wang, Z. S. Tian, Z. F. Xie and F. Q. Bai, J. Comput. Chem., 2012, 33, 1038–1046 CrossRef CAS PubMed.
  33. P. J. Hay, J. Phys. Chem. A, 2002, 106, 1634–1641 CrossRef CAS.
  34. E. Van Lenthe, J. Snijders and E. Baerends, J. Chem. Phys., 1996, 105, 6505–6516 CrossRef CAS.
  35. K. Mori, T. Goumans, E. van Lenthe and F. Wang, Phys. Chem. Chem. Phys., 2014, 16, 14523–14530 RSC.
  36. F. Wang and T. Ziegler, J. Chem. Phys., 2005, 123, 154102 CrossRef PubMed.
  37. T.-T. Feng, F.-Q. Bai, L.-M. Xie, Y. Tang and H.-X. Zhang, RSC Adv., 2016, 6, 11648–11656 RSC.
  38. E. Runge and E. K. Gross, Phys. Rev. Lett., 1984, 52, 997 CrossRef CAS.
  39. S. L. Mayo, B. D. Olafson and W. A. Goddard, J. Phys. Chem., 1990, 94, 8897–8909 CrossRef CAS.
  40. C. Adamo and V. Barone, J. Chem. Phys., 1999, 110, 6158–6170 CrossRef CAS.
  41. Y. Zhao and D. G. Truhlar, Theor. Chem. Acc., 2008, 120, 215–241 CrossRef CAS.
  42. T. Yanai, D. P. Tew and N. C. Handy, Chem. Phys. Lett., 2004, 393, 51–57 CrossRef CAS.
  43. G. Merino, V. I. Bakhmutov and A. Vela, J. Phys. Chem. A, 2002, 106, 8491–8494 CrossRef CAS.
  44. J. N. Harvey, M. Aschi, H. Schwarz and W. Koch, Theor. Chem. Acc., 1998, 99, 95–99 CrossRef CAS.
  45. J. N. Harvey and M. Aschi, Phys. Chem. Chem. Phys., 1999, 1, 5555–5563 RSC.
  46. J. Tao, J. P. Perdew, V. N. Staroverov and G. E. Scuseria, Phys. Rev. Lett., 2003, 91, 146401 CrossRef PubMed.
  47. E. G. Hohenstein, S. T. Chill and C. D. Sherrill, J. Chem. Theory Comput., 2008, 4, 1996–2000 CrossRef CAS PubMed.
  48. V. Barone, M. Cossi and J. Tomasi, J. Chem. Phys., 1997, 107, 3210–3221 CrossRef CAS.
  49. M. Cossi, G. Scalmani, N. Rega and V. Barone, J. Chem. Phys., 2002, 117, 43–54 CrossRef CAS.
  50. P. J. Hay and W. R. Wadt, J. Chem. Phys., 1985, 82, 270–283 CrossRef CAS.
  51. M. J. Frisch, G. W. Trucks, H. B. Schlegel, M. A. Robb, J. R. Cheeseman, G. Scalmani, V. Barone, B. Mennucci, G. A. Petersson, et al., Gaussian 09, Inc., Wallingford CT, 2009.
  52. C. F. Guerra, J. Snijders, G. Te Velde and E. Baerends, Theor. Chem. Acc., 1998, 99, 391–403 CAS.
  53. G. T. te Velde, F. M. Bickelhaupt, E. J. Baerends, C. Fonseca Guerra, S. J. van Gisbergen, J. G. Snijders and T. Ziegler, J. Comput. Chem., 2001, 22, 931–967 CrossRef CAS.
  54. A. Klamt, J. Phys. Chem., 1995, 99, 2224–2235 CrossRef CAS.
  55. A. Klamt and V. Jonas, J. Chem. Phys., 1996, 105, 9972–9981 CrossRef CAS.

Footnote

Electronic supplementary information (ESI) available. See DOI: 10.1039/c6ra14653h

This journal is © The Royal Society of Chemistry 2016