Exploring the anti-breast cancer potential of flavonoid analogs

Vanrajsinh Thakora, Mayur Poddara, Sumit Deyb, S. N. Manjulab, SubbaRao V. Madhunapantulac, Rahul Pawarad, Harun M. Patel*d and Malleshappa N. Noolvi*a
aDepartment of Pharmaceutical Chemistry, Shree Dhanvantary Pharmacy College, Kim (Surat)-394110, Gujarat, India. E-mail: mnoolvi@yahoo.co.uk
bDepartment of Pharmacology, JSS College of Pharmacy, Mysore-570015, Karnataka, India
cDepartment of Biochemistry, JSS Medical College, Mysore-570015, Karnataka, India
dDepartment of Pharmaceutical Chemistry, R. C. Patel Institute of Pharmaceutical Education and Research, Shirpur, District Dhule-425 405, Maharashtra, India

Received 3rd June 2016 , Accepted 3rd August 2016

First published on 9th August 2016


Abstract

In the course of our search for new antitumor agents for breast cancer, novel flavone derivatives were synthesized, characterized and examined for their antitumor activities against breast cancer cell lines. In initial screening, analogs 7a [3-(5-amino-1,3,4-thiadiazol-2-yl)methoxy-2-phenyl-4H-chromen-4-one] and 7b [3-(5-amino-1,3,4-thiadiazol-2-yl)methoxy-2-(4-methoxyphenyl)-4H-chromen-4-one] were found to be effective against the estrogen receptor negative cell line (MDA-MB 453), which was followed by their evaluation in five dose assays. In addition, mechanistic studies of 7a and 7b were performed by cytometric analysis and electrophoretic studies and it was observed that apoptosis is a mechanism of cell death, confirmed morphologically by acridine orange/ethidium bromide double staining and TUNEL analysis. Further in vivo evaluation of the anti-tumor activity of compound 7a and 7b by Ehrlich Ascites Carcinoma (EAC) model and related studies confirms the anti-breast cancer potential of flavonoid analogs.

1. Introduction

Breast cancer is the most commonly diagnosed malignancy among women with more than one million new cases diagnosed per year throughout the world.1,2 Despite advances in the early detection of breast cancer and the advent of novel targeted therapies, breast cancer still remains a significant public health problem due to the involvement of multiple aberrant and redundant signaling pathways in the tumorigenesis and the development of resistance to the existing therapeutic agents. The currently available breast cancer therapies achieve meaningful clinical results in only 30–40% of the patients.3 The efficacy of current chemotherapeutics is low and undesirable side effects are still unacceptably high.4 Hence, the development of novel, efficient, and less toxic anti-breast cancer agents remains an important and challenging goal of medicinal chemists worldwide.

The female hormone estrogen stimulates breast cell division leading to the increase in risk of permanent damage to DNA.5 Compounds that can regulate the apoptosis of cancer cells are of a high medical significance.6 Natural products (NPs) have played a valuable role in the drug discovery and development.7–9 Newman and Cragg10 reported that in the case of cancer around 79% of FDA-approved drugs during a period of 1981–2010 are either natural products or their based/mimicked-compounds. NPs are chosen through evolutionary process via lead optimization to interact with various enzymes/proteins and thus represent biologically relevant regions of the vast chemical space.11–13 Flavopiridol, a semisynthetic flavones analog, acts as CDK9 inhibitor, is FDA-approved orphan drug for acute myeloid leukaemia. It has been reported that myricetin, (flavonoid compound) could decrease pancreatic cancer growth via induction of cell apoptosis.14 LY294002 (flavonoid analogue) entered clinical trials as a potential antineoplastic agent.15 Effects of phytoestrogens in cancer prevention have been reported for decades.16–18 Since then many molecular mechanisms underlying these effects have been identified. Targets of phytoestrogens comprise steroid receptors, steroid metabolising enzymes, elements of signal transduction and apoptosis pathways, and even the DNA processing machinery.18 Phytoestrogens include chalcones (A), flavones (B) and isoflavones (C) which are non-steroidal compounds possessing anti-estrogenic activity (Fig. 1).19


image file: c6ra14428d-f1.tif
Fig. 1 (A) Anticancer flavonoid leads. (B) Structural similarities between chalcone (A), flavone (B) and estradiol (C).

In light of these findings and in continuation of our research for novel anti-cancer agents20–23 in the present study, new series of flavone derivatives has been synthesized and screened in vitro for cytotoxicity by sulphorhodamine B assay. Five dose assay in estrogen receptor negative cell line (MDA-MB 453) and determination of IC50 by SRB assay was also performed. In addition, mechanistic study was done with cytometric analysis and electrophoretic determination of apoptosis. Further in vivo activity evaluation of anti-tumor activity of selected synthetic compounds by Ehrlich Ascites Carcinoma (EAC) model and related studies was performed.

2. Rationale and design

Estrogens have long been recognized to play a key role in the development, growth, and function of female sex organs, and mammary gland.24,25 Estrogens have also an important role in the skeletal, cardiovascular, and central nervous systems.26–28 Since estrogens are known to play a predominant role in breast cancer development and growth,29,30 a logical approach for the treatment of estrogen-sensitive breast cancer is the use of anti-estrogens, which block the interaction of estrogens with their specific receptors.

Tamoxifen, the compound in general use for treatment of breast cancer, possesses mixed agonist–antagonist activities, thus limiting its efficacy as a blocker of estrogen action since it exerts estrogenic activity at various organs in different species.31–34 The most serious adverse events attributable to tamoxifen are the increased risk of uterine cancer and thromboembolic phenomena. Furthermore, up to one half of ER-positive breast cancers and the majority of ER-negative cancers are not prevented with tamoxifen.35 The use of a pure selective estrogen receptor modulator (SERM) as preventive and therapeutic agent should also have positive effects on the skeletal and cardiovascular systems while decreasing the risk as well as treating breast and uterine cancer.36

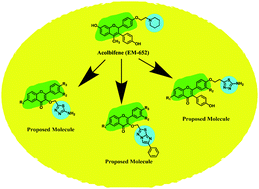
Acolbifene (EM-652·HCl) is a fourth generation SERM of the benzopyran class which has been found to have no estrogen agonist effects in either the breast or endometrium.37–40 Acolbifene and its prodrug (EM-800) have been associated with reduction of growth of tumor xenografts41 as well as the incidence of DMBA-induced rat mammary cancer.42 The lack of estrogen agonist activity in the uterus of EM-800 as well as reported activity in tamoxifen-resistant metastatic disease40 made it an attractive agent for assessment for treatment and prevention. Preclinical and clinical data indicate that acolbifene (EM-652) possesses characteristics superior to tamoxifen and raloxifene for breast and uterine cancer prevention and treatment as well as for hormone replacement therapy at menopause.43–45 Encouraged with the above findings we have concentrated our efforts to synthesis the further derivatives of acolbifene (EM-652), where we tried to modified 4-hydroxyphenyl (C-3) of acolbifene with different 1,3,4-thiadiazoles and imidazo[2,1-b][1,3,4]thiadiazoles with hope to get better analogue of this category (Fig. 2).


image file: c6ra14428d-f2.tif
Fig. 2 Structural comparison between acolbifene and proposed molecule.

3. Chemistry

General scheme to synthesize proposed flavone derivatives is described in Scheme 1. The most common synthetic routes to the chromone structure occur via a chalcone intermediate or via the Baker–Venkataraman rearrangement. The chalcone pathway implicates the base-catalyzed aldol condensation of 2-hydroxy acetophenones with aromatic or conjugated aldehydes. The condensation of substituted o-hydroxy acetophenone 1 and 2 with substituted benzaldehyde 3 was carried out by vigorous stirring in sodium hydroxide solution (1 g/5 ml) and 95% ethanol to give chalcone 4(a–g). The resulting chalcone 4(a–g) is cyclized to the corresponding 3-hydroxyflavone 5(a–g), using alkaline hydrogen peroxide solution, via the Algar–Flynn–Oyamada reaction. Further treatment of 5(a–g) with chloroacetic acid in sodium hydroxide solution gives chromone carboxylic acid 6(a–g). Later chromone 6(a–g) is converted in to the corresponding thiadiazoles 7(a–g) using POCl3 and thiosemicarbazide. Substituted phenacyl bromides eventually react with thiadiazoles 8(a–g) to yield imidazo-thiadiazoles 7(a–n).
image file: c6ra14428d-s1.tif
Scheme 1 (a) NaOH, EtOH; (b) H2O2, EtOH; (c) ClCH2COOH, K2CO3, KI, EtOH; (d) thiosemicarbazide, H2O, POCl3; (e) dry EtOH, substituted phenacyl bromide, 10% Na2CO3.

The structures of final derivatives 7(a–g) and 8(a–n) were confirmed spectral by IR, 1H NMR, 13C NMR and Mass study. IR absorption peak at ∼3000 cm−1 for aromatic C–H, disappearance of acid peak at 1700 cm−1 and primary amine peak above 3200 cm−1 confirm the synthesis of 7(a–g). C[double bond, length as m-dash]N of thiadiazole and imidazole are identified individually at around 1600 cm−1 and 1500 cm−1. 1H NMR spectra revealed all the corresponding peaks at δ = 6–8 ppm for aromatic protons while methoxy protons shows peak at δ = 3–4.5 ppm. 13C NMR and Mass gave valuable information about the cyclization of substituted chalcone to flavone and thiadiazole to imidazo thiadiazole ring system.

4. Results and discussion

4.1 In vitro cytotoxicity study

4.1.1 In vitro cytotoxicity study of compounds 7(a–g) and 8(a–n) by sulphorhodamine B assay using MDA-MB 453 cells (breast cancer cell line). Preliminary screening of compounds 7(a–g) and 8(a–n) was determined in MDA-MB 453 cells (breast cancer cell line) by sulphorhodamine B assay. The percentage cytotoxicity for all compounds was assessed at different time point 24, 48 and 72 h as shown in Table 1. Compound 7a and 7b showed maximum % cytotoxicity compared to other compounds.
Table 1 Preliminary screening of compounds 7(a–g) and 8(a–n) on MDA-MB 453 cells (breast cancer cell line) at different time pointsa
Compounds Percentage (%) cytotoxicity of MDA-MB 453 cells at different time points
24 h 48 h 72 h
500 μM 250 μM 500 μM 250 μM 500 μM 250 μM
a All the values are expressed as mean ± SEM of triplicates compared to control.
7a 45.44 ± 0.23 27.0 ± 1.3 39.7 ± 0.67 45.4 ± 0.76 56.5 ± 1.1 44.05 ± 1.23
7b 48.8 ± 1.34 33.3 ± 0.72 57.5 ± 0.12 37.3 ± 0.23 63.1 ± 0.56 29.90 ± 0.12
7c −16.7 ± 0.9 −14.2 ± 0.87 −12.7 ± 0.09 −12.9 ± 0.12 −11.3 ± 0.98 −10.90 ± 0.78
7d −8.9 ± 2.321 −4.91 ± 1.32 −28.9 ± 0.98 −9.09 ± 0.1 −9.6 ± 3.2 −10.2 ± 0.98
7e −14.0 ± 0.34 −10.6 ± 0.87 −24.6 ± 0.31 −12.9 ± 1.23 −12.7 ± 0.45 −19.09 ± 0.34
7f −4.23 ± 1.22 −7.9 ± 1.23 −10.29 ± 0.78 −9.0 ± 2.1 −6.7 ± 0.23 −10.09 ± 1.98
7g −6.6 ± 1.034 −1.3 ± 0.99 −2.3 ± 1.2 −9.0 ± 2.1 −7.6 ± 0.34 −10.098 ± 1.09
8a −5.4 ± 1.23 −0.3 ± 0.01 −8.9 ± 1.3 −3.3 ± 3.21 −9.4 ± 1.29 −3.098 ± 1.07
8b −8.7 ± 1.89 −1.3 ± 0.0.87 −1.9 ± 0.08 −8.8 ± 3.89 −6.2 ± 0.29 −6.098 ± 2.09
8c 29.3 ± 0.98 11.0 ± 3.2 13.1 ± 1.42 10.0 ± 0.9 3.7 ± 1.23 12.90 ± 1.06
8d 23.12 ± 0.01 −7.1 ± 1.23 2.3 ± 1.23 −8.0 ± 1.23 −8.1 ± 1.08 −6.78 ± 1.05
8e −3.23 ± 1.48 −4.5 ± 1.89 −9.38 ± 0.99 −7.0 ± 1.8 −4.6 ± 0.48 −9.12 ± 2.12
8f −23.2 ± 0.33 −25 ± 0.98 −43.7 ± 2.1 −43 ± 3.21 −29.4 ± 1.09 −23 ± 1.08
8g −17.8 ± 0.98 −16 ± 0.87 −19.0 ± 0.98 −23 ± 2.43 −30.2 ± 1.02 −32 ± 1.09
8h −67.2 ± 1.45 −34.8 ± 1.2 −46.8 ± 1.2 −13.0 ± 1.34 −31.4 ± 1.2 −56.96 ± 1.12
8i −6.9 ± 2.56 −6.91 ± 1.68 −22.8 ± 0.91 −8.01 ± 0.8 −6.2 ± 4.8 −9.23 ± 0.62
8j −11.7 ± 3.1 −9.27 ± 0.76 −10.1 ± 0.12 −4.5 ± 2.3 −12.3 ± 1.8 −9.90 ± 0.91
8k −12.8 ± 0.5 −12.2 ± 0.89 −11.7 ± 0.19 −11.9 ± 0.16 −12.3 ± 0.94 −11.90 ± 0.98
8l −12.8 ± 0.92 −11 ± 0.27 −11.0 ± 0.12 −21 ± 1.43 −12.2 ± 12.02 −21 ± 2.09
8m −12.7 ± 2.1 −6.27 ± 0.98 −13.1 ± 0.09 −6.5 ± 1.3 −10.3 ± 1.2 −8.90 ± 0.89
8n −19.6 ± 0.98 −5.2 ± 1.34 −34.8 ± 1.2 −6.7 ± 1.32 −33 ± 1.23 −9.08 ± 0.67


4.1.2 Five dose assay of selected compounds in MDA-MB 453 cells (breast cancer cell line) by SRB assay. Amongst all the tested compounds 7(a–g) and 8(a–n), 7a and 7b was the most effective, the cytotoxic potency of the compounds 7a and 7b at different time points on MDA-MB 453 cells exhibited marked growth inhibition at 72 h when compared to 24 and 48 h, in a dose-dependent fashion. In case of standard Di-Allyl Di Sulphide (DADS) a dose dependent and time dependent increase in the cytotoxicity activity was observed as evident by the IC50 values. Therefore, it was selected for detailed mechanistic study (Table 2).
Table 2 Five dose assays of selected compounds in MDA-MB 453 cells by SRB assaya
Compounds MDA MB 453 IC50 (μM) (breast cancer cell line)
24 h 48 h 72 h
a All values are expressed as mean ± SEM, n = 3. Inhibitory concentration 50 (IC50) was calculated by plotting % cytotoxicity vs. concentration using linear regression. Three independent experiments were carried out. Data was analyzed by one way ANOVA followed by post Dunnet's test; a = p < 0.05, as compared to standard Di-Allyl Di Sulphide (DADS).
7a 478 ± 24.1a 185 ± 2.20a 240 ± 25.3a
7b 578 ± 7.77a 167 ± 83.4a 315 ± 66.9
DADS 929.2 ± 1.05 724.2 ± 11.05 324.2 ± 32.40


4.1.3 Electrophoretic determination of apoptosis. For confirmation of nuclear fragmentation, DNA laddering assay was performed. As illustrated in Fig. 3, agarose gel electrophoresis of DNA extracted from MDA-MB 453 cells treated with different concentration of 7a and 7b (50, 150, 300 μm) for 72 h, revealed a progressive increase in the non-random fragmentation of DNA. 7b at 150 and 300 μM showed a characteristic fragmentation in DNA, whereas 7a showed an effective degradation in DNA at 300 μM when compared to 50 and 150 μM treated concentration. The extracted DNA was electrophoresed on 1% agarose gel at 60 V, 400 mA for 90 min. The gel were captured under UV illumination in Gel Doc system (Syngene gel documentation system).
image file: c6ra14428d-f3.tif
Fig. 3 Agarose gel electrophoresis nucleosomal DNA fragmentation of MDA-MB 453 cells induced by selected compounds 7a and 7b at 72 h.
4.1.4 Influence of 7a and 7b on the cell cycle progression through cell cycle after 48 h treatment on MDA-MB 453 cells. The assay was performed to assess the cell cycle specificity of compound (7a and 7b) on MDA-MB 453 cells. The data in Fig. 4 demonstrates that the compound 7a arrested cells in G2/M stage of the cell cycle as evidenced by a significant increase in G2/M population when cells were exposed to 50 μM. But, a significant increase in G0/G1 and S-phase population was also observed when the 7a concentration is elevated to 150 μM, which could be due to increased cell death (∼45% cell death, please compare the IC50 Table 2) at this concentration. Similar to compound 7a, compound 7b also arrested the cells in G2/M phase of the cell cycle at 50 μM concentration.
image file: c6ra14428d-f4.tif
Fig. 4 Influence of 7a and 7b on the cell cycle progression after 48 h treatment on MDA-MB 453 cells. All values are expressed as mean ± SEM, n = 3. aP < 0.05 when compared to control and bP < 0.05 when compared to DADS (1 mM). The data was analyzed by one way ANOVA followed by followed by Dunnett's multiple comparison post hoc test.

DADS, which is used as a positive control, arrested cells in G2/M phase of the cell cycle. Though there is a slight increase in S-phase population, the difference between control and DADS treated cells is not significant. Furthermore, no significant difference was seen in G0/G1 phase of the cell cycle.

4.1.5 Maximum tolerable dose of selected compounds (7a and 7b) by acute toxicity study. Maximum tolerable dose was determined by acute toxicity study according to OECD guideline-425. After 14 days administration of both compounds there were no sign of mortality but slight decline in body weight (<9.0%) was found in 2000 mg kg−1 treated mice whereas 500 mg kg−1 dosed animals were found to be safe without any sign of mortality hence the MTD was calculated.

4.2 In vivo evaluation of anti-cancer activity by Ehrlich's Ascites (EAC) model

4.2.1 Effect of 7a and 7b on viability of tumor cells. On day 15th ascitic fluid was collected and checked for percentage viability of cells, there were increased number of viable cells in negative control compared to day 0. Standard decreased the increase in number of % viable cells compared to negative control. The treatment with 7a and 7b at 25 mg kg−1 and 10 mg kg−1 significantly reduced the % increase in viable cells compared to negative control. The efficacy of 7b at 10 mg kg−1 was comparable with standard (Fig. 5).
image file: c6ra14428d-f5.tif
Fig. 5 Effect of selected compounds on % viability of tumor cells. All the values are mean ± SEM of six mice, *p < 0.05 compared to negative control. The data was analyzed by one way ANOVA followed by Dunnett's multiple comparison post hoc test.
4.2.2 Effect of 7a and 7b on change in body weight of (EAC) inoculated mice. Substantial gain in body weight of EAC inoculated negative control mice was found to be maximum gain of (35.00 ± 1.06) on day 15 when compared to day 0. Standard Di-Allyl Di Sulphide (DADS) at 50 mg kg−1 reduced the body weight (24.80 ± 0.16) compared to negative control. The treatment with 7a and 7b at 10 mg kg−1 and 25 mg kg−1 significantly reduced the % increase in the body weight when compared to negative control and the efficacy was comparable to standard (Fig. 6).
image file: c6ra14428d-f6.tif
Fig. 6 The effect of selected compounds on body weight of EAC inoculated animals. All the values are mean ± SEM of six mice. The data was analyzed by one way ANOVA followed by followed by Dunnett's multiple comparison post hoc test.
4.2.3 The effect of 7a and 7b on hematological parameters in EAC inoculated mice. In EAC inoculated negative control, the reduction in total RBC, hemoglobin (Hb) content and increase in total WBC count were significant when compared with normal mice. DADS (50 mg kg−1 i.p) significantly reversed and normalized the EAC induced hematological changes. 7a and 7b at both doses (10 and 25 mg kg−1) significantly reversed the elevated WBC count and increase in RBC and Hb content was significant when compared to negative control (Fig. 7).
image file: c6ra14428d-f7.tif
Fig. 7 Effect of 7a and 7b on haematological parameters in EAC inoculated mice. All the values are mean ± SEM of six mice, #p < 0.05 compared to normal, *p < 0.05 compared to negative control. The data was analyzed by one way ANOVA followed by Dunnett's multiple comparison post hoc test.
4.2.4 Effect of 7a and 7b on mean survival time and % increase in life span of EAC inoculated mice. Effective decrease in mean survival time of EAC inoculated negative control mice was found (15.0 ± 0.516) days, standard DADS at 50 mg kg−1 showed an increase in MST (22.8 ± 0.872) when compared to negative control, treatment with 7a at 25 mg kg−1 effectively enhanced the MST (28.8 ± 0.654) when compared to negative control mice. While treatment with 7b at 10 mg kg−1 prolonged the MST (22.3 ± 0.333) when compared to negative control. Treatments with 7a at 25 mg kg−1 showed significant increase in % increase in life span (93.10%) (Fig. 8 and 9).
image file: c6ra14428d-f8.tif
Fig. 8 Effect of selected compounds on Kaplan Meier's Estimate of EAC bearing mice.

image file: c6ra14428d-f9.tif
Fig. 9 Effect of 7a and 7b on % increase in life span in EAC inoculated mice. All the values are mean ± SEM of six mice, #p < 0.05 compared to normal, *p < 0.05 compared to negative control. The data was analyzed by one way ANOVA followed by Dunnett's multiple comparison post hoc test.
4.2.5 Effect of 7a and 7b on serum enzyme levels. In EAC inoculated negative control mice, enhancement in ALP, SGOT and SGPT were significantly high when compared with normal. DADS (50 mg kg−1 i.p) significantly reversed the elevation in EAC induced serum level changes. Treatment with 7a and 7b at both doses (10 and 25 mg kg−1) significantly reversed the elevated serum enzymes level. Higher dose of test compounds was highly effective when compared to lower dose (Fig. 10).
image file: c6ra14428d-f10.tif
Fig. 10 Effect of 7a and 7b on EAC inoculated mice serum enzymes level. All the values are mean ± SEM of six mice, #p < 0.05 compared to normal, *p < 0.05 compared to negative control. The data was analyzed by one way ANOVA followed by Dunnett's multiple comparison post hoc test.
4.2.6 Effect of 7a and 7b on liver antioxidant markers. In EAC treated negative control mice, the decrease in SOD, GSH, CAT and increase in LPO were significantly high when compared with normal. DADS (50 mg kg−1 i.p) significantly increased the decline in EAC induced liver endogenous enzymes while significantly reduced the elevated level of LPO. Treatment with 7a and 7b at both doses (10 and 25 mg kg−1) significantly reversed the declined liver enzymes level (Fig. 11).
image file: c6ra14428d-f11.tif
Fig. 11 Effect of 7a and 7b on liver antioxidant markers. All the values are mean ± SEM of six mice, #p < 0.05 compared to normal, *p < 0.05 compared to negative control. The data was analyzed by one way ANOVA followed by followed by Dunnett's multiple comparison post hoc test.
4.2.7 In vivo mechanistic studies of EAC tumor cells (DNA fragmentation assay and fluorescent imaging of EAC cells following treatment with 7a and 7b. Analysis of DNA isolated from EAC cell of animals treated with 7a, 7b and DADS showed fragmented DNA predominantly in 7a treated animals compared to 7b treated animals indicating the induction of apoptosis further. For accurate determination of live/dead nucleated cell concentration in heterogeneous samples dual-fluorescence staining of EAC cells was performed using the dyes acridine orange/ethidium bromide. 7a and 7b (10 & 25 mg kg−1) treated EAC cells displayed shrinkage as observed under varying magnifications of fluorescent imaging (Fig. 12 and 13). The standard DADS also showed similar morphology when examined.
image file: c6ra14428d-f12.tif
Fig. 12 In vivo DNA fragmentation assay of EAC cells following treatment with 7a and 7b.

image file: c6ra14428d-f13.tif
Fig. 13 The fluorescent images were captured using fluorescent microscope after dual staining with AO/EB, (A) control cell, (B) 7a 10 mg kg−1, (C) 7b 10 mg kg−1, (D) 7a 25 mg kg−1, (E) 7b 25 mg kg−1.
4.2.8 Structure activity relationship (SAR). Structure activity relationship (SAR) study indicated that the different substitution on flavone (4H-chromen-4-one) ring, exerted varied effect on anti-breast cancer activities. The anti-breast cancer activity of the newly synthesized compounds revealed that 1,3,4-thiadiazole substitution at C-3 position of 4H-chromen-4-one is more potent compared to the imidazo[2,1-b][1,3,4]thiadiazole (compound 7a, 7b and 8a, 8b). From the data shown in Tables 1 and 2, it is clear that the presence of 4-methoxy phenyl at 2nd position of 4H-chromen-4-one ring of 1,3,4-thiadiazole series enhances the anti-breast cancer activity (compound 7b) as compare to the plane phenyl substitution (7a). The possible enhancement in the anti-breast cancer activity can be further accomplished by slender variation in the ring substituents and/or extensive additional fictionalization warrants further investigations.

5. Conclusion

Conclusively, a new series of flavone analogs 7(a–g) and 8(a–n) have been successfully synthesized from 2-hydroxy acetophenone and substituted benzaldehydes. The yields of flavone derivatives were found to be ranging between 35 and 70%. The structure of compounds was characterized and confirmed by IR, 1H NMR, 13C NMR, and Mass spectral studies. In initial screening, analogs 7a [3-(5-amino-1,3,4-thiadiazol-2-yl)methoxy-2-phenyl-4H-chromen-4-one] and 7b [3-(5-amino-1,3,4-thiadiazol-2-yl)methoxy-2-(4-methoxyphenyl)-4H-chromen-4-one] were found to be effective against estrogen receptor negative cell line (MDA-MB 453) followed by their evaluation in five dose assay. For confirmation of nuclear fragmentation, DNA laddering assay was performed. Compound 7b at 150 and 300 μM showed a characteristic fragmentation in DNA, whereas 7a showed an effective degradation in DNA at 300 μM when compared to 50 and 150 μM treated concentration. Cell cycle specificity of compound (7a and 7b) on MDA-MB 453 cells has also been performed and results demonstrated that percentage of G2/M phase significantly increased with 150 μM and 50 μM of 7b and at 50 μM of 7a compared to control. In vivo EAC model study demonstrated that the treatment with 7a and 7b at 10 mg kg−1 and 25 mg kg−1 significantly reduced the % increase in the body weight, significantly reversed the elevated WBC count and increase in RBC and Hb content; considerably inverted the elevated serum enzymes and liver enzyme level. It was concluded that the synthesized flavone derivatives have potential to act as an anticancer agents and the activity of various compounds varied according to the substituent attached. These preliminary encouraging results of biological screening of the tested compounds could offer an excellent framework in this field that may lead to discovery of potent antitumor agent.

6. Experimental

6.1 Materials and methods

The chemicals employed in the synthetic work i.e. 5-methoxy 2′-hydroxy acetophenone was purchased from Sigma-Aldrich while all other chemicals i.e. thiosemicarbazide, 2′-hydroxy acetophenone, other benzaldehydes, 2-chloro acetic acid, bromine, H2O2 and POCl3 etc. were purchased from Spectrochem. All the solvents were used after distillation. Most of the solvents and chemicals used were of LR or analytical grade. The purity of the compounds was confirmed by thin layer chromatography using precoated TLC plates and solvent systems like, chloroform[thin space (1/6-em)]:[thin space (1/6-em)]methanol[thin space (1/6-em)]:[thin space (1/6-em)]formic acid (7[thin space (1/6-em)]:[thin space (1/6-em)]2.5[thin space (1/6-em)]:[thin space (1/6-em)]0.5), chloroform[thin space (1/6-em)]:[thin space (1/6-em)]methanol (8[thin space (1/6-em)]:[thin space (1/6-em)]2) and their different ratios. The spots were visualized under ultraviolet lamp and by using of iodine chamber. 1H NMR and 13C NMR spectra of synthesized compounds were recorded in DMSO solution Bruker Model (400 MHz) instrument at CSMCRI, Bhavnagar and SAIF, Punjab University, chemical shifts are reported as parts per million (ppm) using tetramethylsilane (TMS) as an internal standard. Column chromatography separations were progressed on silica gel (200–300 mesh). A series of molecules were synthesized, molecules (flavones) were dissolved in dimethyl sulphoxide (DMSO) to a stock concentration of 100 mM. Working standard for in vitro study was made up in serum containing media. The final concentration of DMSO in cell culture did not exceed 0.1%.
6.1.1 General procedure for the synthesis of 2-(3,4-disubstitutedphenyl)-3-hydroxy-6-substituted-4H-chromen-4-one 5(a–g) and 2-((6-substituted-4-oxo-2-phenyl-4H-chromen-3-yl)oxy)acetic acid 6(a–g). It was synthesized as per the method given by Gupta et al.46
6.1.2 General procedure for the synthesis of 3-((5-amino-1,3,4-thiadiazol-2-yl)methoxy)-6-substituted-2-(3,4-substitutedphenyl)-4H-chromen-4-one 7(a–g). A mixture of flavone acid 6(a–g) (0.01 mol), thiosemicarbazide (0.01 mol) and POCl3 (10 mol) are refluxed at 75 °C for 30 min. After cooling down to room temperature, sufficient water was added. The reaction mixture was then reflux at 75 °C for 3 h. After cooling reaction mixture was basified to pH 8 by drop wise addition of 50% NaOH solution under stirring. The precipitate was filtered and recrystallized with ethanol.
6.1.2.1 3-((5-Amino-1,3,4-thiadiazol-2-yl)methoxy)-2-phenyl-4H-chromen-4-one (7a). Yield 69%, mp 237–239 °C, IR (KBr) Vmax 3400 (NH stretch), 2922 (CH aro. stretch), 2851 (CH ali. stretch), 1642 (C[double bond, length as m-dash]O) cm−1, 1H NMR (DMSO-d6) δ ppm: 6.52–8.21 (m, 9H, Ar-H), 6.12 (s, 2H, NH2), 5.54 (s, 2H, CH2); 13C NMR (DMSO-d6) δ ppm: 172.12, 169.34, 163.12, 159.29, 156.22, 148.12, 138.92, 136.22, 135.22, 134.12, 132.22, 130.82, 128.27, 127.45, 125.48, 123.44, 122.46, 121.33, 120.37, 118.13, 116.23, 66.39, 55.38; HRMS (ESI) m/z calcd for C18H13N3O3S: 351.0678; found: 351.0683.
6.1.2.2 3-((5-Amino-1,3,4-thiadiazol-2-yl)methoxy)-2-(4-methoxyphenyl)-4H-chromen-4-one (7b). Yield 39%, mp 245–247 °C, IR (KBr) Vmax 3338 (NH stretch), 3141 (CH aro. stretch), 2918 (CH ali. stretch), 1642.69 (C[double bond, length as m-dash]O) cm−1, 1H NMR (DMSO-d6) δ ppm: 6.38–8.23 (m, 8H, Ar-H), 6.11 (s, 2H, NH2), 5.13 (s, 2H, CH2), 3.92 (s, 3H, CH3); 13C NMR (DMSO-d6) δ ppm: 175.02, 169.20, 163.26, 161.28, 156.49, 154.72, 145.89, 142.42, 130.48, 128.48, 125.38, 123.24, 122.46, 121.77, 118.61, 116.42, 114.62, 65.35, 56.81; HRMS (ESI) m/z calcd for C19H15N3O4S: 381.0783; found: 381.0789.
6.1.2.3 3-((5-Amino-1,3,4-thiadiazol-2-yl)methoxy)-2-(3,4-dimethoxyphenyl)-4H-chromen-4-one (7c). Yield 47%, mp 248–251 °C, IR (KBr) Vmax 3339 (NH stretch), 3142 (CH aro. stretch), 2917 (CH ali. stretch), 1668 (C[double bond, length as m-dash]O) cm−1, 1H NMR (DMSO-d6) δ ppm: 6.58–8.34 (m, 8H, Ar-H), 6.09 (s, 2H, NH2), 5.15 (s, 2H, CH2), 3.92 (s, 3H, OCH3), 3.82 (s, 3H, OCH3); 13C NMR (DMSO-d6) δ ppm: 176.12, 167.78, 166.82, 161.28, 158.97, 156.82, 152.27, 139.37, 135.92, 125.27, 123.12, 122.13, 121.12, 120.21, 118.78, 114.16, 112.17, 65.28, 56.28, 56.01; HRMS (ESI) m/z calcd for C20H17N3O5S: 411.0889; found: 411.0895.
6.1.2.4 3-((5-Amino-1,3,4-thiadiazol-2-yl)methoxy)-6-methoxy-2-phenyl-4H-chromen-4-one (7d). Yield 48%, mp 244–246 °C, IR (KBr) Vmax 3321 (NH stretch), 3111 (CH aro. stretch), 2932 (CH ali. stretch), 1662 (C[double bond, length as m-dash]O) cm−1, 1H NMR (DMSO-d6) δ ppm: 6.62–8.10 (m, 8H, Ar-H), 6.14 (s, 2H, NH2), 5.25 (s, 2H, CH2), 3.76 (s, 3H, OCH3); 13C NMR (DMSO-d6) δ ppm: 174.18, 169.18, 164.17, 159.91, 156.23, 149.51, 140.12, 132.13, 130.16, 128.12, 127.12, 124.32, 122.12, 120.55, 111.62, 64.23, 55.81; HRMS (ESI) m/z calcd for C19H15N3O4S: 381.0783; found: 381.0788.
6.1.2.5 3-((5-Amino-1,3,4-thiadiazol-2-yl)methoxy)-6-methoxy-2-(4-methoxyphenyl)-4H-chromen-4-one (7e). Yield 63%, mp 235–237 °C, IR (KBr) Vmax 3348 (NH stretch), 3028 (CH aro. stretch), 2934 (CH ali. stretch), 1683 (C[double bond, length as m-dash]O) cm−1, 1H NMR (DMSO-d6) δ ppm: 6.82–8.12 (m, 7H, Ar-H), 6.15 (s, 2H, NH2), 5.01 (s, 2H, CH2), 3.71 (s, 3H, OCH3), 3.92 (s, 3H, OCH3); 13C NMR (DMSO-d6) δ ppm: 178.12, 168.23, 167.12, 161.23, 159.112, 156.43, 150.51, 139.12, 128.28, 128.01, 124.12, 122.34, 122.01, 120.12, 114.12, 112.12, 110.12, 64.26, 56.81, 55.82; HRMS (ESI) m/z calcd for C20H17N3O5S: 411.0889; found: 411.0881.
6.1.2.6 3-((5-Amino-1,3,4-thiadiazol-2-yl)methoxy)-2-(3-methoxyphenyl)-4H-chromen-4-one (7f). Yield 56%, mp 239–242 °C, IR (KBr) Vmax 3328 (NH stretch), 3011 (CH aro. stretch), 2934 (CH ali. stretch), 1676 (C[double bond, length as m-dash]O) cm−1, 1H NMR (DMSO-d6) δ ppm: 6.82–8.38 (m, 8H, Ar-H), 6.10 (s, 2H, NH2), 5.16 (s, 2H, CH2), 3.91 (s, 3H, OCH3); 13C NMR (DMSO-d6) δ ppm: 172.12, 169.12, 165.12, 162.12, 159.12, 158.12, 140.12, 138.12, 130.12, 129.16, 125.58, 123.84, 121.47, 120.22, 116.51, 113.55, 112.57, 64.25, 55.18; HRMS (ESI) m/z calcd for C19H15N3O4S: 381.0783; found: 381.0792.
6.1.2.7 3-((5-Amino-1,3,4-thiadiazol-2-yl)methoxy)-6-methoxy-2-(3-methoxyphenyl)-4H-chromen-4-one (7g). Yield 59%, mp 244–246 °C, IR (KBr) Vmax 3312 (NH stretch), 3021 (CH aro. stretch), 2973 (CH ali. stretch), 1681 (C[double bond, length as m-dash]O) cm−1, 1H NMR (DMSO-d6) δ ppm: 6.72–8.29 (m, 7H, Ar-H), 6.11 (s, 2H, NH2), 5.06 (s, 2H, CH2), 3.81 (s, 3H, OCH3), 3.91 (s, 3H, OCH3); 13C NMR (DMSO-d6) δ ppm: 173.12, 168.12, 165.12, 162.12, 159.38, 158.93, 150.12, 140.38, 130.43, 129.12, 126.34, 124.12, 124.72, 122.43, 116.23, 114.23, 110.61, 63.52, 55.92, 55.18; HRMS (ESI) m/z calcd for C20H17N3O5S: 411.0889; found: 411.0895.
6.1.3 General procedure for the synthesis of 2-(3,4-disubstitutedphenyl)-6-substituted-3-((6-(2,3,4-trisubstitutedphenyl)imidazo[2,1-b][1,3,4]thiadiazol-2-yl)methoxy)-4H-chromen-4-one 8(a–n). A mixture of equimolar quantities of flavone thiadiazole 7(a–g) (0.01 mol) and 2-bromo-1-(substituted-aryl) ethanone (0.01 mol) was refluxed in dry ethanol for 20 h. The excess of solvent was distilled off and the solid hydrobromide that separated was collected by filtration, suspended in water and neutralized by 10% sodium carbonate solution to get free base. It was filtered, washed with water, dried and crystallized from ethanol.
6.1.3.1 3-((6-Phenylimidazo[2,1-b][1,3,4]thiadiazol-2-yl)methoxy)-2-phenyl-4H-chromen-4-one (8a). Yield 57%, mp 252–254 °C, IR (KBr) Vmax 3048 (CH aro. stretch), 2913 (CH ali. stretch), 1691 (C[double bond, length as m-dash]O) cm−1, 1H NMR (DMSO-d6) δ ppm: 6.28–8.29 (m, 14H, Ar-H), 8.41 (s, 1H, CH-imidazole), 5.18 (m, 2H, CH2); 13C NMR (DMSO-d6) δ ppm: 178.12, 169.12, 158.12, 148.12, 138.12, 158.12, 148.21, 142.21, 138.12, 134.12, 132.12, 130.12, 129.12, 128.12, 126.12, 125.12, 124.12, 122.12, 121.12, 120.12, 118.11, 66.91; HRMS (ESI) m/z calcd for C26H17N3O3S: 451.0991; found: 451.0997.
6.1.3.2 3-((6-Phenylimidazo[2,1-b][1,3,4]thiadiazol-2-yl)methoxy)-2-(4-methoxyphenyl)-4H-chromen-4-one (8b). Yield 63%, mp 259–261 °C, IR (KBr) Vmax 3056 (CH aro. stretch), 2910 (CH ali. stretch), 1684 (C[double bond, length as m-dash]O) cm−1, 1H NMR (DMSO-d6) δ ppm: 6.46–8.36 (m, 13H, Ar-H), 8.44 (s, 1H, CH-imidazole), 5.12 (m, 2H, CH2), 3.91 (s, 3H, OCH3); 13C NMR (DMSO-d6) δ ppm: 172.12, 169.12, 162.12, 158.38, 156.12, 148.12, 142.12, 138.12, 136.12, 134.10, 130.12, 129.12, 128.71, 126.51, 124.18, 122.41, 122.16, 120.31, 120.17, 118.11, 116.12, 64.19, 55.18; HRMS (ESI) m/z calcd for C27H19N3O4S: 481.1096; found: 481.1091.
6.1.3.3 3-((6-(3-Methoxyphenyl)imidazo[2,1-b][1,3,4]thiadiazol-2-yl)methoxy)-2-phenyl-4H-chromen-4-one (8c). Yield 31%, mp 252 °C, IR (KBr) Vmax 3034 (CH aro. stretch), 2921 (CH ali. stretch), 1689 (C[double bond, length as m-dash]O) cm−1, 1H NMR (DMSO-d6) δ ppm: 6.36–8.23 (m, 13H, Ar-H), 8.32 (s, 1H, CH-imidazole), 5.10 (m, 2H, CH2), 3.89 (s, 3H, OCH3); 13C NMR (DMSO-d6) δ ppm: 175.01, 169.10, 166.11, 159.91, 156.21, 148.11, 136.91, 135.12, 134.12, 134.01, 130.31, 129.21, 128.16, 127.19, 126.19, 125.81, 123.14, 122.23, 121.67, 119.78, 116.31, 114.33, 113.66, 64.92, 55.28; HRMS (ESI) m/z calcd for C27H19N3O4S: 481.1096; found: 481.1090.
6.1.3.4 3-((6-(3-Methoxyphenyl)imidazo[2,1-b][1,3,4]thiadiazol-2-yl)methoxy)-2-(4-methoxyphenyl)-4H-chromen-4-one (8d). Yield 34%, mp 248–250 °C, IR (KBr) Vmax 3012 (CH aro. stretch), 2934 (CH ali. stretch), 1678 (C[double bond, length as m-dash]O) cm−1, 1H NMR (DMSO-d6) δ ppm: 6.36–8.23 (m, 12H, Ar-H), 8.32 (s, 1H, CH-imidazole), 5.14 (m, 2H, CH2), 3.91 (s, 3H, OCH3), 3.81 (s, 3H, OCH3); 13C NMR (DMSO-d6) δ ppm: 174.23, 169.23, 164.48, 162.91, 159.91, 158.12, 148.13, 136.92, 134.22, 133.22, 132.03, 130.22, 128.49, 126.82, 123.45, 122.26, 121.33, 120.72, 119.82, 116.12, 114.23, 114.12, 112.16, 64.92, 56.22, 55.08; HRMS (ESI) m/z calcd for C28H21N3O5S: 511.1202; found: 511.1206.
6.1.3.5 3-((6-(2-Methoxyphenyl)imidazo[2,1-b][1,3,4]thiadiazol-2-yl)methoxy)-2-phenyl-4H-chromen-4-one (8e). Yield 54%, mp 251–253 °C, IR (KBr) Vmax 3048 (CH aro. stretch), 2923 (CH ali. stretch), 1681 (C[double bond, length as m-dash]O) cm−1, 1H NMR (DMSO-d6) δ ppm: 6.48–8.10 (m, 13H, Ar-H), 8.28 (s, 1H, CH-imidazole), 5.04 (m, 2H, CH2), 3.92 (s, 3H, OCH3); 13C NMR (DMSO-d6) δ ppm: 176.01, 169.02, 159.92, 156.31, 155.22, 148.23, 142.91, 138.22, 136.22, 132.11, 130.33, 129.37, 128.36, 127.39, 126.29, 125.38, 123.44, 122.43, 121.67, 120.35, 119.39, 118.14, 114.13, 65.92, 56.23; HRMS (ESI) m/z calcd for C27H19N3O4S: 481.1096; found: 481.1090.
6.1.3.6 3-((6-(2-Methoxyphenyl)imidazo[2,1-b][1,3,4]thiadiazol-2-yl)methoxy)-2-(4-methoxyphenyl)-4H-chromen-4-one (8f). Yield 42%, mp 247–250 °C, IR (KBr) Vmax 3012 (CH aro. stretch), 2921 (CH ali. stretch), 1686 (C[double bond, length as m-dash]O) cm−1, 1H NMR (DMSO-d6) δ ppm: 6.28–8.16 (m, 12H, Ar-H), 8.35 (s, 1H, CH-imidazole), 5.09 (m, 2H, CH2), 3.96 (s, 3H, OCH3), 3.86 (s, 3H, OCH3); 13C NMR (DMSO-d6) δ ppm: 175.23, 169.02, 160.12, 159.28, 158.93, 157.33, 156.32, 148.13, 138.92, 136.32, 135.42, 133.15, 120.27, 128.48, 127.48, 126.48, 123.44, 120.33, 120.39, 118.13, 116.22, 114.23, 112.13, 65.92, 56.21, 55.08; HRMS (ESI) m/z calcd for C28H21N3O5S: 511.1202; found: 511.1208.
6.1.3.7 3-((6-(2,4-Dimethoxyphenyl)imidazo[2,1-b][1,3,4]thiadiazol-2-yl)methoxy)-2-phenyl-4H-chromen-4-one (8g). Yield 44%, mp 245–246 °C, IR (KBr) Vmax 3053 (CH aro. stretch), 2921 (CH ali. stretch), 1682 (C[double bond, length as m-dash]O) cm−1, 1H NMR (DMSO-d6) δ ppm: 6.38–8.36 (m, 12H, Ar-H), 8.41 (s, 1H, CH-imidazole), 5.16 (m, 2H, CH2), 3.91 (s, 3H, OCH3), 3.85 (s, 3H, OCH3) δ ppm: 176.23, 171.02, 165.62, 162.23, 159.92, 158.22, 148.12, 138.29, 136.22, 135.23, 132.25, 130.43, 128.56, 128.36, 126.92, 125.83, 123.34, 122.43, 121.47, 118.13, 116.23, 114.23, 112.13, 110.12, 66.92, 56.38, 55.12; HRMS (ESI) m/z calcd for C28H21N3O5S: 511.1202; found: 511.1208.
6.1.3.8 3-((6-(2,4-Dimethoxyphenyl)imidazo[2,1-b][1,3,4]thiadiazol-2-yl)methoxy)-2-(4methoxyphenyl)-4H-chromen-4-one (8h). Yield 42%, mp 244–248 °C, IR (KBr) Vmax 3063 (CH aro. stretch), 2942 (CH ali. stretch), 1672 (C[double bond, length as m-dash]O) cm−1, 1H NMR (DMSO-d6) δ ppm: 6.18–8.06 (m, 11H, Ar-H), 8.21 (s, 1H, CH-imidazole), 4.98 (m, 2H, CH2), 3.92 (s, 3H, OCH3), 3.84 (s, 3H, OCH3), 3.81 (s, 3H, OCH3); 13C NMR (DMSO-d6) δ ppm: 178.10, 169.23, 167.82, 164.81, 162.23, 160.13, 159.33, 156.42, 149.14, 142.92, 138.22, 136.22, 134.35, 130.28, 128.28, 126.42, 124.36, 122.33, 120.27, 119.18, 118.24, 114.22, 112.23, 111.12, 110.82, 65.39, 56.12, 55.88, 55.10; HRMS (ESI) m/z calcd for C29H23N3O6S: 541.1308; found: 541.1302.
6.1.3.9 3-((6-(4-Chlorophenyl)imidazo[2,1-b][1,3,4]thiadiazol-2-yl)methoxy)-2-phenyl-4H-chromen-4-one (8i). Yield 75%, mp 267–269 °C, IR (KBr) Vmax 3024 (CH aro. stretch), 2912 (CH ali. stretch), 1684 (C[double bond, length as m-dash]O), 712 (C–Cl) cm−1, 1H NMR (DMSO-d6) δ ppm: 6.12–8.21 (m, 13H, Ar-H), 8.41 (s, 1H, CH-imidazole), 4.99 (m, 2H, CH2); 13C NMR (DMSO-d6) δ ppm: 178.23, 169.23, 158.92, 156.22, 148.12, 142.91, 138.12, 136.21, 134.13, 132.11, 130.23, 129.33, 128.49, 128.16, 127.92, 127.29, 125.28, 123.24, 122.13, 121.17, 118.12, 66.19; HRMS (ESI) m/z calcd for C26H16ClN3O3S: 485.0601; found: 485.0607.
6.1.3.10 3-((6-(4-Chlorophenyl)imidazo[2,1-b][1,3,4]thiadiazol-2-yl)methoxy)-2-(4-methoxyphenyl)-4H-chromen-4-one (8j). Yield 68%, mp 266–268 °C, IR (KBr) Vmax 3034 (CH aro. stretch), 2910 (CH ali. stretch), 1681 (C[double bond, length as m-dash]O), 701 (C–Cl) cm−1, 1H NMR (DMSO-d6) δ ppm: 6.19–8.26 (m, 12H, Ar-H), 8.38 (s, 1H, CH-imidazole), 5.09 (m, 2H, CH2), 3.84 (s, 3H, OCH3); 13C NMR (DMSO-d6) δ ppm: 172.60, 162.23, 160.38, 154.41, 152.31, 145.52, 138.12, 133.33, 130.68, 129.33, 124.69, 124.31, 123.54, 121.30, 118.18, 114.43, 113.91, 63.55, 55.27; HRMS (ESI) m/z calcd for C27H18ClN3O4S: 515.0707; found: 515.0701.
6.1.3.11 3-((6-(4-Fluorophenyl)imidazo[2,1-b][1,3,4]thiadiazol-2-yl)methoxy)-2-phenyl-4H-chromen-4-one (8k). Yield 39%, mp 268–272 °C, IR (KBr) Vmax 3012 (CH aro. stretch), 2923 (CH ali. stretch), 1684 (C[double bond, length as m-dash]O), 1201 (C–F) cm−1, 1H NMR (DMSO-d6) δ ppm: 6.12–8.21 (m, 13H, Ar-H), 8.41 (s, 1H, CH-imidazole), 4.99 (m, 2H, CH2); 13C NMR (DMSO-d6) δ ppm: 176.12, 169.12, 161.27, 159.91, 156.22, 149.12, 141.92, 138.22, 136.21, 132.31, 130.61, 129.16, 128.92, 126.19, 125.26, 124.28, 122.43, 120.23, 119.27, 118.21, 116.20, 64.92; HRMS (ESI) m/z calcd for C26H16FN3O3S: 469.0896; found: 469.0891.
6.1.3.12 3-((6-(4-Fluorophenyl)imidazo[2,1-b][1,3,4]thiadiazol-2-yl)methoxy)-2-(4-methoxyphenyl)-4H-chromen-4-one (8l). Yield 45%, mp 218–220 °C, IR (KBr) Vmax 3064 (CH aro. stretch), 2963 (CH ali. stretch), 1689 (C[double bond, length as m-dash]O), 1223 (C–F) cm−1, 1H NMR (DMSO-d6) δ ppm: 6.23–8.32 (m, 12H, Ar-H), 8.38 (s, 1H, CH-imidazole), 5.12 (m, 2H, CH2), 3.91 (s, 3H, OCH3); 13C NMR (DMSO-d6) δ ppm: 178.12, 167.23, 164.92, 162.83, 160.92, 158.22, 148.21, 142.19, 138.22, 136.32, 130.12, 129.26, 128.16, 126.18, 124.14, 122.33, 121.26, 120.71, 118.21, 116.03, 114.32, 64.92, 55.18; HRMS (ESI) m/z calcd for C27H18FN3O4S: 499.1002; found: 499.1009.
6.1.3.13 3-((6-(4-Methoxyphenyl)imidazo[2,1-b][1,3,4]thiadiazol-2-yl)methoxy)-2-phenyl-4H-chromen-4-one (8m). Yield 34%, mp 249–253 °C, IR (KBr) Vmax 3084 (CH aro. stretch), 2985 (CH ali. stretch), 1684 (C[double bond, length as m-dash]O) cm−1, 1H NMR (DMSO-d6) δ ppm: 6.13–8.32 (m, 13H, Ar-H), 8.34 (s, 1H, CH-imidazole), 5.15 (m, 2H, CH2), 3.81 (s, 3H, OCH3); 13C NMR (DMSO-d6) δ ppm: 178.12, 168.01, 165.62, 158.92, 156.22, 148.12, 138.92, 136.22, 135.22, 130.23, 129.36, 128.25, 127.29, 126.93, 125.28, 124.32, 122.43, 120.23, 119.73, 118.13, 116.83, 65.39, 55.38; HRMS (ESI) m/z calcd for C27H19N3O4S: 481.1096; found: 481.1090.
6.1.3.14 3-((6-(4-Methoxyphenyl)imidazo[2,1-b][1,3,4]thiadiazol-2-yl)methoxy)-2-(4-methoxyphenyl)-4H-chromen-4-one (8n). Yield 48%, mp 259–262 °C, IR (KBr) Vmax 3042 (CH aro. stretch), 2978 (CH ali. stretch), 1678 (C[double bond, length as m-dash]O) cm−1, 1H NMR (DMSO-d6) δ ppm: 6.23–8.23 (m, 12H, Ar-H), 8.30 (s, 1H, CH-imidazole), 5.05 (m, 2H, CH2), 3.86 (s, 3H, OCH3), 3.92 (s, 3H, OCH3); 13C NMR (DMSO-d6) δ ppm: 178.12, 169.12, 164.61, 160.18, 159.91, 158.12, 152.11, 142.91, 138.12, 136.21, 130.18, 128.51, 126.81, 125.31, 123.14, 122.36, 120.31, 119.71, 118.12, 116.81, 114.21, 65.91, 55.84, 55.02; HRMS (ESI) m/z calcd for C28H21N3O5S: 511.1202; found: 511.1209.

6.2 In vitro anticancer activity

6.2.1 Cell lines. The human breast cancer cell line MDA-MB 453 was obtained from the National Center of Cell Sciences (NCCS), Pune, India. MDA-MB 231 cells were cultured in DMEM medium (Gibco) supplemented with 10% foetal bovine serum (FBS) and 100 IU ml−1 penicillin. All cells were cultured at 37 °C with 5% CO2.
6.2.2 Sulphorhodamine-B assay. The cytotoxic potential of test compounds on growth of breast cancer cells (MDA-MB 453) was assessed by SRB assay. A fixed number of cells (5000), taken in a volume of 100 μl were added to each well of a flat-bottomed 96-well plate, and kept in CO2 incubator for adherence of the cells for 48 h. The test compounds were dissolved in DMSO (0.1%) and further diluted with the medium. After 48 h, cells were treated with 100 μl of two different concentrations (250 and 500 μM) of test compounds at different time points (24, 48 and 72 h). Cells in the control wells received the same volume of medium containing 0.1% DMSO. Di-Allyl Di Sulphide (DADS) was used as a positive control.47 After incubation cells were fixed with 10% TCA and stained with 0.4% of SRB for 30 min, bound SRB was solubilized in 10 mM Tris base solution and the absorbance was measured at 490 nm in a Bio-Rad plate reader. Percentage inhibition was calculated using formula:
image file: c6ra14428d-t1.tif
C = absorbance of DMSO vehicle control treated cells, T = absorbance of compound treated cells, SRB assay for optimization of dose with the selected compounds by five dose assay.The promising compounds (7a and 7b) identified from the preliminary screening were further subjected to five dose assay by SRB assay at an extended time points like 24, 48 and 72 h on MDA-MB 453 cells to determine the time dependent activity of compounds and to optimize the dose for further assay, IC50 was determined.
6.2.3 DNA fragmentation assay. Optimum number of MDA-MB 453 cells (1 × 10⁶) was incubated for 48 h in DMEM media supplemented with 10% FBS. After 48 h incubation, media was aspirated and treated with different concentrations (50, 150 and 300 μM) of the compounds (7a and 7b) for 72 h. After treatment media containing cells were subjected to centrifugation. The adherent cells in the flasks as well as cell pellets in the centrifuge tube were washed with PBS and 25 μl of RNAse solution was added to the centrifuge tube kept at 57 °C for 1 h. Cell lysate containing DNA sample was loaded into each well of the agarose gel and electrophoresis was carried at 60 V, 400 mA for 90 min. Images were captured using gel documentation system.
6.2.4 Flow cytometry analysis. A fixed number of MDA-MB 453 cells (1 × 10⁶) were treated with different concentrations of 7a and 7b (50 and 150 μM). After treatment, cells were harvested and washed twice with PBS and re-suspended in 70% EtOH while vortexing and stored until analysis. At the time of analysis, cells were washed with PBS to remove alcohol and incubated with FACS reagent containing RNAse (100 μg ml−1), Triton X (0.1%) and trisodium citrate (0.1%) for 75 min at 37 °C. After incubation cells were stained with propidium iodide (2 mg ml−1) for 15 min in ice-cold dark condition, cells were then mixed thoroughly and subjected to flow cytometer (BD FACS Calibur, Mountain View, USA) for acquisition. The relative DNA content per cell was obtained by measuring the fluorescence of PI that bound stoichiometrically to DNA. The DNA histograms were analyzed using cell Proquest software, the experiment was conducted in triplicates and Di-Allyl Di Sulphide (DADS) was used as standard.
6.2.5 Determination of maximum tolerable dose of the selected compounds (7a and 7b). Acute toxicity of selected compounds was done according to OECD guidelines 425, swiss albino mice of either sex was selected. Mice were deprived of the food 4 h prior to administration of test compounds and till 2 h after administration. On the day zero, test compounds were administered to animals at a dose of 2000 mg kg−1 and 550 mg kg−1 and animals were observed for death for 4, 6 and 8 h upto 14 days following administration of compounds, MTD was calculated.

6.3 In vivo study

In vivo study Ehrlich's Ascites Carcinoma (EAC) cells were originally obtained from Amala Cancer Research Centre, Thrissur, India, were maintained and propagated as ascites tumor in swiss albino mice by serial intra-peritoneal transplantation at animal quarantine house, JSS College of pharmacy, Mysore, India.
6.3.1 Animals. Eight to ten week old swiss albino mice weighing between 25 and 30 g were procured form central animal facility, JSS medical college, animals were maintained under the controlled conditions of temperature (23 ± 30 °C), humidity (50 ± 5%), light and dark respectively. The animals were provided with sterile food and water ad libitium. Six animals were housed in each polypropylene cage containing paddy husk as bedding. Animal care and handling was done according to guidelines issued by CPCSEA, Government of India. Experiments were performed after obtaining ethical clearance from IAEC [IAEC approval no. 154/2014].
6.3.2 Anticancer activity of selected compounds (7a and 7b) against EAC inoculated mice. EAC cells obtained from the peritoneal cavity of an EAC bearing mouse, after 15 days of tumor transplantation. Aspirated EAC cells were diluted in PBS and fixed number of viable EAC cells (2.5 × 10⁶ cells per mouse) was injected intraperitoneally into each mouse. After 24 h of tumor inoculation the animals were randomly divided into following groups of six mice each and treated with test compounds (7a and 7b) at different concentration based on MTD.
Group I : Normal
Group II : EAC cells + DMSO i.p for 7 days
Group III : EAC cells + DADS (50 mg kg−1) i.p for 7 days
Group IV : EAC cells + 7a-14 (25 mg kg−1) i.p for 7 days
Group V : EAC cells + 7a-14 (10 mg kg−1) i.p for 7 days
Group VI : EAC cells + 7b-4 (25 mg kg−1) i.p for 7 days
Group VII : EAC cells + 7b-4 (10 mg kg−1) i.p for 7 days

The test compounds (7a and 7b) were administered for seven days, i.p, alternatively starting from day 1 of tumor inoculation. Di-Allyl Di Sulphide (DADS) at dose of 50 mg kg−1 was administered i.p which served as standard drug. Body weight was assessed every third day after tumor inoculation to assess the increase in tumor growth. The animals were monitored for 15 days and various parameters were evaluated i.e. haematological parameters (RBC, WBC, Hb content), viable tumor cell count was done to check the number of viable cell among the treated group, mortality was assessed to calculate Mean Survival Time [MST] and percentage increase in life span using formula.

Cell count = (no. of cells × dilution)/(area × thickness of liquid film)

Percentage increase in body wt = (body weight on respective day − body weight on day 0) × 100/body weight on day 0

% ILS = [(MST test − MST con.)] × 100/MST (con.)

6.3.3 Biochemical tests of EAC inoculated mice. On completion of treatment serum alanine transaminase (ALT), aspartate transaminase (AST) and ALP activities were determined using a commercial kit (Merck), liver homogenate glutathione (GSH) was determined by the method of Alapati et al.48 Malondialdehyde (MDA) was determined in liver tissue homogenate superoxide dismutase (SOD) and catalase (CAT) activity was assayed spectrophotometrically.48
6.3.4 DNA fragmentation assay on isolated EAC cells. DNA fragmentation assay on isolated EAC cells was done by non-enzymatic method, adequate volume of EAC cells was aspirated and diluted with PBS and centrifuged for 3 min at 3000 rpm, supernatent was discarded and obtained pellets was washed with PBS, 100 μl of 10% SDS & TE mixture was added to pellets and incubated for 30 min, after incubation 1.6 ml of 8 M potassium acetate was added and centrifuged at 7000 rpm for 1 h. The obtained supernatent was separated out and to that organic propionate mixture of (phenol[thin space (1/6-em)]:[thin space (1/6-em)]chloroform[thin space (1/6-em)]:[thin space (1/6-em)]isoamyl alcohol) was added, to above mixture 2 vol. of ice cold ethanol was added and centrifuged at 10[thin space (1/6-em)]000 rpm for 30 min. Cell lysate containing DNA was dissolved into 50 μl of Tris EDTA (TE) buffer and sample was loaded into each well of the agarose gel and electrophoresis was carried at 60 V, 400 mA for 90 min. Images were captured using gel documentation system.
6.3.5 Fluorescent imaging of EAC cells using dual staining. Dual staining with ethidium bromide and acridine orange was performed. Aspirated EAC cells suspended in PBS (25 μl) from each group was mixed with 1 μl AO/EB for 15 min prior to microscopic evaluation. Thin smear of stained cells was prepared on microscopic slides, Images were captured using fluorescent microscope.

Acknowledgements

The authors would like to thank Advisor and Member Secretary, Gujarat Council on Science and Technology, Gandhinagar (Grant No. GUJCOST/MRP/12-13/65/1332) for funding this project, H. G. Shiva Kumar, Principal JSS College of Pharmacy, Mysore for rendering us necessary laboratory facilities and Natco Pharma, Hyderabad for providing necessary drugs. Authors Harun M. Patel and Rahul Pawara would like to thanks “Science and Engineering Research Board (SERB) of Department of Science and Technology (DST) Govt. of India” (Grant No. YSS/2015/002017) for funding the project.

References

  1. C. E. De Santis, C. C. Lin, A. B. Mariotto, R. L. Siegel, K. D. Stein, J. L. Kramer, R. Alteri, A. S. Robbins and A. Jemal, Cancer treatment and survivorship statistics, Ca-Cancer J. Clin., 2014, 64, 252–271 CrossRef PubMed.
  2. M. M. Gottesman, T. Fojo and S. E. Bates, Nat. Rev. Cancer, 2002, 2, 48–58 CrossRef CAS PubMed.
  3. J. R. Das, E. B. Fryar-Tita, Y. Zhou, S. Green, W. M. Southerland and D. Bowen, Anticancer Res., 2007, 27, 3791–3799 CAS.
  4. V. R. Solomon and H. Lee, Biomed. Pharmacother., 2012, 66, 213–220 CrossRef CAS PubMed.
  5. H. M. Coley, Cancer Treat. Rev., 2008, 34, 378–390 CrossRef CAS PubMed.
  6. P. T. Daniel, U. Koert and J. Schuppan, Angew. Chem., Int. Ed., 2006, 45, 872–893 CrossRef CAS PubMed.
  7. F. E. Koehn and G. T. Carter, Nat. Rev. Drug Discovery, 2005, 4, 206–220 CrossRef CAS PubMed.
  8. M. S. Butler, J. Nat. Prod., 2004, 67, 2141–2153 CrossRef CAS PubMed.
  9. G. M. Cragg, P. G. Grothaus and D. J. Newman, Chem. Rev., 2009, 109, 3012–3043 CrossRef CAS PubMed.
  10. D. J. Newman and G. M. Cragg, J. Nat. Prod., 2012, 75, 311–335 CrossRef CAS PubMed.
  11. G. Priyadarshani, S. Amrutkar, A. Nayak, U. C. Banerjee, C. N. Kundu and S. K. Guchhait, Eur. J. Med. Chem., 2016, 122, 43–54 CrossRef CAS PubMed.
  12. C. M. Passreiter, A. K. Suckow-Schnitker, A. Kulawik, J. Addae-Kyereme, C. W. Wright and W. Wätjen, Phytochemistry, 2015, 117, 237–244 CrossRef CAS PubMed.
  13. R. Luo, J. Wang, L. Zhao, N. Lu, Q. You, Q. Guo and Z. Li, Bioorg. Med. Chem. Lett., 2014, 24, 1334–1338 CrossRef CAS PubMed.
  14. W. Xuea, B. Song, H. J. Zhao, X. B. Qi, Y. J. Huang and X. H. Liu, Eur. J. Med. Chem., 2015, 97, 155–163 CrossRef PubMed.
  15. Q. Li, Y. Zhai, W. Luo, Z. Zhu, X. Zhang, S. Xie, C. Hong, Y. Wang, Y. Su, J. Zhao and C. Wang, Eur. J. Med. Chem., 2016, 121, 110–119 CrossRef CAS PubMed.
  16. V. M. Kolb, Prog. Drug Res., 1998, 51, 185–217 CAS.
  17. S. Grabley and R. Thiericke, Adv. Biochem. Eng./Biotechnol., 1999, 64, 101–154 CrossRef CAS PubMed.
  18. B. P. Heather and W. Jefferson, Front. Neuroendocrinol., 2010, 31, 400–419 CrossRef PubMed.
  19. M. O. Sandrine and C. Henn, J. Steroid Biochem. Mol. Biol., 2011, 125, 66–82 CrossRef PubMed.
  20. H. M. Patel, P. Bari, R. Karpoormath, M. Noolvi, N. Thapliyal, S. Surana and P. Jain, RSC Adv., 2015, 5, 56724–56771 RSC.
  21. H. M. Patel, B. Sing, V. Bhardwaj, M. Palkar, M. S. Shaikh, R. Rane, W. S. Alwan, A. K. Gadad, M. N. Noolvi and R. Karpoormath, Eur. J. Med. Chem., 2015, 93, 599–613 CrossRef CAS PubMed.
  22. M. N. Noolvi and H. M. Patel, Arabian J. Chem., 2013, 6(1), 35–48 CrossRef CAS.
  23. M. N. Noolvi, H. M. Patel and S. Kamboj, Eur. J. Med. Chem., 2012, 56, 56–69 CrossRef CAS PubMed.
  24. T. A. Grese and J. A. Dodge, Curr. Pharm. Des., 1998, 4, 71–92 CAS.
  25. B. E. Henderson, R. Ross and L. Bernstein, Cancer Res., 1988, 48, 246–253 CAS.
  26. D. R. Ciocca and L. M. V. Roig, Endocr. Rev., 1995, 16, 35–62 CAS.
  27. R. G. Ciocca, J. Choi and A. M. Graham, Am. J. Surg., 1995, 170, 198–200 CrossRef CAS PubMed.
  28. E. P. Smith, J. Boyd, G. R. Frank, H. Takahashi, R. M. Cohen, B. Specker, T. C. Williams, D. B. Lubahn and K. S. Korach, N. Engl. J. Med., 1994, 331, 1056–1061 CrossRef CAS PubMed.
  29. W. L. McGuire, P. P. Carbone, M. E. Seard and G. C. Esche, in Estrogen Receptors in Human Breast Cancer, ed. W. L. McGuire, P. P. Carbone and E. P. Vollmer, Raven Press, New York, 1975, pp. 1–7 Search PubMed.
  30. N. E. Davidson and M. E. Lippman, Crit. Rev. Oncog., 1989, 1, 89–111 CAS.
  31. B. J. Furr and V. C. Jordan, Pharmacol. Ther., 1984, 25, 127–205 CrossRef CAS PubMed.
  32. M. W. MacNab, R. J. Tallarida and R. Joseph, Eur. J. Pharmacol., 1984, 103, 321–326 CrossRef CAS PubMed.
  33. R. Poulin, Y. Merand, D. Poirier, C. Lévesque, J. M. Dufour and F. Labrie, Breast Cancer Res. Treat., 1989, 14, 65–76 CrossRef CAS PubMed.
  34. C. Labrie, C. Martel, J. M. Dufour, C. Lévesque, Y. Mérand and F. Labrie, Cancer Res., 1992, 52, 610–615 CAS.
  35. S. Gauthier, J. Cloutier, Y. Dory and A. Favre, J. Enzyme Inhib. Med. Chem., 2005, 20, 165–177 CrossRef CAS PubMed.
  36. F. Labrie, C. Labrie, A. Bélanger, V. Giguère, J. Simard, Y. Mérand, S. Gauthier, V. Luu, B. Candas, C. Martel and S. Luo, Adv. Protein Chem., 2001, 56, 293–368 CrossRef CAS PubMed.
  37. F. Labrie, C. Labrie, A. Belanger, J. Simard, S. Gauthier and V. Luu, J. Steroid Biochem. Mol. Biol., 1999, 69, 51–84 CrossRef CAS PubMed.
  38. F. Labrie, J. Simard, C. Labrie and A. Bélanger, Ref. Gynecol. Obstet., 2001, 8, 331–336 Search PubMed.
  39. F. Labrie, C. Labrie, A. Belanger, J. Simard, V. Giguere and A. Tremblay, J. Steroid Biochem. Mol. Biol., 2001, 79, 213–225 CrossRef CAS PubMed.
  40. F. Labrie, P. Champagne, C. Labrie, J. Roy, J. Laverdière and L. Provencher, J. Clin. Oncol., 2004, 22, 864–871 CrossRef CAS PubMed.
  41. J. Roy, S. Couillard, M. Gutman and F. Labrie, Breast Cancer Res. Treat., 2003, 81, 223–229 CrossRef CAS PubMed.
  42. S. Luo, M. Stojanovic, C. Labrie and F. Labrie, Int. J. Cancer, 1997, 73, 580–586 CrossRef CAS PubMed.
  43. S. Gauthier, B. Caron, J. Cloutier, Y. L. Dory, A. Favre, D. Larouche, J. Mailhot, C. Ouellet, A. Schwerdtfeger, G. Leblanc, C. Martel, J. Simard, Y. Mérand, A. Bélanger, C. Labrie and F. Labrie, J. Med. Chem., 1997, 40, 2117–2122 CrossRef CAS PubMed.
  44. F. Labrie, C. Labrie, A. Bélanger, J. Simard, S. Gauthier, V. LuuThe, Y. Mérand, V. Giguère, B. Candas, S. Luo, C. Martel, S. M. Singh, M. Fournier, A. Coquet, V. Richard, R. Charbonneau, G. Charpenet, A. Tremblay, G. Tremblay, L. Cusan and R. Veilleux, J. Steroid Biochem. Mol. Biol., 1999, 69, 51–84 CrossRef CAS PubMed.
  45. F. Labrie, C. Labrie, A. Bélanger, J. Simard, V. Giguère, A. Tremblay and G. Tremblay, J. Steroid Biochem. Mol. Biol., 2002, 79, 213–225 CrossRef.
  46. S. Gupta, N. Kumar, S. Kumar, R. Dudhe and P. K. Sharma, International Journal of Therapeutic Applications, 2012, 7, 1–8 Search PubMed.
  47. H. Nakagawa, K. Tsuta, K. Kiuchi, H. Senzaki, K. Tanaka, K. Hioki and A. Tsubura, Carcinogenesis, 2001, 22, 891–897 CrossRef CAS PubMed.
  48. V. Alapati, M. N. Noolvi, S. N. Manjula, K. J. Pallavi, H. M. Patel, B. S. Tippeswamy and S. V. Satyanarayana, Eur. Rev. Med. Pharmacol. Sci., 2012, 16, 1753–1764 CAS.

Footnote

Electronic supplementary information (ESI) available. See DOI: 10.1039/c6ra14428d

This journal is © The Royal Society of Chemistry 2016