Enlightening surface plasmon resonance effect of metal nanoparticles for practical spectroscopic application
Jayasmita Jana
a,
Mainak Ganguly
b and
Tarasankar Pal
*a
aDepartment of Chemistry, Indian Institute of Technology, Kharagpur-721302, India. E-mail: tpal@chem.iitkgp.ernet.in
bDepartment of Chemistry, Furman University, Greenville, South Carolina-29613, USA
First published on 26th August 2016
Abstract
Surface plasmon resonance (SPR) is the manifestation of a resonance effect due to the interaction of conduction electrons of metal nanoparticles with incident photons. The interaction relies on the size and shape of the metal nanoparticles and on the nature and composition of the dispersion medium. By understanding the mechanistic aspects of the interaction of altered nanoparticle morphologies together with the associated medium effect, a new technology has been developed for careful spectroscopic monitoring. Each change can be followed by various spectroscopic techniques, which lead to sensing applications and imaging events. From successful SPR band monitoring through spectroscopy, new optoelectronic technology and sensors, including color sensors and sensor devices, have been developed. In this review, we discuss the important role of SPR and its efficacy to heighten practical spectroscopic applications.
1. Introduction
A particle may be defined as a small unit of matter that represents the total unit with respect to bulk material properties. Particles can be classified into three classes – (a) coarse particles, (b) fine particles and (c) ultrafine particles or nanoparticles (NPs). Here, we confine our discussion to metal nanoparticles. A NP is an assembly of molecules or atoms bound together in a diameter or size in the range of 1–100 nm in at least one direction, and it does not matter if they are supported on a large solid, liquid or gaseous medium.1 More precisely, a metal particle with a diameter ≤ 2 nm is called a ‘nanocluster’ of metal, and for a diameter > 2 nm, the term is ‘nanocrystal’.2 As the particle size decreases, the optical, electrical, electronic, fluorescence2 properties etc. are altered. There are two types of size effects for a metal NP, (a) extrinsic size effect and (b) intrinsic size effect. For larger particles, the optical functions can be explained by applying the theory of electrodynamics to bulk optical constants. This is called the extrinsic size effect. The intrinsic size effect is more important as it accounts for the specific changes relating to the volume and surface property.1 It deals with the size and geometry dependent properties like the ionization potential, chemical reactivity, binding energy, crystallographic structure, optical property and melting temperature of metal clusters in the experimental field. With the increase in the size of the nanoparticles, the energy levels of the discrete bands overlap and form a continuum of a solid state metal band structure. Confinement of surface electrons in the broken lattice sites leads to the formation of a discrete set of bands, which is often called the quantum size effect of nanostructures. The NPs show surface dependent properties as they have a higher surface area compared to bulk materials. Their surface area to volume ratio is much higher as the division of a substance into smaller fragments increases the surface area. When a metal NP experiences an electric field, polarization of a loosely bound electronic cloud occurs upon stimulation by the incident light beam. This results in a charge separation. Hence, a linear restoring force is exerted by the positively charged nuclei. As a consequence, collective, in-phase3 oscillations of the valence electrons occur on the solid material surface. This is the surface plasmon (SP) phenomenon. When the frequency of the photon matches the natural frequency of the metallic electron oscillation against the restoring force of the positive nuclei, the resonance condition is established provided the metal possesses a negative real and small positive imaginary dielectric constant. Under this condition, surface plasmon resonance (SPR) is observed.1 In the nanometre dimension, the nature of the surface plasmon is classified into two classes, localized and propagating plasmon. In the first case, the collective coherent electronic oscillation is confined at the surface, constituting an electronic field around the particle. It is denoted as localized surface plasmon resonance (LSPR).1,4 This is a three dimensional plasmon resonance generated by direct interaction between light and electrons in the conduction band of the metal. In this case, the wavelength of the incident light is much longer than the dimension of the interacting NP.4 In the second case, the surface charge oscillations couple naturally with the electromagnetic waves or incident photons and propagate at the boundary of the metal and dielectric. These are called surface plasmon polaritons (SPP).5 This is strictly confined to two dimensional space.6 As SPP does not couple with light illumination at a flat metal–vacuum interface, the energy coupling is achieved using gratings or prism matching schemes.5 However, propagation of SPP suffers from damping, which becomes a key issue for its application in sensors, nanocircuits and plasmonic lasers.7 Fig. 1 schematically represents LSPR and SPP. Both SPR and LSPR have their own characteristics. The propagating electromagnetic waves are transverse in nature. They are denoted as surface plasmon waves (SPW).5 The SPWs can be of a radiative or nonradiative nature.8 The radiative SPWs are classified under an intrinsic wave mode by Romanov and Fuchs–Kliewer. The coupling occurs with plane electromagnetic waves and gives rise to certain optical phenomenon like transition radiation and plasma resonance absorption.7 Nonradiative SPWs are denoted as a solution of Maxwell's relation. Nonradiative SPWs consist of evanescent waves, so they cannot emit light. Otto8 has investigated the nature of nonradiative SPWs by using silver metal film and concluded that the excitation and nature of SPWs can be described by applying the extended Fresnel equation. Sometimes the SPR is referred to as “dipole particle plasmon resonance” to differentiate the plasmon excitations occurring in bulk metal surfaces.1 It is important to note that plasmons can exist in bulk and at the surface of a large lump of material also.1 However, the mismatch between the plasmon dispersion relationship and that of the photon is the reason why the plasmons cannot be excited by ordinary light. The special characteristic of the small particle is that the ordinary visible light is enough to cause the plasmonic oscillation. In a small cluster, the surface and bulk plasmons couple and produce varied charge densities everywhere on the NP. It is worth mentioning that a multipolar plasmon also exists for individual NPs, although the main difference between a multipolar plasmon and dipolar plasmon is the shape of the surface charge distribution on the NP surface.1 SPR can be tuned in a wide range of wavelengths depending on the nanostructure. This controls the applications of SPR. When LSPR is tuned into the near-infrared region for nanorods or nanoshells, in vivo imaging and rehabilitation can done and is used in cancer therapy. For such medical applications, gold NPs are preferentially chosen. Actually, the coinage metal NPs [gold (Au), silver (Ag) and copper (Cu)]2 become more relevant than the other transition metal NPs because these free-electron-like metals possess much better SPR properties. They exhibit strong absorption in the visible and near infrared region resulting in the excitation of a large electric field at the surface of the NPs.9 Even the presence of any noble metal in the multifunctional composite core–shell NP improves the use of composite material in NP-based diagnostic and therapeutic applications. The plasmon resonance of such materials can be tuned by a change in the ratio of the core radius and the thickness of the shell.10 Initially, nanospheres were used, but now other nonspherical nanostructures, such as nanorods, nanoshells, nanostars, nanowires, nanorings, etc., are also fabricated by different lithographic techniques to overcome the lacunae of spherical particles. The unusual color in those NPs is explained by the Mie theory and Mie–Gans theory. Some spectroscopic and optical properties, such as surface enhanced Raman scattering, fluorescence, catalysis, linear and nonlinear optical behaviours, are optimised by tuning the SPR present in the NPs. Moreover, the SPR and precisely LSPR based sensing techniques, including biosensing, chemical sensing, pH sensing etc., have become more powerful, accurate, selective and sensitive. The sensitivity of a sensor is highly dependent on the excited electric field. With the increase in the electric field, a SPR sensor becomes more sensitive towards the change in its surrounding medium.9 In recent times, medical science, food technology and environment science have reached a new height of improvisation with the help of plasmonic materials. The world of plasmonics11 has utilized the special surface property of NPs to fabricate devices for miniaturization to help the advancement of our civilization. In this review, we will show how the SPR of NPs controls their use in different practical fields.2. Metal nanoparticles at work
Nanoparticles (NPs) are very important in biomedical, electronic, optical and technical fields. They actually act as a bridge between bulk materials and atomic or molecular structures. Metal nanoparticles (MNPs) are different from bulk metals, although they are from same element. For example, an Au slab is yellow in color, a conductor, and has a high melting point; whereas the color of gold NPs (AuNP) varies from red to purple with particle size, and they are semiconducting in nature with a much lower melting point. AuNPs have already been explored as excellent catalysts, sensors, probes for imaging and SERS imaging under different conditions. NPs show size dependent optical, chemical and electronic properties.1 However, these properties can be controlled by varying the synthesis conditions. Generally, metals with loosely bound electrons at the valence orbital show such unique properties. This is the result of SPR, which benefits nanotechnology. Thus, the SPR effect is one of the main reasons for the special properties of MNPs.3. SPR behind the properties of metal nanoparticles
3.1. Plasmonics
For NPs, the light can be concentrated and manipulated by objects that are significantly smaller than its wavelength due to the presence of SPR. Also, the plasmonic nanostructures possess several unique properties, such as a large electromagnetic field enhancement, high photothermal conversion efficiency, and rich spectral response. These properties empower them with huge potential for a variety of applications, ranging from clinical therapy and diagnostics to optoelectronic control. The research field that explores the possibilities of this area is known as ‘nanoplasmonics’.11By exploiting the plasmonic properties of nanostructure materials, different devices can be designed that are easy to use, portable and effective for daily life applications. One device is photovoltaic cells where plasmonic design based approaches can be used to improve absorption in photovoltaic devices, permitting a considerable reduction in the physical thickness of the solar photovoltaic absorber layers and yielding new options for solar-cell design.12 The efficiency of single-junction, planar, thin-film solar cells can be improved by plasmonic coupling and scattering. Other solar cells need increased light confinement and scattering from metal nanostructures. One example is plasmonic ‘tandem’ geometries, in which semiconductors with different band gaps are stacked on top of each other and separated by a metal contact layer with a plasmonic nanostructure that couples different spectral bands in the solar spectrum into the corresponding semiconductor layer.13 Coupling of sunlight into SPPs could also solve the problem of light absorption in quantum-dot (QD) solar cells. In spite of the potential benefits of QDs from the flexibility in engineering the semiconductor band gap by particle size, effective light absorption requires thick QD layers, and carrier transportation causes problems. Recently, there was a report on CdSe QDs deposited on Ag film solar cells.14,15 Fig. 2 shows the design of some new plasmonic solar cells.
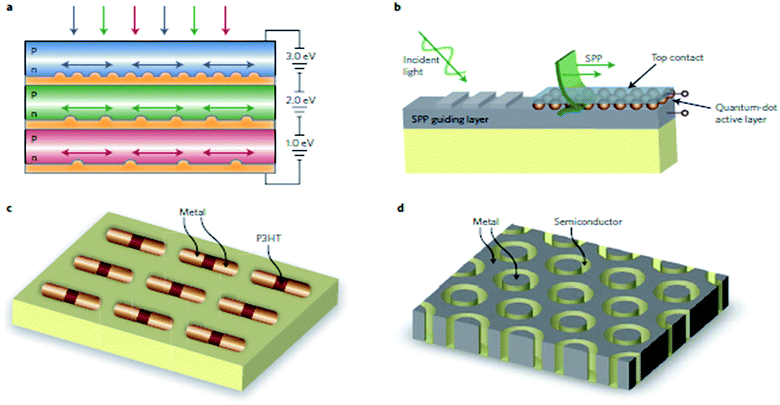 | ||
| Fig. 2 New plasmonic solar-cell designs. (a) Plasmonic tandem solar-cell geometry. Semiconductors with different bandgaps are stacked on top of each other, separated by a metal contact layer with a plasmonic nanostructure that couples different spectral bands of the solar spectrum into the corresponding semiconductor layer. (b) Plasmonic quantum-dot solar cell designed for enhanced photoabsorption in ultrathin quantum-dot layers mediated by coupling to SPP modes propagating in the plane of the interface between Ag and the quantum-dot layer. Semiconductor quantum dots are embedded in a metal/insulator/metal SPP waveguide. (c) Optical antenna array made from an axial heterostructure of metal and poly(3-hexylthiophene) (P3HT). Light is concentrated in the nanoscale gap between the two antenna arms, and photocurrent is generated in the P3HT semiconductor. (d) Array of coaxial holes in a metal film that support localized Fabry–Perot plasmon modes. The coaxial holes are filled with an inexpensive semiconductor with low minority carrier lifetime, and carriers are collected by the metal on the inner and outer sides of the coaxial structure. Field enhancements up to a factor of about 50 are possible and may serve to enhance nonlinear photovoltaic conversion effects. Reproduced from ref. 12 with permission from Nature Publishing Group. Copyright© 2010, Rights managed by Nature Publishing Group. | ||
Plasmonic lenses can manipulate the electromagnetic waves in the subwavelength scales and are important tools in nanooptics,16–19 sensing,20 and optoelectronic devices.21–23 The strong coupling between plasmons (both propagating and localized) and excitons in vacuum fields modifies the optical properties of both plasmonic metal objects and materials adsorbed on the objects.20 This coupling helps in the design of various sensors and devices. It has been reported that a metal film with circular and elliptical slit structures can act as a plasmonic lens focusing on surface plasmons.24 The excitation of the SPP, which concentrates the electromagnetic field on the focal points, can be achieved through a circular or elliptical slit. The focused SPP causes an electromagnetic near-field distribution that can be monitored by – (i) near-field scanning microscopy (NSOM) and (ii) plasmonic lithography. Fig. 3 shows the experimental setup for NSOM, plasmonic lithography and the near-field pattern for NOSM and plasmonic lithography. Generally, the NOSM tip is more sensitive towards the component of the electromagnetic field, which is parallel to the surface, but the photoresist (PR) tip is sensitive to the total electromagnetic field and can measure the total electromagnetic field in both parallel and perpendicular directions on the surface. The plasmonic lithography monitors the full plasmonic response, but the resist records only those regions with a local electromagnetic field intensity above the exposure threshold because the PR is unable to differentiate the changes in the energy levels above the threshold. Therefore, when resolving the fine details of near-field patterns containing a large intensity range or poor contrast of high to low intensity areas, both methods can provide desirable solutions. For photonic circuits used in high performance data processing nanodevices, the surface plasmon based circuits are used to overcome the size limitations.25
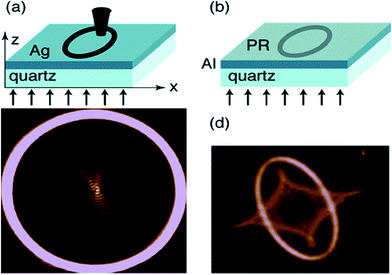 | ||
| Fig. 3 Experimental setup for (a) NSOM and (b) plasmonic lithography measurements for recording the near-field pattern for plasmonic lenses. (c) Near-field pattern for a 14 μm diameter circle cut into a 150 nm thick silver film recorded with NSOM. Polarization of incident light is indicated with an arrow. (d) Near-field pattern for an ellipse with a long axis of approximately 4 μm and a short axis of 2.5 μm cut into a 70 nm thick aluminum film recorded with plasmonic lithography. Reproduced from ref. 24 with permission from American Chemical Society. Copyright© 2005, American Chemical Society. | ||
Plasmonics allow for radically new modulator designs that are substantially more compact and power efficient compared to complementary metal oxide or semiconductor modulator designs. Long range SPP mode modulators show the pros of plasmonics – use of the same metal circuitry to perform simultaneous electrical and optical functions, and the metal stripes can guide an SPP signal and transmit electrical control pulses to switch the SPP signal and the use of high field confinement of SPPs near the metal to attain excellent mode overlap with the surrounding active media, inducing a boost in the nonlinear response. To avoid limitations due to large size, which gives rise to issues with dense integration and power consumption, a metal-dielectric-metal (MDM) waveguide geometry has been proposed. MDM waveguides do not show a cut-off, the metal to metal spacing can be very small (∼10 nm) and small swings in voltage can generate large swings in the electric field resulting in a strong nonlinear effect. MDM waves can overlap with the active medium. Since the nonlinear effects are strong, these devices are smaller than the characteristic decay wavelength of SPP so their performance is only slightly affected by unavoidable resistive losses in the metals. Such materials have been tested in switching configurations, electrical devices, etc.26
The integration of the plasmonic nanostructure with exciting electronic and dielectric devices can be achieved via mature-silicon-integrated-circuit technology like nanofabrication techniques. One of the emerging applications is plasmon enhanced photodetectors. Smaller sized photodetectors can have increased speed, decreased noise and reduced power consumption. However, achieving such a size for conversional photodetectors is quite difficult as lateral and vertical shrinkages are restricted by the diffraction limit and finite absorption depth of the semiconductors, respectively. In such a situation, plasmonic nanostructures are very useful as they can concentrate light both laterally and in the depth of a semiconductor material. Also, plasmonic waveguide-based detectors have drawn the attention of researchers.26 Metallic nanostructures work as a bridge between dielectric microphotonics and nanoscale electronics. Full utilization of the concentrating fields and subwavelength guiding for metallic nanostructures and high speed as well as high performance information processing for semiconductor electronic components is possible. Plasmonics eases the introduction of new functionality, including polarization, angle or wavelength selectivity.27
Recently, a report was published regarding the optical and dielectric properties of the carbon nanotube (CNT) reinforced polypropylene polymer nanocomposites (PP PNCs), especially with a negative permittivity. CNTs, possessing a low plasma frequency, can show negative permittivity when the test frequency is lower than the plasma frequency. Zhang et al.28 have fabricated PP/CNT to study the electrical conductivity property and the real permittivity of the nanocomposites. In this case, the band gap of the CNT and the processing temperature matters. At lower processing temperatures, CNT easily forms a network-like structure, resulting in a higher conductivity. They also serve as nucleating sites to promote crystallization of PP at a lower loading. For this composite system, the lower band gap of CNTs was associated with the stronger deformation of the polymer matrix at elevated processing temperatures. Such nanocomposites with negative permittivity can be used in cloaking, super lens, wave filters, and superconductors.28 Thus, plasmonics has given birth to useful technology, and the science behind this is enriched day by day.
3.2. Fluorescence spectrophotometry
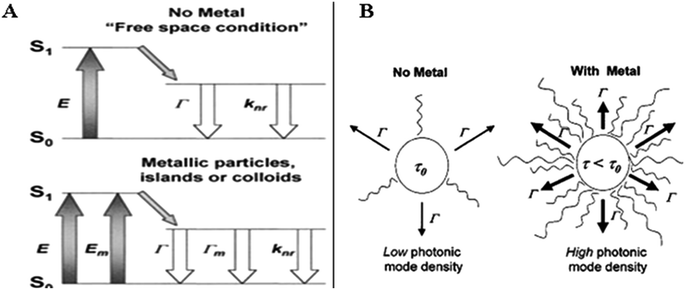
Fluorescence quantification is a sensitive spectroscopic technique that is used widely for recording various molecular events.29–31 The emission of light at a longer wavelength by an excited molecule provides lots of information about the molecule. The exceptionally high sensitivity of fluorescence spectroscopy compared to other common spectroscopic techniques is because of the high signal to noise ratio. The limit of detection (LOD) in this technique can easily be manipulated by changing the physical conditions of the fluorescing molecule.32 Fluorescent materials are widely used in sensing, optical imaging, cell imaging, optical device making, signalling, ink, pigment, drug delivery and biomarkers. In biological research, including single molecule detection, cellular imaging, gene profiling, proteomics, drug discovery and disease diagnostic, the fluorescence technique has become popular. Fluorescent markers are very efficient for labelling and cell imaging. However, this technique is applicable only for molecules with inherent fluorescence, which often suffers from two major drawbacks: weak fluorescence signal from a low concentration of fluorophores and low photostability of the molecular fluorophores.33 The quantum yield of the material can be improved by bringing foreign materials like electron rich metals near the fluorescing system. The enhancement of the fluorescence intensity of a weak fluorophore in conjugation with a metal surface is termed metal enhanced fluorescence (MEF). The term MEF was first introduced by Geddes in 2002.34 MNPs work as nanoantennas that frequently manipulate light and light–matter interactions at the nanoscale.35 MNPs possess SPR properties. The resonance condition, determined from absorption and scattering spectroscopy, depends on the morphology, size, and dielectric constants of both the metal and the adjacent material. With a change in the shape or size of the NP, the geometry of the surface alters, causing a shift in the electric field density on the metal surface. In the presence of a metal surface, the excitation as well as emission characteristics of the fluorophore can be changed in terms of modification in the molecular cross-section. It is well established that the nearby surface alters the “free space” condition of a fluorophore and follows the modified Maxwell's equation from their free space counterparts.34–38 This is clear from the Jablonski diagram (Fig. 4). When a fluorophore is excited from the ground state S0 to the first excited state S1, it may emit a photon at the rate of Γ. Then, a nonradiative decay at a rate of knr or a quenching process with a rate of kq after a time τ0 may occur. Then the quantum yield, Q0, and life time, τ0, will be:| Q0 = Γ/(Γ + kq + knr) | (1a) |
| τ0 = 1/(Γ + kq + knr) | (1b) |
However, when a MNP is present at a suitable distance from the fluorophore, the decay rate changes to (Γ + ΓM). (ΓM corresponds to the decay from MNP.) Then, an increase in quantum yield, QM, occurs along with a decrease in the lifetime, τM, as follows:
| QM = (Γ + ΓM)/(Γ + ΓM + kq + knr) | (2a) |
| τM = 1/(Γ + ΓM + kq + knr) | (2b) |
Conducting MNPs can manipulate free space conditions by7 altering the incident electric field on the fluorophore as well as changing the radiative decay.39–41 These effects can be elucidated through the variation in the photonic mode density. A large photonic density is associated with the radiative decay rates and increasing the number of pathways available to discharge the excited energy.34 Fig. 4 shows the photonic mode densities of a fluorophore in the absence and presence of a metal. In the absence of a metal, the fluorophore possesses a higher radiative life time (τ0) and lower photonic density; whereas in the presence of a metal, the radiative life time (τm) decreases and the photonic mode density enhances. A fluorophore is considered as an oscillating dipole, just like a radiating antenna. Proximate metal surfaces very often respond to the oscillating dipole, resulting in the modification of the emission rate and the spatial distribution of the radiated energy. Interactions between the metal surface and the incident light as well as the oscillating dipole of the fluorophore affect the electric field, which is sensed by a fluorophore. Besides, the oscillating dipoles of the fluorophores induce a field on the metal. Such interactions can manipulate the incident field on the fluorophore and the radiative decay rate. In short, two complementary effects are found in the literature42 in the context of MEF: (a) enhanced absorption assists enhanced emission (‘lightening rod effect’) and (b) surface plasmons can efficiently radiate coupled fluorescence. The emission directionality in the prism and its exceptional polarization properties imply that the radiation occurs from surface plasmons that are induced in the metal by the closely situated, excited fluorophores. However, the wavelength distribution of the emission matches accurately with the normal emission spectra. This phenomenon is called surface-plasmon-coupled emission (SPCE).43 The radiating plasmon (RP) model suggests the far-field radiation originated from scattering to be responsible for the observed fluorescence intensity.43 The extent of the enhancement lies in the geometry of the metallic nanostructures. The size and shape contribute to different surface plasmonic modes with a drastic enhancement of the fluorescence signals at “hotspots”.44 At a very close proximity (<20 nm), the lifetime of the fluorophore drops dramatically, and the emission intensity is strongly reduced. This quenching effect in the proximity of the MNPs has been attributed to lossy surface waves (LSWs), dissipated losses, ohmic losses, and such similar phenomena, all of which are examples of nonradiative dissipation of energy within metals.44 MEF can be enhanced by increasing the near-field around the fluorophore and emission efficiency through NP scattering and improvement in the radiative decay rate of close fluorophores along with a change in the fluorescence quantum yield and lifetime.45 Fluorescence measurements in bulk samples are very common where the solutions are typically transparent to the emitted radiation and isotropic emission of the fluorophore in the free space is observed in the far-field. An alteration of the refractive index is the main consequence of this. Free space spectral properties of the fluorophore are very minutely influenced by a change of the refractive index.34 To explain the huge change in the fluorescence near metallic surface, modifications of free space conditions of the fluorophore have come into the field. The intense narrow surface plasmon band (SPB) has provoked researchers to study Ag and Au NPs in the context of MEF. The free electrons present in the metal (d electrons in Ag and Au) freely travel through the material. As the mean free path in Au and Ag is 50 nm, the particles, smaller than this, show no scattering like the bulk. When the wavelength of light is much longer than the size of the NPs, it can establish a standing resonance condition.46
Lakowicz et al. considered the silver island film (SIF) as an interesting candidate for escalating the intensities and photostability of fluorophores bearing a low quantum yield.47 SIFs can cause quenching, increased rates of excitation, and/or increased quantum yields depending upon the mode of interaction with the fluorophore.34 Not only SIFs, but other various Ag surfaces, such as Ag colloids,48 Ag nanotriangles,49 Ag nanorods,50 and fractal-like Ag surfaces,51 are also found to be active in the context of metal enhanced fluorescence (MEF). The MEF for Ag can be explained in terms of the radiating plasmon model (RPM) (Fig. 5).52 An interesting report by Aslan et al.51 explains that metal enhanced fluorescence in solution has been found to be a potential sensing platform. Again, the Tb3+ complex of a salicylic acid-based, open-chain crown ether possesses an enhanced fluorescence in silver chloride collosol.53 A study by Gill et al.54 demonstrates that the dye–DNA composite becomes extremely fluorescent with Ag nanoaggregates. Not only Ag, but also Au and Cu are known to exhibit MEF. However, there are more reports on Ag enhanced fluorescence47–50,55 as Ag has more favourable imaginary components in the dielectric function than Au and Cu. The absorption cross section relies on the imaginary component of the metal, and it is higher for Cu than Au or Ag. So, the close-proximity of the fluorophore will cause mostly quenching by the copper nanoparticles (CuNPs). Again, Cu also has a scattering component responsible for the MEF effect.45 However, AuNPs can enhance or quench fluorescence depending on the fluorophore-particle separation distance, molecular dipole orientation with respect to particle surface and size of the NP.56–59 It is found that comparatively smaller (<30 nm) AuNPs quench the fluorescence emission due to the nonradiative transfer from the excited states of the luminophores to the AuNPs.57,58 The scattering efficiency of the NPs increased with particle size, resulting in improved fluorescence.56–60 Further confirmation of the scattering efficiency related phenomenon that larger aggregated colloids enhance the fluorescence to a larger extent than the smaller ones came from Lukomska et al.61
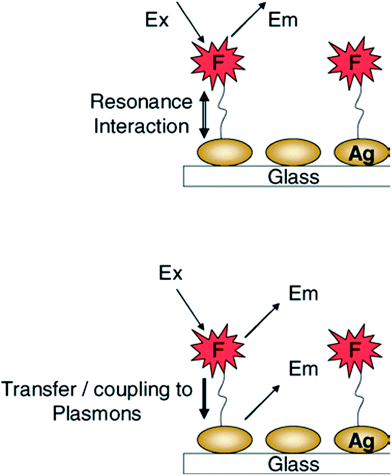 | ||
| Fig. 5 Early interpretation of metal-enhanced fluorescence whereby fluorophores undergo a radiative decay rate modification—Top, and—Bottom. Current thinking, the fluorescence emission is partially plasmon coupled and the system radiates. Reproduced from ref. 52 with permission from Springer Science + Business Media Inc. Copyright© 2005, Springer Science + Business Media Inc. | ||
Cu possesses a very large imaginary component of the dielectric constant value, i.e., more than twice that of noble metals in the wavelength range of 300 nm to 600 nm. Hence, it is expected that in this wavelength range CuNPs would have a tendency to quench the luminescence at a close proximity in relation to fluorophore, owing to greater ohmic losses.62 However, for large NPs (>100 nm) with a high aspect ratio, the increase of the coupling efficiency of the fluorescence emission to the far-field through NP scattering excels MEF. In this case, the effect of ohmic losses on MEF decreased, and less expensive metals such as Al and Cu, which are more lossy than Ag and Au, can be considered as promising candidates for fluorescence enhancement.63
Diehl et al.64 demonstrated that the cobalt complex of salen is a potential oxygen carrier. A thorough fluorescence study of both the ligands and their metal complexes revealed that salen-like ligands are potential fluorophores and can eventually become probe molecules.65 Liu et al.66 reported that Mn-salen is a promising probe molecule to detect traces of DNA in solution because of the prominent alteration of the fluorescence property of the molecule. They noticed a remarkable decrease in the fluorescence intensity for Mn-Schiff bases bound with DNA through a blue shift in the excitation and emission peaks. This observation relates to the observed hypochromic shift in the UV absorption spectra. Salicylideneaniline-based organogelator with a very high fluorescence quantum yield was synthesized by Chen et al.67 using the J-aggregation idea of the molecule and inhibition of intramolecular rotation in a gel state. Deda et al.68 reported the metal perturbed ligand centered state of a novel salen-like compound with 12 carbon atoms bridged between iminic nitrogen atoms. There are other reports where the fluorescence property of salen/salen derivatives and their metal complexes are exploited for the determination of trace amounts of useful and hazardous substances like Mg,69 H2O2, triacetone organic peroxides,70 cyanide71 etc. Aoki et al.72 determined aliphatic primary amines by flow injection fluorometry using beryllium-Schiff base complexes. Recently an example of SPR induced Er(III) photoluminescence enhancement in tellurite glass was reported by Fares et al.73
The huge amount of the enhanced fluorescence by noble metals can be successfully utilized in sensing, bioimaging, devices,47 biomedical and biophysical applications.73 Ganguly et al. successfully utilized Ag enhanced fluorescence in the sensing of cysteine (LOD, limit of detection: 50 nM and linear detection range: 0–10 μM),45 Cu(II) (LOD: 50 nM and linear detection range: 7 μM to 50 nM),45 dopamine (LOD: 16 nM and linear detection range: 0–300 nM.),74 and Hg(II)74 through fluorescence ‘Turn On/Turn Off’ phenomenon. Moal et al.33 applied MEF in cell biology for cell imaging. Aslan et al.39 developed a simple, easy and cheap MEF based on an RNA detection technique with a lower detection limit down to 50 fmol (S/N > 20).
3.3. Sensor
Technically, a SPR sensor is a thin-film refractometer that measures changes in the refractive index occurring at the surface of a metal film of a metal that supports SPR.75 A SPW propagates along the metal film when excited by a light. Its evanescent field probes the medium (sample) in contact with the metal film. A change in the refractive index of the dielectric changes the propagation constant of the surface plasmon, which in turn changes the characteristics of the light wave coupled to the surface plasmon (e.g., coupling angle, coupling wavelength, intensity, and phase).
 | (3) |
The mathematical expression of dsp is:
 | (4) |
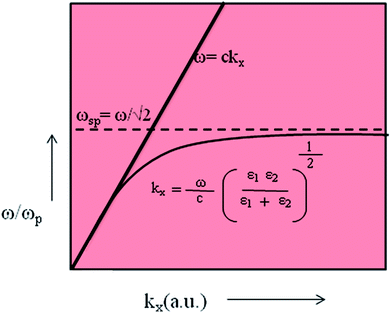
In eqn (4), ε′m, ε′′m are the real and imaginary parts of the dielectric function, εm = ε′m + iε′′m, c is the velocity of light and ‘ω’ is the optical excitation frequency. Ag metal has the lowest loss in propagation in visible light, however, the loss increases moving towards the near IR region.19 The propagation length is related to the exponential damping of the electric field amplitude due to ohmic losses of the electrons participating in the SPP (damping); it finally results in a heating of the metal surface. Again, dsp depends on the dielectric function of the metal and wavelength of the incident photon. Damping can occur in a radiative way (emission of an electromagnetic wave from the metallic surface) or in a nonradiative way (interaction with the surrounding medium). Dispersion relation is another important feature of SPP. The dispersion relation is the relationship between the wave vector (k) and angular frequency (ω).
For a free electron model of an electron gas, without attenuation, the metallic dielectric constant is
 | (5) |
(a) Grating coupling. Wood was the first to observe SP excitation by grating coupling (1902). Later in 1967, Teng and Stern used this for mapping the dispersion curve. The importance of the dispersion relation is that it helps to understand the coupling of light and SP on the metal surface. A wide range, strong absorption can be obtained from deep gratings.77 A rough surface can be considered as the superposition of many gratings of different periodicities. The configuration can be represented as in Fig. 7. Certain sensing techniques adopt grating coupling. Those occur mostly in cases where substrates are deposited on rough metallic surfaces.
 | ||
| Fig. 7 Schematic of (A) grating configuration, (B) Kretschmann configuration, (C) Otto configuration (not to be scaled). | ||
(b) Kretschmann coupling. In 1968, Kretschmann–Raether gave a geometry to excite SP on a smooth surface.78 The arrangement is schematically represented in Fig. 7. As there is no air gap (or a negligible gap), the evanescent field can directly penetrate the metal surface to excite the surface plasmon even at a thickness of 45 nm. The Kretschmann configuration is applied in sensing performances, mostly for biosensing techniques.
(c) Otto coupling. In 1968, Otto represented another process of excitation of a surface plasmon on a smooth surface.8 Fig. 7 represents that configuration. If the angle of incidence (θ) is greater than the critical angle, the evanescent field can penetrate into the space between the air and the prism. The SPP couples with the electromagnetic field on the metal surface, and the momentum of the evanescent field increases to ksp. Now, the x-component of the wave propagation constant of the evanescent wave at the metal dielectric interface will be:
 | (6) |
This is an attenuated total reflection (ATR) method. This process needs light with wavelength in IR region since the diameter of the dust particles is much larger than the space between the prism and metal film.79 The coupling depends on the air gap. The Otto configuration is really helpful in the study of single crystal metal surfaces and adsorption phenomenon on them.80 One more advantage of these techniques is that they are temperature independent.
Both Kretschmann and Otto coupling are classified under prism coupling.
On the basis of which characteristic of the light wave modulated by a surface SP is measured, SPR sensors are classified as sensors with angular, wavelength, intensity, or phase modulation. For SPR sensors with angular and wavelength modulators, the surface excitation is attained by monochromatic light and polychromatic light, respectively.75 However, in both cases, the strongest coupling is taken as the sensor output.
SPR biosensors can be used for the detection of analytes of all types of shapes.
(A) Small analyte. Application in the field of environmental protection, food safety, medicine etc. Atrazine (lowest detection limit 1.92 × 10⁻¹⁴ M),87 anti-simazine IgG antibodies (detection limit 0.16 μg L−1) or anti-simazine Fab fragments (detection limit 0.11 μg L−1),88,89 morphine [detection limit 0.1–10 ng cm−3 (ppb)],90 streptomycin (detection limit 4.1 ng mL−1),91 and adenosine (detection limit 0.21 pM)92 are certain examples of this case.
(B) Medium analyte. Applications related to the food safety field. Certain examples are E. coil enterotoxin in aqueous solution (detection limit 6 μg mL−1)93 and staphylococcal enterotoxin B in milk and meat (detection limit 1–10 ng mL−1).94
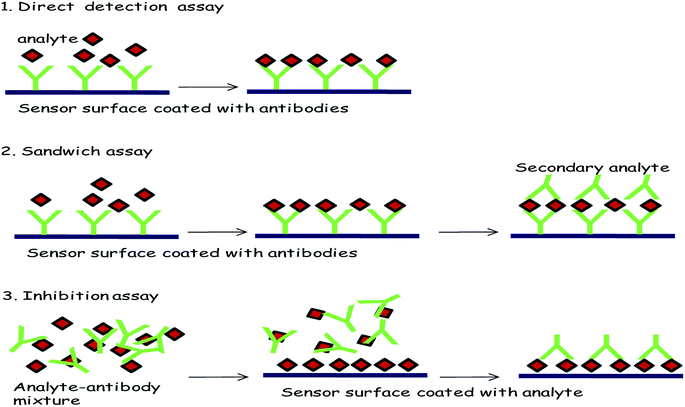
(C) Large analyte. This includes bacterial pathogens. Examples include E. coli, Salmonella enteritidis, and Listeria monocytogenes. For E. coli, Fratamico et al. used polyclonal secondary antibodies in a sandwich assay method (lowest detection limit is 5 × 10⁷ CFU mL−1).95 Koubova et al.96 used monoclonal antibodies for the detection of Salmonella enteritidis, and Listeria monocytogenes with a detection limit 106 CFU mL−1. However, in all the cases, the limits of the biosensing techniques are ultimately determined by two factors: the normal constraints of nonspecific adsorption coupled with the maximum rate of the primary antibody–antigen combination and intrinsic sensing of the SPR technique. The most used format for these procedures is schematically represented in Fig. 8.
Fibre optics-based SPR are now available for the quantitative detection of DNA hybridization and DNA–protein interactions,97 aptamer (oligonucleoside or peptide molecules which can bind with specific target molecule)-based biosensor for detection of HIV-1 Tat protein,98 and S-adenosylhomocysteine99 monocyte chemo-attractant protein-1 (MCP-1).100 Using an NP array sensing mechanism, a single Ag NP can detect streptavidin and other small molecule adsorbates with a detection limit of less than 1000 molecules.101 Recently Lee et al.102 designed a plasmonic sensor to utilize the Fano resonance of Au with an ultrahigh intensity sensitivity up to 48![[thin space (1/6-em)]](https://www.rsc.org/images/entities/char_2009.gif) 117% RIU−1 (Fig. 9). Tokel et al.103 designed a portable, multiplex, inexpensive microfluidic-integrated surface SPR platform that detects and quantifies the bacteria, E. coli and Staphylococcus aureus, rapidly. This enables the detection of E. coli at concentrations ranging from 105 to 3.23107 CFU mL−1 in phosphate buffered saline and peritoneal dialysis fluids.
117% RIU−1 (Fig. 9). Tokel et al.103 designed a portable, multiplex, inexpensive microfluidic-integrated surface SPR platform that detects and quantifies the bacteria, E. coli and Staphylococcus aureus, rapidly. This enables the detection of E. coli at concentrations ranging from 105 to 3.23107 CFU mL−1 in phosphate buffered saline and peritoneal dialysis fluids.
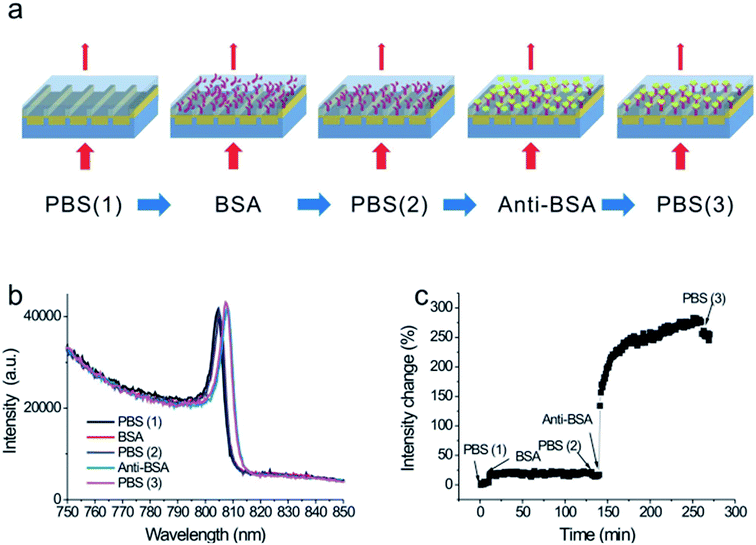 | ||
| Fig. 9 Biosensing using the Fano resonance in 600 nm-period capped gold nanoslits. (a) A process flowchart for the interactions between BSA and anti-BSA. (b) The measured intensity spectra for different surface conditions. Significant changes in wavelength shift were observed when BSA and anti-BSA were bound on the gold surface. (c) The normalized intensity change of as a function of the interaction time for protein–protein interactions. The BSA resulted in an intensity change of 13%. The anti-BSA caused an intensity change of 237%. Reproduced from ref. 102 with permission from Nature Publishing Group. Copyright© 2015, Rights managed by Nature Publishing Group. | ||
SPR is also used in medical diagnostics for human hepatitis B (hHBV) with a detection limit comparable to the commercially available ELISA (enzyme-linked immunosorbent assay) kit.104 An immunoassay is a biochemical test that measures the presence or concentration of a macromolecule in a solution through the use of an antibody or immunoglobulin. The first SPR immunoassay was proposed in 1983 by Liedberg, Nylander, and Lundstrom of the Linköping Institute of Technology (Sweden). They used the assay of human IgG adsorbed on a 600 Å Ag film to detect anti-human IgG in aqueous solutions.105 As the SPR immune assay is label free, no labelling molecule is required to detect an analyte. This makes it more advance than other immune assays such as ELISA.106 Currently, the interaction between the AuNP–antibody conjugates and their antigens has generated a great interest in preparing bio-devices for recognition of proteins. The great sensitivity of the surface plasmon band with AuNP adsorption led to their use in bioassay application.107 The AuNP–protein conjugate formation may involve direct binding between the antigen–AuNP bioconjugate to an antibody modified surface or a secondary AuNP antigen interaction on an exposed antibody derived surface to free the antigen. This causes antibody detection. An immunosensor has been made using the SPP sensitivity to change the dielectric permittivity of a dielectric-coated metallic grating.108 In this case, the sensitizing immunological molecules were immobilized on the Ag or Au holographic diffraction grating. Then, the real time measurement was done by binding complementary binding components such as animal serum. The changes in the reflectivity on the grating resulting from alterations in the conditions necessary for optical SPP excitations cause the detection.77,108
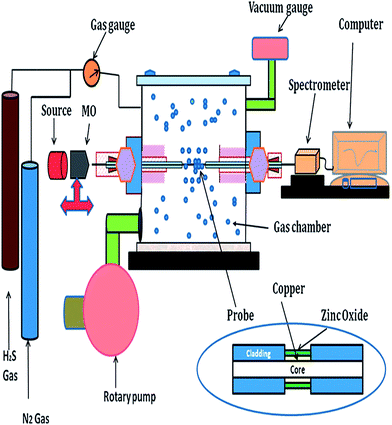 | ||
| Fig. 10 Schematic of the experimental gas sensing setup. Reproduced from ref. 117 with permission from Royal Society of Chemistry. Copyright© 2013, Royal Society of Chemistry. | ||
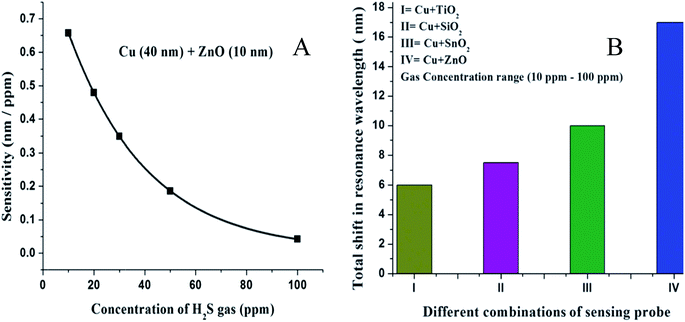 | ||
| Fig. 11 (A) Variation of the sensitivity of the sensor with the concentration of H2S gas of the SPR probe with layers of copper (40 nm) and zinc oxide (10 nm). (B) Shift in the resonance wavelength for a 10–100 ppm concentration range of H2S gas for the SPR probes with coatings of different metal oxides over the copper layer. Reproduced from ref. 117 with permission from Royal Society of Chemistry. Copyright© 2013, Royal Society of Chemistry. | ||
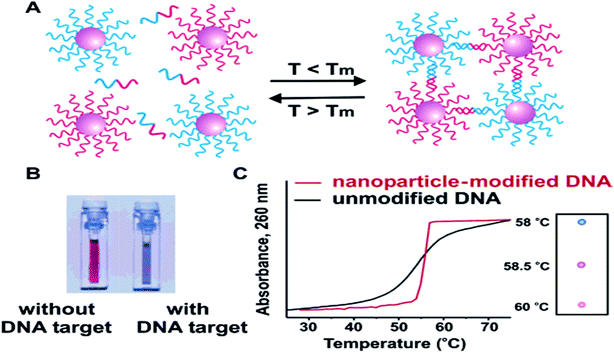 | ||
| Fig. 12 In the presence of complementary target DNA, oligonucleotide-functionalized gold nanoparticles will aggregate (A), resulting in a change of solution color from red to blue (B). The aggregation process can be monitored using UV-vis spectroscopy or simply by spotting the solution on a silica support (C). Reproduced from ref. 121 with permission from American Chemical Society. Copyright© 2005, American Chemical Society. | ||
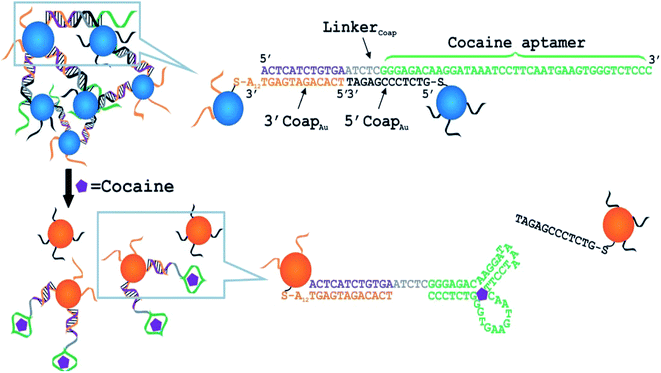 | ||
| Fig. 13 Schematic of colorimetric detection of adenosine. The DNA sequences are shown in the right side of the figure. The A12 in 3′AdapAu denotes a 12-mer polyadenine chain. In a control experiment, a mutated linker with the two mutations shown by the two short black arrows was used. Note: the drawing is not to scale. Reproduced from ref. 126 with permission from WILEY-VCH Verlag GmbH & Co. KGaA, Welnhelm. Copyright© 2006, WILEY-VCH Verlag GmbH & Co. KGaA, Welnhelm. | ||
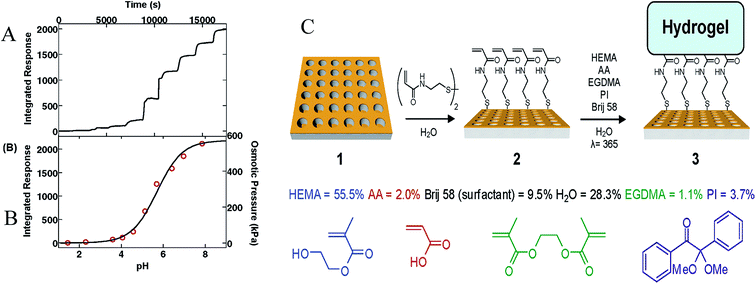 | ||
| Fig. 14 (A) Integrated response of crystal 3 upon exposure to solutions at pH 1.44, 2.31, 3.59, 4.08, 4.57, 5.13, 5.66, 6.42, 6.95, and 7.86 in that order for 30 min each. (B) Average integrated response after equilibrating for 30 min at each particular pH (left) along with the calculated osmotic pressure experienced by the gel network at each pH (right). The best fit line to these data (black) yields a hydrogel pKa of 5.70. (C) Fabrication of a Surface-Bound pH Responsive Hydrogel on a Plasmonic Crystal. Reproduced from ref. 131 with permission from American Chemical Society. Copyright© 2007, American Chemical Society. | ||
3.4. Imaging
Surface plasmon resonance imaging (SPRi), also known as SPR microscopy,133 was first introduced by Rothenhäusler and Knoll in 1988.134 Thereafter, SPRi has been proposed to explore interactions with biomolecules arrayed onto chemically modified metal surfaces. SPRi enables biomolecular interactions to be monitored in real time without labels, as in classical SPR sensing. However, the use of a CCD camera for signal detection allows simultaneous analysis of many interactions (up to hundreds) by recording both sensorgrams (i.e., resonance signal vs. time) and SPR images of the arrayed surface. These facilities have a significant impact in high-throughput analysis. Actually, SPRi is another version of SPR mediated biosensing. In SPR, the intensity modulation in the prism coupling is utilized. Here, a 2D detector is used to record the differences in the intensity of the reflected light (expressed as the percent reflectivity, % R) at a fixed angle and wavelength.135 SPRi has proven its importance as it can detect parallel interaction events in real time from the spatially resolved, functionalized SPRi metallic surface.136 Thus, the kinetics of binding can be monitored.Ito et al.137 have reported DNA sequence detection directly in genomic samples, bypassing the polymerase chain reaction (PCR)-based amplification procedure, using SPRi. There are other reports of DNA detection by SPRi using different metallic surfaces.138–142 Seefeld et al.143 reported the detection of protein biomarkers through SPRi. They used microarrays of RNA aptamers fabricated in one step by multiplexed enzymatic synthesis on Au thin films. For nucleic acid detection, SPRi plays an important role by allowing for the study of the membrane kinetics.144 Joshi et al.145 studied the antifouling properties of the zwitterionic polymer surface by SPRi. They used a nano-structured Au chip for this purpose. They showed that the SPRi based studies are far better than SPR based studies. Fig. 15 shows the difference between the SPRi and SPR set up.
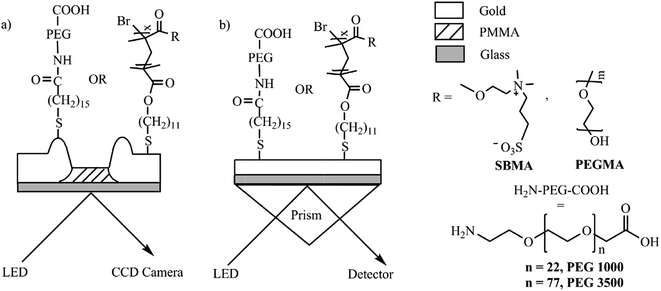 | ||
| Fig. 15 Schematic of (a) prototype imaging SPR setup with nanostructured gold as sensor surface and (b) conventional SPR setup with flat gold as sensor surface, and the antifouling chemistries used. Reproduced from ref. 145 with permission from Elsevier B. V. Copyright© 2014, Elsevier B. V. All rights reserved. | ||
3.5. Medicinal chemistry, food chemistry and environmental chemistry
Medical science is another area where SPR is influential, especially for the treatment of cancer and other dangerous diseases. AuNP conjugated antibodies can target diseased cells without affecting the healthy cells.146,147 The treatment process needs an infra-red (IR) LASER that has a deep penetrating power. AuNPs of different shapes (Mostly nanorods, a core–shell structure with silica at the core can also be used, but there are certain disadvantages with silica.) have surface plasmon absorption near this region. Then, a lower LASER energy is needed. That will reduce the side-effects for the LASER treatment of cancer cells. The LSPR sensor used in medical diagnostic technology is simple, fast and low-cost. The LSPR sensor is based on a simple optical extinction measurement, so it may encounter problems in biological systems, e.g., urine, blood, etc. In those cases, the main challenge is to make the sensor sensitive towards media that are not transparent. This problem can be resolved by using glass substrates that are used in reflection geometry.148 Hou et al.149 have used Au nanorods (GNR) coated with biocompatible polyaniline (PANI) as a stable and highly efficient photothermal agent for cancer cell ablation. Fine-tuning of the LSPR response of the GNR/PANI core–shell NPs, via a thickness-controlled coating of the PANI nanoshells, optimizes the agent's photothermal conversion efficiency. They showed that after exposure to a continuous NIR laser at 808 nm for ∼5 min, the cancer cells were efficiently ablated with a very low laser flux of 0.6 W cm−2. Fig. 16 shows the treated cells.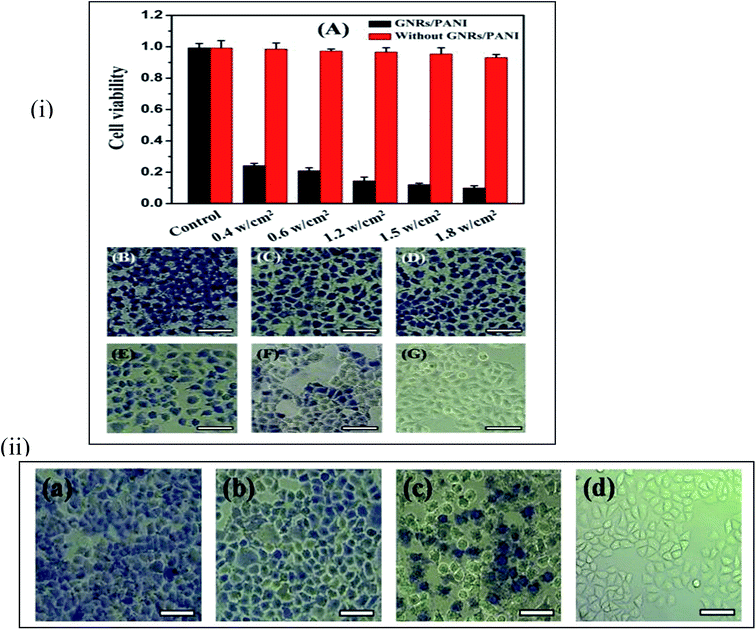 | ||
| Fig. 16 (i) (A) Cytotoxicity assays for the HeLa cells in the presence of the GNR–PANI nanoparticles under different laser power density. (B–F) Typical optical microscopy images of HeLa cells treated with same GNR–PANI nanoparticle concentration (18 mgAu kg1) and NIR diode 808 nm laser irradiation at 1.8, 1.5, 1.2, 0.6, and 0.4 W cm2, respectively, each for 5 min. (G) An optical microscopy image of the control HeLa cells without NIR laser irradiation. All the cells were stained with trypan blue dye to examine the level of cell damage. Scale bar: 50 μm. (ii) Optical microscopy images of the HeLa cells treated with different concentrations of the GNR–PANI solution (a) 9 mgAu kg1, (b) 4.5 mgAu kg1, (c) 2.25 mgAu kg1, and (d) 0 mgAu kg1. All of the cells were stained with trypan blue dye after NIR laser treatment. Scale bar: 50 μm. Reproduced from ref. 149 with permission from Royal Society of Chemistry. Copyright© 2015, Royal Society of Chemistry. | ||
SPR is actively used in food chemistry. SPR-based biosensors have been utilized for detection of various analytes (folic acid, biotin, antibiotics, etc.) in different food products to prevent health hazards.150 Wang et al.151 reported the detection of Rhodamine B at trace levels to reduce cancer factors. There are several other reports of detection of melamine, bovine serum albumin and other hazardous materials in different food materials, and some of those are mentioned in the previous sections.
SPR is also used in controlling environment pollution by the detection of hazardous materials. Monkawa et al.152 used SPR based on a calix(4)arene self-assembled monolayer for the detection of volatile organic materials. Benounis et al.153 utilized SPR in cadmium ion sensing. Tabassum et al.154 used SPR of a ZnO redistributed polyaniline for the detection of water hardness.
3.6. Catalysis
There are many examples of surface plasmon enhanced photo-catalysis. The phenomenon of the improved photo-catalytic activity in many reactions can be explained by two theories: (i) charge transfer mechanism and (ii) local electric field enhancement.155 The charge transfer mechanism was explained by Tatsuma's group156 upon examining the photocatalytic activity of Ag/Au–TiO2 on the oxidation of alcohol. In this case, the photoexcited electrons of the Au NPs were transferred to the conduction band of the adjacent TiO2 sol upon excitation with visible light. The schematic diagram is illustrated in Fig. 17. The effectiveness of the proposed mechanism was checked by measuring the decrease in the absorption of the AuNPs. This mechanism has been applied to other reactions such as splitting of water molecules in the visible range of irradiation in the presence of an Au–TiO2 catalyst,157 photocatalytic decomposition of methyl orange in the presence of Au/AgCl/TiO2 nanotube arrays,158 and several other reactions. This plasmonic catalytic property also depends on the size of the NPs.158 The irradiating MNPs can generate intense local electric fields on the surface of the NPs in the range of their plasmon resonance frequency range. The generation of plasmonic ‘hot spots’ increases the electron–hole pair formation compared to incident electromagnetic radiation. This causes an enhancement in the photoinduced charge and catalytic activity.156 There are certain examples of this mechanism, and Lu et al. found a 2–3 times enhancement in the activity of AuNP/TiO2 for light harvesting.159 Some well-known photocatalysts that use the plasmonic oscillation are Si-doped hematite (α-Fe2O3) for water splitting (Si doped Fe2O3)160 and methane preparation,156 an Ag core covered with SiO2 and embedded on TiO2 for photocatalytic decomposition of methylene blue,161 and carbon quantum dots/Ag3PO4 complex.162 The Pt thin film can act as a good photocatalyst for the oxidation reaction of the ammonium cation because of plasmon heat. In this case, the plasmonic energy conversion to heat causes catalytic activity.163 The photocatalytic water splitting represents a promising way to produce renewable hydrogen fuel from solar energy.164 For water splitting, the ultra-thin semiconductor electrodes are of interest. This is because the optical absorption occurs in the region of photogenerated charge carrier contribution to the chemical reactions on the surface. Therefore, more photons are absorbed within the thin film. An array of nanopillars coated with a thin-film iron oxide photoanode is used to enhance the photocurrent. This enhancement can be attributed to the increased optical absorption originating from both the surface plasmon resonances and photonic-mode light trapping in the nanostructured topography. The setup can be designed as shown in Fig. 18. A schematic description of the mechanism for photochemical oxidation and reduction processes of TiO2 is given in Fig. 19. Pal et al.165 have reported visible light photocatalytic degradation of methylene blue using the SPR generated at the n–p heterojunction of the Cu–Cu2O–ZnO nanocomposite.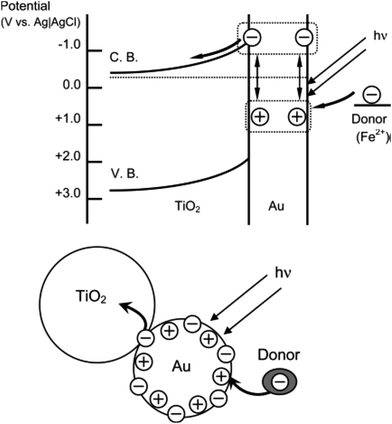 | ||
| Fig. 17 Proposed mechanism for photoelectrochemistry. Charges are separated at a visible-light-irradiated gold nanoparticle–TiO2 system. Reproduced from ref. 156 with permission from American Chemical Society. Copyright© 2005, American Chemical Society. | ||
 | ||
| Fig. 18 Fe2O3 photoanode on arrays of Au nanopillars. (a) Steps of the fabrication procedure. (b) The geometry of the Au nanopillars is shown schematically. The nanopillars are 300 nm in diameter at the base and 300 nm in height. Connected by a 200 nm thick planar Au film, the nanopillars were patterned in square arrays with 700 nm pitch. Inset: image of a 1.5 × 1.5 cm2 sample uniformly patterned with Au nanopillars with a penny for perspective. (c) 30° tilted and (d) top view scanning electron microscopy (SEM) images of 90 nm of Fe2O3 coated on an Au nanopillar array. Reproduced from ref. 164 with permission from American Chemical Society. Copyright© 2012, American Chemical Society. | ||
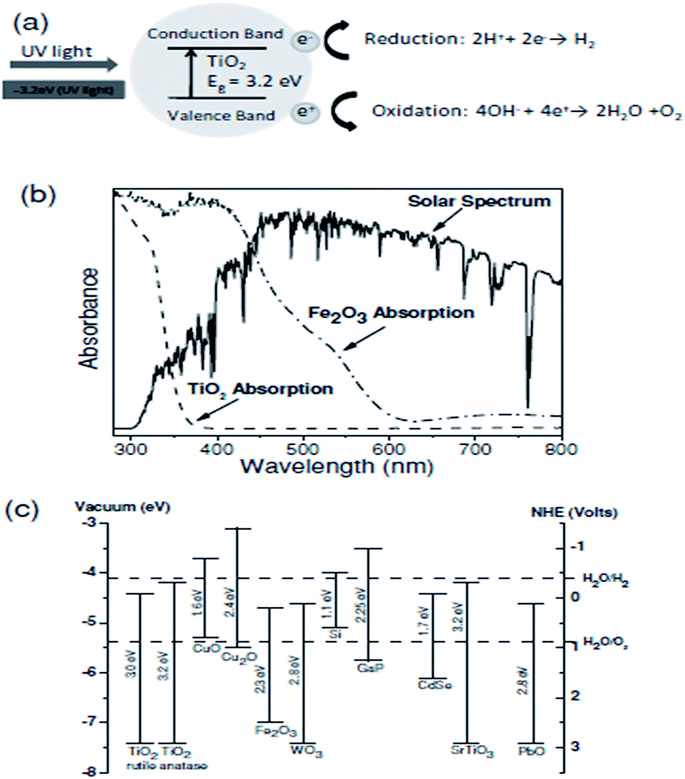 | ||
| Fig. 19 (a) Schematic illustrating the photochemical oxidation and reduction processes of TiO2. (b) Solar spectrum and absorption spectra of TiO2 and Fe2O3. (c) Energy band diagram of various metal oxide semiconductors, together with the redox potentials of water splitting. Reproduced from ref. 155 with permission from Elsevier B. V. Copyright© 2013, Elsevier B. V. All rights reserved. | ||
3.7. Nanoantenna
A nanoantenna is a key element to enhance the coupling between light emitters and free propagating optical radiation.166–168 It can bridge the near-field and far-field by enabling the electromagnetic energy transfer from near-field to far-field.167 Plasmonic nanoantennas can absorb and focus incident light into a sub-diffraction limited volume and can also efficiently couple out stored energy, acting as emitting antennas. These pave the way to allow for manipulation, control, and visualization of the optical field on the nanometre scale.169–172They can be used to revise the rate,173 intensity,174 polarization,175 spectral shape,176 and direction177 of the spontaneous emission of neighbouring luminescent emitters. If a nanoantenna consists of two cylindrical metal nanorods stacked vertically with a circular dielectric disk spacer, the thickness of the dielectric disk can control the resonance types. The efficiency of a nanoantenna increases with the cross-section and near-field enhancement. The large cross-sectional area enables the collection of electromagnetic energy from the incident radiation with high efficiency, and the large near-field enhancement allows the transfer of most of that energy into small volumes in the vicinity.167 Xuan et al.178 have prepared plasmonic nanoantennas for SERS detection and pH sensing. The long range surface plasmon resonance-probe-NP has a far better efficiency (nearly 40 times) compared to the planar film nanoantenna. There is a new report of a nanoantenna that is designed in a diabolo structure to produce a single hot spot in the optical frequency range so that a magnetic field can be confined in an enhanced form on the background of a weaker electric field.179 In this case, a high optical current density develops inside the central metal gap of the diabolo nanoantenna. This enhances the magnetic field. The specially prepared nanoantenna can detect an optical magnetic field and the magneto-optic modulation of plasmon polaritons at near-infrared or even visible frequencies. Fig. 20A shows the nanostructure, and Fig. 20B shows the enhancement. Though the coinage metals are preferably chosen for such plasmonic antennas, Al plasmonic nanostructures can introduce certain views, e.g., complementary metal-oxide-semiconductor (CMOS) compatibility, access to short-wavelength regions of the spectrum, and the possibility of low-cost, sustainable, mass-producible plasmonic materials.180 The d-band of Al lies above its Fermi energy band, and this allows the plasmon resonances to extend beyond the visible region of the spectrum into the ultraviolet. The Al nanorod antennas are examined using cathodoluminescence, where the photon emission from the radiative modes of the structure is detected among the other excited plasmonic modes. The imaging of individual plasmon modes with nanometre-scale spatial resolution is obtained due to the high degree of spatially localized excitation under the electron beam.181 This does not perturb the local dielectric environment like probe-based imaging and is very effective for detection of ultra-small particles. This shows the different nature of the dependence of the longitudinal and transverse plasmonic modes on the length of the nanorod. The longitudinal dipole resonance shifts to lower energies and becomes narrow upon increasing the nanorod length, and a higher order longitudinal mode comes out. However, the transverse resonance is merely dependent on the nanorod length and exhibits a slight blue shift with increasing rod length. The two plasmonic modes exhibit increased scattering with rod length. Metal films with coaxial holes are good nanoantennas, showing a 50 times better field enhancement. Hence, these are effective candidates for designing a new solar-cell, containing an inexpensive semiconductor with a low minority carrier lifetime embedded inside the plasmonic cavity.182 Another use of Al as a plasmonic light harvesting material has been reported by Lee et al.183 Vercruysse et al.184 proposed a V-modelled antenna with two coherent point-dipole sources. They mechanistically described that the origin of unidirectional scattering of light is the phase and amplitude matching occurring at the Fano interference between two localized surface plasmon modes in a V-shaped NP (Fig. 21).
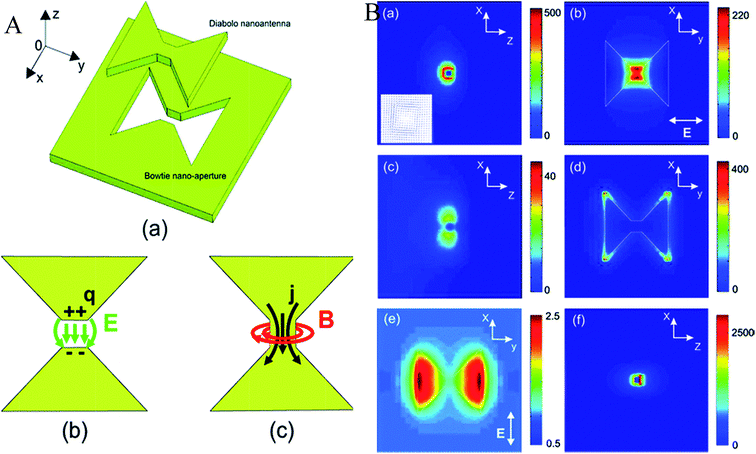 | ||
| Fig. 20 (A) (a) 3D view of the diabolo nanoantenna and its complementary bowtie nanoaperture. (b, c) Physical principles of the bowtie and diabolo nanoantennas, respectively. (B) (a–d) Normalized intensity distributions of (a, b) the magnetic field and (c, d) the electric field of a gold diabolo nanoantenna (G = T = 50 nm, D = 310 nm) excited with a plane wave whose electric field is linearly polarized along the y axis (λ = 1940 nm). Intensity plots along (a, c) the longitudinal (XZ) plane and (b, d) along the transverse (XY) plane. Inset of (a): vectorial map of the magnetic field around the metal gap, in the (XZ) plane. (e) Enhancement of the magnetic intensity for an incident electric field polarized perpendicularly to the y axis. Image size: 700 nm × 700 nm. (f) Same configuration as (a) with G = T = 20 nm and λ = 2570 nm. Image size: 300 nm × 300 nm. Reproduced from ref. 179 with permission from American Chemical Society. Copyright© 2011, American Chemical Society. | ||
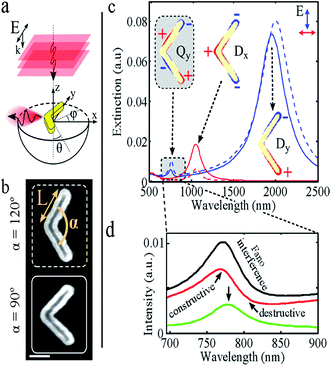 | ||
| Fig. 21 (a) Unidirectional side scattering of a plane wave with a plasmonic V-antenna. (b) SEM images of V-antennas with arm length L = 250 nm and opening angle α = 120° and 90°. Scale bar: 100 nm. (c) Simulated extinction spectra for the antennas in panel b (dashed curves: α = 120°, solid curves: α = 90°) for x- and y-polarization (red and blue, respectively). The insets show the charge density distributions of the observed V-antenna LSPR modes: Qy, Dx, and Dy. (d) A zoom-in on the Qy mode (α = 120°) in panel c reveals Fano interference when comparing the extinction (black), scattering (red), and absorption (green) intensity. Reproduced from ref. 184 with permission from American Chemical Society. Copyright© 2013, American Chemical Society. | ||
Some research groups178,185,186 have utilized plasmonic nanoantennas in enhancing the Raman signal. Fig. 22 describes the set up for enhancement of the Raman signal in the case of a long-range surface plasmon resonance/probe/AgNP (LRSPR-P-NP) sandwich configuration.
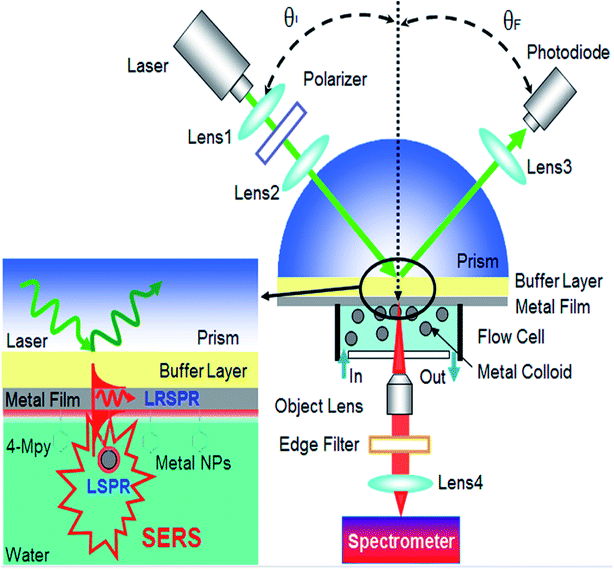 | ||
| Fig. 22 The setup of the LRSPR-P-NP Plasmonic Nanoantenna for SERS. Reproduced from ref. 178 with permission from American Chemical Society. Copyright© 2012, American Chemical Society. | ||
3.8. Surface enhanced Raman scattering (SERS) and nonlinear optics
Plasmonic NPs, particularly Ag and Au, generate a strong enhancement of the Raman scattering intensity from molecules adsorbed on their surfaces. This phenomenon is widely known as surface-enhanced Raman scattering (SERS).187,188 Cu NPs can show SERS sometimes.188 However, Ag serves as a better SERS active substrate as the dielectric constant of Ag near the Frohlich frequency gives rise to an intense surface plasmon absorption band in the range of the visible region.189 The enhancement in the scattering is due to two main factors: (a) electromagnetic enhancement, interaction between the transition moment of the adsorbed molecule and the electric field of the surface plasmon and (b) chemical enhancement, a mixing of metal and molecular orbitals that provide the charge transfer stating the occurrence of Raman resonance at a much lower energy state than that is available in the free molecule.1,187 For the first case, i.e., electromagnetic enhancement, the molecule close to the plasmonic metal surface obtains a large number of pathways for both excitation and emission due to the coupling of the incident light with the plasmon oscillations of the metal nanostructures, in contrast to the process of molecules in a free space.20 The factor by which the SERS intensity increases can be expressed considering the excitation local field enhancement factor and a radiation local field enhancement factor.
 | (7) |
Though the electromagnetic factor dominates, the chemical enhancement garnishes the process. The rough surfaces, e.g., island films,190 roughened electrode,191 encapsulated particles,192 and aggregated metal cluster,193,194 can increase the efficiency of SERS by stronger coupling with the electric field. In this process, the local electromagnetic field increases more than the incident field, and the incident light around the resonance peak wavelength is scattered very strongly. Again, the surface selection rule shows that the polarization has an effect on enhancement. Recently, it was found that the size and shape are two controlling factors, and sharp corners and edges in the geometry make a substrate magnificently SERS active.195 This is because of the presence of a strong plasmonic band at the edges. Surface pressure is also another factor. With the increase in the surface pressure, the SERS band intensities also increase for the PVP capped Ag nanocube deposition process on quartz via the Langmuir–Blodgett process. Particle density on the surface is also another factor.196 Fig. 23 shows the relationship. SPR improved SERS can be seen in benzenethiol adsorbed on AgNP arrays fabricated by the NSL method.197 A high enhancement factor of ∼108 was obtained for triangular NPs as the smaller Raman shifted peaks show a maximum enhancement near the peak of the LSPR than that of the larger Raman shifted peak. There is another example of a high enhancement factor of SERS (>1 × 10⁸).198 In this plasmon sampled surface enhanced Raman excitation spectroscopy study, Fe(bpy)32+ was used as the adsorbate. In the green synthesis of the flower-like Ag doped MnO2 nanostructure, the flower works as a probe for SERS. Here the Ag particles, which are doped on nanoflowers, excite the surface plasmon and increase the SERS enhancement.199 Recently Jing et al. have fabricated Ag deposited nickel hydroxide [Ni(OH)2] nanosheet (NS) arrays using a pulsed laser deposition (PLD) technique for surface-enhanced Raman scattering (SERS) spectroscopy. The enhancement of the local electromagnetic field, induced during the interaction between Ni(OH)2 and Ag, helps to exhibit a high Raman scattering enhancement ability (enhancement factor as high as 5 × 10⁶; Rhodamine 6G was used as probe molecule with a concentration down to 10−5 M). The enhancement factor is also dependent on the size and interparticle distance of the AgNPs rather than the testing positing on the film surface. The as-synthesized three dimensional structure helps in the formation of hot spots and causes a highly sensitive Raman phenomenon.200 Although the ‘free electron like’ noble MNPs are SERS active substances and provide a huge implicational area, the other transition metals fail to fulfil expectations. The reason is the high value of the imaginary value of the dielectric constant and unsatisfactory SPR. Some chelating ligands, such as 1,10-phenanthroline (phen), 1,2-diaminoethane (en), pyridine (py) etc., can be used to impart SERS to the metal-chelate complex. The experiment with a Ni-complex has successfully established the use of a ligand.201 Tabatabaei et al.202 used the metallic hole array of Au with a high hole density for SERS studies. Using the LSPR of Au, a SERS limit of detection of 10−16 M for 4-nitrothiophenol was obtained along with a distribution mapping of the molecule on the 3D plasmonic nanosensor.
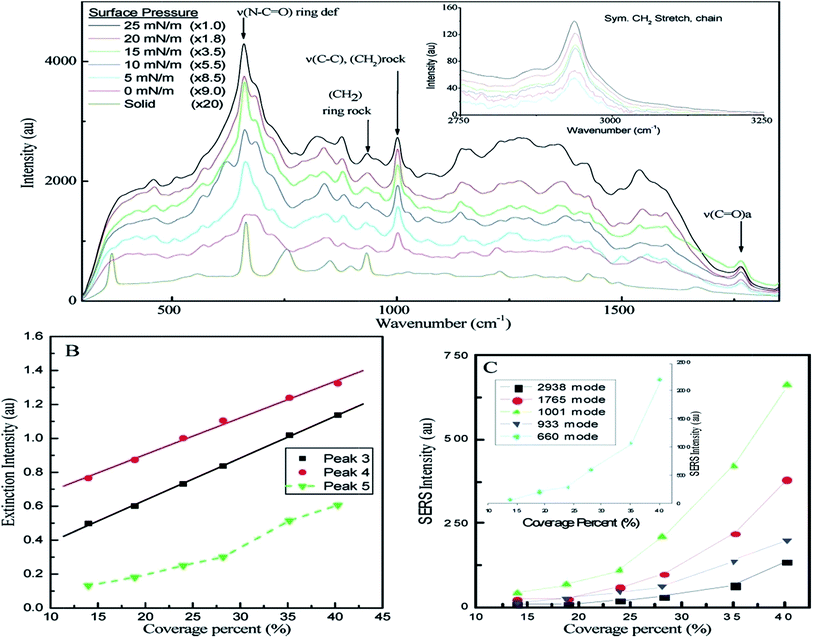 | ||
| Fig. 23 (A) Surface-enhanced Raman spectra of bulk solid PVP and PVP adsorbed onto the surface of silver nanocubes deposited onto a quartz substrate at surface pressures of 0, 5, 10, 15, 20, and 25 mN m−1. (B) The relationship between the percent of coverage area and the plasmon peak intensities of peaks 3, 4, and 5 at 785 nm. (C) The relationship of SERS band intensity of five well-resolved bands and the corresponding percent of coverage. Reproduced from ref. 196 with permission from American Chemical Society. Copyright© 2009, American Chemical Society. | ||
Raman scattering has a non-linear counterpart, hyper Raman scattering (HRS), which can act as a probe for molecular vibrations. HRS involves only two pump-photons.203 HRS has the potential to observe low energy molecular vibrations and vibrational molecular modes inactive in both Raman spectra and infrared absorption. HRS involves the absorption of two fundamental photons, and as a consequence, HRS is well separated spectrally from the incident laser light, which represents a significant experimental advantage. However, the rejection of the laser light is an important problem for the observation of low energy molecular vibrations with SERS because the spectral shift from the laser wavelength is small for this inelastic optical process. Furthermore, HRS is a nonlinear optical process, which involves three photons in total and must obey specific selection rules.203 Butet et al.203 have designed certain substrates that shows surface enhanced HRS (Fig. 24). They showed that a nanostructure where the second harmonic generation can be reduced in the detection direction, which enabled the hyper-Raman scattering signal from the single donor–acceptor “push–pull” chromophores to be experimentally recorded with a low noise level using surface-enhanced HRS. Also, the hyper-Raman signal from one molecule can be stronger than the second harmonic generation from a complete plasmonic nanostructure despite volume differences between both nanoobjects.
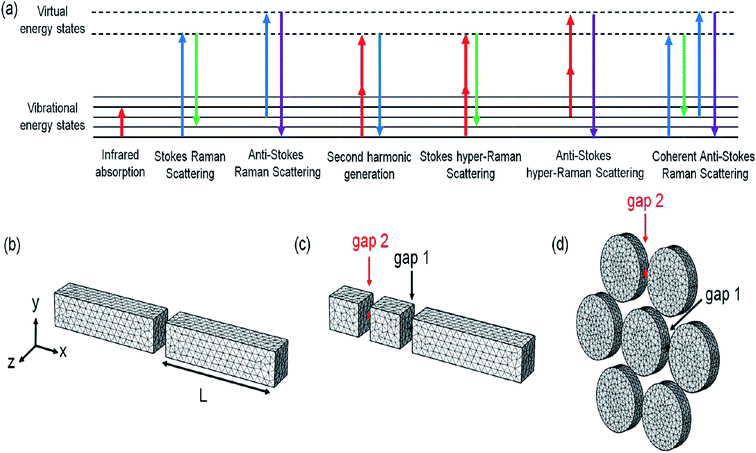 | ||
| Fig. 24 (a) Jablonski diagram illustrating the different spectroscopy techniques discussed in this article. Geometries of the plasmonic nanostructures studied in this article with the corresponding meshes used for the numerical computations: (b) aluminum dipolar nanoantennas, (c) double resonant antenna (DRA) made with aluminum, and (d) silver heptamers. The length of the dipolar nanoantennas arms varies from L = 110 to 190 nm. The width and height are fixed to 40 nm and the nanogap to 20 nm. For the DRA, the length of the small bars is 40 nm and the length of the long bar is 170 nm. For the silver heptamers, the nanoparticle diameter varies from 70 to 120 nm. The height is fixed to 30 nm and the interparticle distance to 10 nm. The arrows indicate the gaps mentioned in the main text and the other figures. Reproduced from ref. 203 with permission from American Chemical Society. Copyright© 2015, American Chemical Society. | ||
The strong EM fields resulting from SPPs allow a weakly non-linear process, which depends linearly on the local fields.204 The surface enhanced second harmonic generation (SESHG) has its importance in sensing the electronic structure of an interface. The SESHG can be performed on both smooth and rough surfaces, but a rough surface is preferred over a smooth surface.205–207
The enhancement of a certain order is described in terms of a three step mechanism involving effective SPP excitation at the pump frequency (experimental setup), evolution of a phase-matched evanescent second harmonic wave and selective scattering of the evanescent wave into the particular radiative channel.205 This three step mechanism has an exception that involves the excitation of counter-propagating SPP modes at the pump and probe frequencies. A related theoretical experiment by McGurn et al.208 showed that the counter-propagating SPP wave, interfering with the incident SPP, can be excited via multiple scattering by a disordered surface of an SPP wave generated at the pump frequency. This results in the generation of second order photons at a null wave vector via a second order susceptibility of the corresponding surface.205 The metal coated diffraction grating is considered an effective candidate for showing the SHG phenomenon. Zhang et al.204 have shown that a second-harmonic generator can be directly used as an SPP frequency multiplier, and the proposed method can be extended to achieve high-order harmonics, which are essential to SPP integrated circuits and systems. AuNPs show an excellent non-linear property due to their high third order, non-linear optical properties near the vicinity of the SPR wavelength.209 For the structural anisotropy, two extinction peaks of SPR occur in non-spherical NPs. These peak shifts for different aspect ratios can give an idea of non-linear optical properties.210 In their experiment, Liao et al.211 showed that the optical nonlinearity in the Au–TiO2 film on the femtosecond time scale interband electron-dipole transition and hot electron excitation partially contributes to the third order, non-linearity and full contribution for picoseconds. The nanocomposite thin films composed of MNPs exhibit high third order, non-linearity due to quantum size and interfacial effects. Such a phenomenon has been recently observed using a z-scan technique for Au nanocrystals surrounded by a microporous silica thin film.212 In that case the non-linear property of the Au nanocrystals (GNCs) embedded on two different kinds of mesoporous silica thin films (MSTFs), synthesized using different surfactants (Brij-56 and CTAB), were determined by the z-scan method. They proposed that the optical non-linearity of the GNC/MSTF nanocomposite could be adjusted as the mesostructure of the MSTF is tunable and the size and concentration of the GNCs can be controlled (Fig. 25).
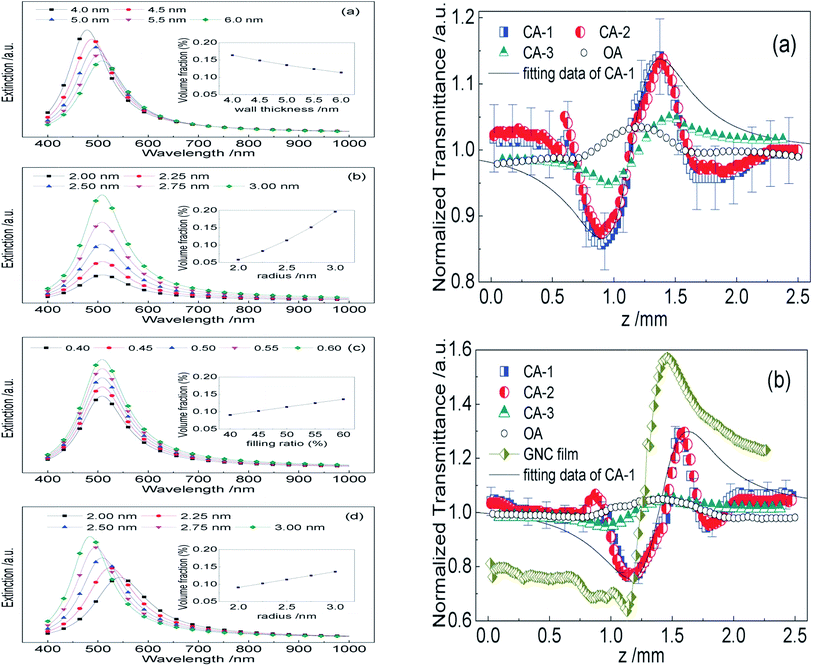 | ||
| Fig. 25 (A) Calculated extinction properties of the GNC/MSTF nanocomposites with different (a) pore structure, (b) spherical particle size, (c) filling ratio and (d) ellipsoidal particle shape. The insets show the relationship between the volume fraction and the wall thickness T, the radius of spherical GNCs a (= b), the particle filling ratio g and the semimajor axis a (b), respectively. In the calculations, the following values were adopted: c1 = 2, c2 = 1, εair = 1, εbulk = 4, the film thickness, H = 200 nm, the constant related to electron–surface interactions, A = 0.43 and the bulk damping constant, c0 = 4.4 × 10¹⁴ Hz. (B) z-Scan data of GNC/MSTF nanocomposites prepared by (a) Brij-56 and (b) CTAB. The symbols are z-scan measurement results and the solid curves show the calculated results from eqn (8). CA-1 and CA-2 are results of the GNC/MSTF samples measured with closed-aperture and CA-3 is the z-scan results of the glass substrates with blank MSTFs using closed-aperture, whereas the OAs represent the z-scan data of the GNC/MSTF samples measured with open-aperture. The error bars are added with 5% of the error sources of CA-1 in both (a) and (b). Reproduced from ref. 212 with permission from Royal Society of Chemistry. Copyright© 2012, Royal Society of Chemistry. | ||
3.9. Certain other physical properties
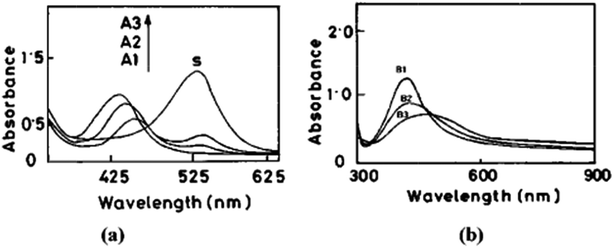
There are certain physical properties of MNPs that are SPR dependent. The color of the MNPs is one of them. With a change in the particle size, the color changes. This may be explained by the size dependence of the plasmon. The individual spherical AuNPs come into close proximity to form clusters, and then there is an electromagnetic coupling between the clusters. When the intercluster distance is nearly five times smaller than the individual cluster radius, the extinction spectra becomes complicated. The plasmon band shifts to a red region (∼300 nm), the longitudinal plasmon band broadens and transmission occurs in the blue region.1 The change in the particle size due to aggregation causes this change in the optical property. Fig. 26 gives a glimpse of the size dependence of gold nanoparticles.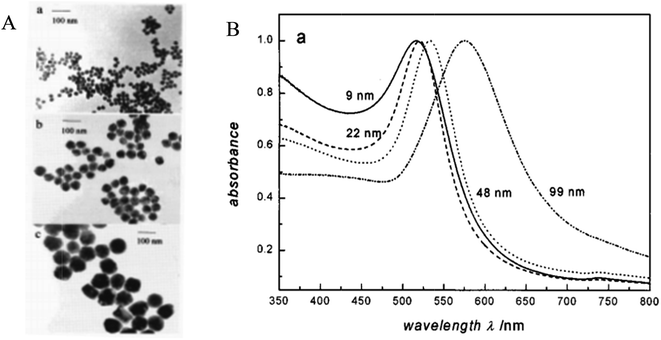 | ||
| Fig. 26 (A) TEM images of the 22 (a), 48 (b), and 99 nm (c) gold nanoparticles. (B) UV-vis absorption spectra of 9, 22, 48, and 99 nm gold nanoparticles in water. All spectra are normalized at their absorption maxima, which are 517, 521, 533, and 575 nm, respectively. Reproduced from ref. 267 with permission from American Chemical Society. Copyright© 1999, American Chemical Society. | ||
 | (8) |
 | (9) |
The interparticle coupling is stronger than the coupling within the surrounding medium, and the Mie theory, which is developed for dilute medium and isolated particles, fails to explain the absorption spectrum. To combat this problem, an effective medium theory was proposed by Maxwell Garnett in 1904.1 This effective medium theory, better known as the Maxwell Garnett theory, is strictly valid for close particle systems or within the quasistatic limit. There are certain assumptions for this theory, such as particles are considered as spherical, particles are considered to be within the quasistatic range, proximity surface effects can be neglected, only constituents for the nanostructure and matrix are considered and a linear response to the external electromagnetic field is considered to neglect the tunneling effect. Theoretical calculations include the Lorentz theory and the Clausius–Mossotti equation to establish the quasistatic system. The final form is as follows:
 | (10) |
All the theoretical approaches to the SPR have been established through various calculation methods such as the (a) Explicit Particle Method – this computational method is applied for spherical particles with a small particle density; (b) Discrete Dipole Approximation – a method of computing the scattering of radiation by particles with arbitrary shapes or periodic structure. This total process is dependent on the basic principle of the Clausius–Mossotti relation. This method gives an exact solution for a finite array of point dipoles. The DDA solutions for two independent polarizations of the incident wave allow the determination of the complete amplitude scattering matrix; (c) Finite-Difference Time-Domain (FDTD) method.1
4. Factors affecting SPR
SPR is widely utilized to improve and explain the different properties of MNPs. However, there are several factors that can manipulate the nature of the SPR.4.1. Size, shape, morphology of particles and medium refractive index
As per the Mie–Gans theory,225 SPR is strongly influenced by the shape and size of the NPs. Fig. 27 shows the different SPR peaks for the different shapes of Au (normalized scattering vs. wavelength).226 NPs with different shapes but comparable plasmon lengths (the distance between two poles in the particle created due to the electromagnetic field) have similar LSPR spectra. It has been found that while going towards the isotropicity of the particle size, a blue shift occurs. However, the sharp tips on the Ag–Au nanocubes,227 Au nanostars,228 Ag nanotriangles,229 Au-nanocrescents,230 Au nanocrescents231 can cause red shifts in the plasmonic spectra. This has an important impact on the refractive index sensing technique.148 The optical properties of the Au NPs can be changed by changing their particle size. Fig. 11 gives an idea about the size dependence of SPR spectra. For thin film or hollow type systems, the thickness plays a significant role. Mahmoud et al.232 studied hollow NPs with two surfaces, one facing the outside and the other inside the cavity. Their coupling creates surface fields inside the cavity and outside the surface. This depends on the thickness of the wall.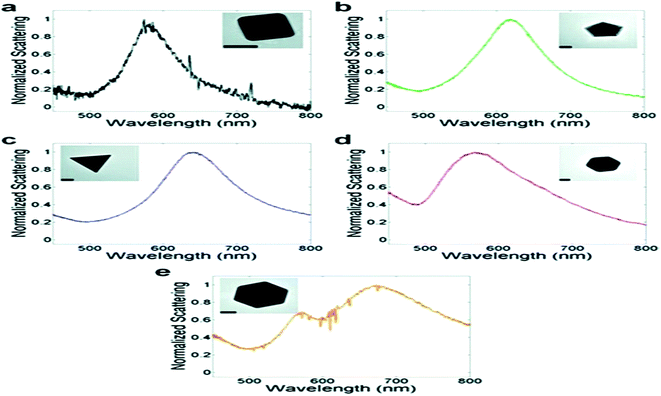 | ||
| Fig. 27 Representative TEM image and associated single-particle LSPR spectrum for Au nanoparticles: (a) cube, (b) decahedron, (c) icosahedron, (d) triangle (truncated bitetrahedron), and (e) octahedron. Scale bars, 50 nm. Reproduced from ref. 226 with permission from American Chemical Society. Copyright© 2012, American Chemical Society. | ||
The aspect ratio and diameter of spheroidal NPs control the transverse and longitudinal dipoles of the SPR. For template synthesized Au nanorods, the longitudinal dipole is first order with respect to the aspect ratio and second order with respect to the diameter.233 A thin film decay study of light emitting nitrogen atoms in a nitrogen matrix of varying sapphire thickness (Ag and potassium (K) film (thickness variation from 3 to 1000 nm))4 showed that the surface plasmon resonance of the thick Ag films occurs in the middle ultraviolet region (E = 3.5 eV, λ = 350 nm), but for the Ag film with a much lower thickness, the surface plasmon splits into higher-energy (normal mode) and lower-energy (tangential mode) resonances due to the interactions of the electron density oscillations on each surface.234 However, for the K thin film, the thickness does not alter the surface plasmon very much. The SPR occurs at E = 2.4 eV (λ = 480 nm).4 An increase in particle size due to aggregation causes the broadening of the plasmonic band235 (Fig. 28). Again, the shift of the plasmonic band (blue or red shift) can occur due to the formation of the core–shell structure, e.g., during the formation of Aucore–Agshell structure under UV irradiation, and the plasmon peak shifted in the blue region showing a gradual deposition of the Ag layer on the seed Au NPs (Fig. 28). Application of the correlation HRTEM-LSPR method on a single NP shows the effect of shape, size, composition and substrate refractive index on the plasmonic properties of certain nanostructures, such as cubes and right bipyramidal shapes.236 An increase in these factors causes a red shift to the plasmon band. For Ag bipyramids, the truncations on the equatorial corners also have some effects.237 The shape dependence of the surface plasmon band depends on those defects. Fig. 29 shows the different spectra of Ag and Au nanostructures for difference in truncations. The refractive index is modified for the size of a particle lower than the mean free path of the conduction electrons in bulk particles.238 An interesting incident occurs with the LSPR band of colloidal Au NPs with uniform morphology and a narrow size distribution within the diameter range of 2–20 nm. It is noticed that when the particle size decreases from 20 to 12 nm a blue shift occurs, but from a 12 nm diameter, a red shift occurs.239 Such a blue shift for the particle with a diameter comparable with the dimension of the incident light is due to radiative depolarization.240 Both the SPR peak and band width depend on the size of particle. All of the size dependence is due to the intrinsic size effect. The SPR-based catalytic property can also be changed due to the size factor.241,242 The particles that are in a growing condition, i.e., they are not aggregated, can work as better redox catalysts than the larger completely aggregated particles.242 The LSPR depends on the refractive index of the medium and the particle according to:
 | (11) |
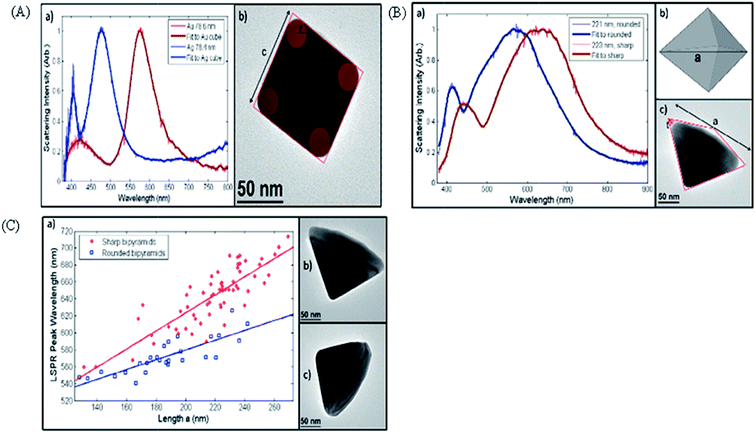 | ||
| Fig. 29 (A) Correlated HRETM-LSPR of Au and Ag cubes on Formvar: (a) Typical LSPR spectra for a 78.6 nm gold cube and a 78.4 nm silver cube, (b) silver nanocube showing measurements used: c is the face-to-face distance (size), and r is the radius of curvature for the corner rounding. (B) Correlated LSPR/TEM of silver bipyramids on Formvar: (a) LSPR spectra for bipyramids of similar size and different rounding, (b) 3D model of a right bipyramid showing a as the equilateral base triangle edge length, (c) bipyramid measurements, where the truncation length t is the height of a triangle fitting in the empty space formed by the ideal bipyramid drawing. (C) Effect of corner rounding and size on the dipolar plasmon silver bipyramids: (a) plot of the LSPR maximum as a function of size for two groups of rounding. The slopes, 1.07(0.07) for sharp particles and 0.558(0.07) for rounded ones, are significantly different (b) example of a particle from the sharp group, (c) example of a particle from the rounded group. Reproduced from ref. 236 with permission from Materials Research Society. Copyright© Materials Research Society 2010, American Chemical Society. | ||
These relationships show the linear dependence of the LSPR peak wavelength on the refractive index for a small range of η. However, when solvents have varying functional groups, the relationship becomes non-linear. This is due to interactions between the particle surface and functional groups.
Another NSL process is angle resolved nanosphere lithography. The schematic view of this process is given in Fig. 31.245 By varying the angle of deposition, the nanooverlap and nanogap structure can be produced. For preparation of the nanooverlap structure, the metal is deposited at θdep = 0° with a second deposition at or below the threshold value of θdep. An example is the Ag deposition on a mica substrate with a nanosphere diameter of 542 ± 7 nm. The NP–NP overlap decreases from 0° to 20°. The AFM studies show that in this range there is no overlap or gap in this range. This has a great application to the optical properties of NPs with a very large aspect ratio. For the nanogap structure, the second deposition occurs at or above the θdep. Here, the gap increases upon increasing the θdep from 22°. NSL application on an anisotropic surface can cover nanowells and NP templates. Noble metal single layer periodic particle arrays (PPA) can be used as a template. For an example, Ag–PPA can be used as template for the dithiol molecule. The metal colloids are bound to the free end of the dithiols to prove the templating ability. The total process is monitored with AFM. Depending on the masking and dosing, it is possible to achieve the desired deposition on the top of the metal or the four sides of the metal.237 The diameter of the nanosphere mask controls the aspect ratio and diameter of the fabricated NP, which causes a change in the extinction spectra.248 When NSL is combined with a reactive ion etching process (RIE), the flexible method can extend two dimensional PPAs into three dimensions in anisotropic surface chemistry. A polystyrene nanosphere mask can be used as an RIE mask in the case of CF4 plasma attack for fluorinating the hydrocarbon fluorination. As the product is non-volatile, the spheres act as the etch stop. In the meantime, the CH4 penetrates the mask, and the volatile SiFx products are etched away. This gives PPA-shaped nanowells.250 High aspect ratio NP preparation is an achievement of this process. The NSL procedure in the case of anisotropic surface chemistry has future prospects. A recent study of the on-wire lithography212 technique allowed the study of changes in the photoluminescence spectra of a polythiophene nano-disk and GNR separated by a certain nanometre distance. This technique allows the monitoring of the optical property of any nanostructure separated from a fluorescent semiconducting material by a nano-range distance. Certain other nanostructures that have become important as spherical structures are belt,251,252 wire,253 ring,254,255 disk,255 hole,256 rod,257 triangular prism,258 etc., which in general have a higher surface energy. Fabrication of a nanobelt (15–25 nm height, 25–100 nm width) with a rectangular cross-section of Au is prepared by reduction of gold chloride in the presence of CTAB and SDS surfactants. The important contribution of the nanobelt geometry is to support the hierarchy of plasmon modes, an important property of interest for devices, waveguides, and complex optical networks.253–259 Nanobelt geometry has a sufficiently small cross section. So, dark field microscopy is employed for imaging those geometries (Fig. 32I).252 A simple technique for preparation of Au nanowires is atomic force microscopy nanolithography. The length of the wire is important as it is directly dependent on the LSPR mode. Fig. 32II shows the SEM, TEM, optical microscope images and the scattering plots for the prepared nanowires. The nanorings and disks can be produced via the same process of a colloidal lithographic technique. The four steps that produce nanorings and nanodisks with an outer radius of 60 nm and heights of 40 nm and 20 nm, respectively, are: (i) electrostatic self-assembly driven deposition of polystyrene (PS, controls the inner radius of the ring) colloidal particles (110 nm sulphate modified latex) on the glass substrates, (ii) evaporation of a 15 nm to 40 nm thick Au film (controlling factor of the thickness of the ring walls) on the particle coated glass substrates, (iii) removal of the Au film by etching with an Ar ion beam followed by generation of the Au shell around the PS particles, (iv) removal of the remaining PS particles by UV–ozone treatment and subsequent rinsing with water to obtain Au nanorings. Fig. 32III. Fig. 32IV shows the SEM image of the Au and Ag nanoring arrays (Au with a diameter of 150 nm and 200 nm and 500 nm periodicity). The Au rings are more closely packed. The fabrication of the Ni nanohole arrays (1 mm wide and 0.1 mm channel depth) with a high aspect ratio (aspect ratio = 20) consists of these steps – (i) propagation of negative nanopillar arrays of poly(methyl methacrylate) (PMMA) and (ii) successive formation of nanohole arrays of a metal. Fig. 32V1 represents the fabrication procedure. In the second part of Fig. 32V2, the SEM image of the Ni nanohole array and the PMMA nanohole array after removing the alumina template can be seen. The uniform PMMA pillars are well arranged as they have the support of e polymer assay. The desired Ni nanoholes are obtained by deposition of Ni into the cavities of the negative type polymer PMMA, which is dissolved in chloroform. One method of preparation of Ag nanotriangles is irradiation of fluorescent light, ∼40 W, on spherical AgNPs, and with an increase in time, the conversion from sphere to triangular prism takes place and after 70 h a complete conversion occurs. This transformation can be monitored through a change in the color (Fig. 32VI). The dimensions for a nanoprism structure can be controlled in situ by adjusting the experimental parameters as a ratio of metal ion and reducing agents,257,260 pH,261 concentrations of surfactant and seed particle and also their nature,262–265 wavelength of irradiating light266 etc.
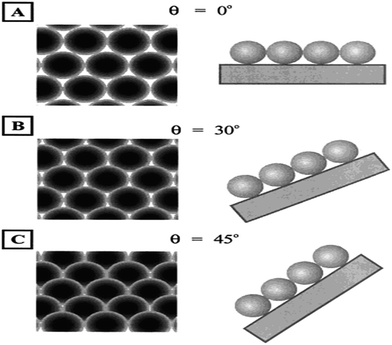 | ||
| Fig. 31 Schematic of the angle resolved deposition process. (A) Samples viewed at 0°. The interstices in the nanosphere mask are equally spaced and of equal size. (B) Sample viewed at 30°. The interstices in the nanosphere mask follow a pattern including two different interparticle spacing values, and the interstitial area is smaller. (C) Sample viewed at 45°. The interstices are now closed to line of sight deposition. Reproduced from ref. 245 with permission from American Chemical Society. Copyright© 2001, American Chemical Society. | ||
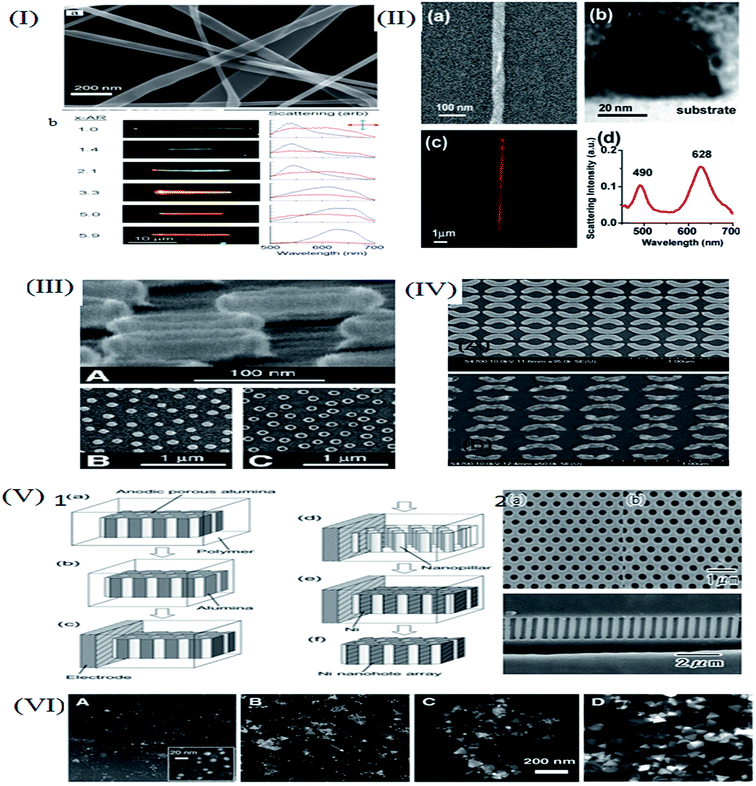 | ||
Fig. 32 (I) (a) Gold nanobelt, the overall ribbon-like morphology (b) dark field micrographs (left) and corresponding single nanobelt spectra (right). The given aspect ratios were determined by atomic force microscopy. The blue spectra are polarized transverse to the nanobelt, and the red spectra are polarized parallel to the nanobelt. Reproduced from ref. 252 with permission from American Chemical Society. Copyright© 2011, American Chemical Society. (II) (a) The SEM and (b) the TEM images of a fabricated single Au NW and its cross section, respectively. (c) The dark-field optical image of a Au NW with a width and a thickness of 70 and 22 nm, respectively, and (d) the corresponding scattering spectrum that shows two LSPR peaks at 490 and 628 nm. Reproduced from ref. 253 with permission from American Chemical Society. Copyright© 2010, American Chemical Society. (III) SEM images of gold nanorings and nanodisks prepared by colloidal lithography. (a) 80° tilt image of a ring structure. The walls of the rings are thin enough for the 30 keV electrons to pass through. (b and c) Top views of disks and rings taken at an acceleration voltage of 1.5 keV. The heights of the disks and rings in the figure are ≈20 and ≈40![[thin space (1/6-em)]](https://www.rsc.org/images/entities/char_2009.gif) ![[thin space (1/6-em)]](https://www.rsc.org/images/entities/char_2009.gif) ![[thin space (1/6-em)]](https://www.rsc.org/images/entities/char_2009.gif) nm, respectively, whereas the radius is ≈60 nm, respectively, whereas the radius is ≈60![[thin space (1/6-em)]](https://www.rsc.org/images/entities/char_2009.gif) ![[thin space (1/6-em)]](https://www.rsc.org/images/entities/char_2009.gif) ![[thin space (1/6-em)]](https://www.rsc.org/images/entities/char_2009.gif) nm in both cases. The thickness of the ring walls was estimated to 14 ± 2 nm in both cases. The thickness of the ring walls was estimated to 14 ± 2![[thin space (1/6-em)]](https://www.rsc.org/images/entities/char_2009.gif) ![[thin space (1/6-em)]](https://www.rsc.org/images/entities/char_2009.gif) nm from side-view SEM images similar to (a). Reproduced from ref. 254 with permission from American Physical Society. Copyright© 2001, American Physical Society. (IV) (A) Gold nanoring double split array with semicircle radii of 200 and 150 nm and (B) silver nanoring double split array with semicircle radii of 200 and 150 nm. The periodicity in both cases is 500 nm. Reproduced from ref. 255 with permission from Elsevier B. V. Copyright© 2009, Elsevier B. V. All rights reserved. (V) (1) Schematic for the preparation of metal nanohole arrays: (a) the anodic porous alumina membrane is embedded in poly(methyl-meth-acrylate) (PMMA); (b) exposure of two sides of the porous alumina membrane; (c) formation of electrodes for electrochemical deposition of metal; (d) removal of alumina template; (e) electrochemical deposition of Ni; and (f) removal of the PMMA negative. (2) SEM images of Ni hole array membranes: (a) surface side, and (b) back surface. (c) Cross-sectional SEM image of a Ni hole array membrane. Reproduced from ref. 256 with permission from WILEY-VCH Verlag GmbH & Co. KGaA, Welnhelm. Copyright© 2005, WILEY-VCH Verlag GmbH & Co. KGaA, Welnhelm. (VI) TEM images (reverse print) mapping the morphology changes (A) before irradiation and after (B) 40, (C) 55, and (D) 70 hours of irradiation. Except for the inset in (A), the scale bar is 200 nm for all four images. Reproduced from ref. 258 with permission from American Association for the Advancement of Science. Copyright© 2001, American Association for the Advancement of Science. nm from side-view SEM images similar to (a). Reproduced from ref. 254 with permission from American Physical Society. Copyright© 2001, American Physical Society. (IV) (A) Gold nanoring double split array with semicircle radii of 200 and 150 nm and (B) silver nanoring double split array with semicircle radii of 200 and 150 nm. The periodicity in both cases is 500 nm. Reproduced from ref. 255 with permission from Elsevier B. V. Copyright© 2009, Elsevier B. V. All rights reserved. (V) (1) Schematic for the preparation of metal nanohole arrays: (a) the anodic porous alumina membrane is embedded in poly(methyl-meth-acrylate) (PMMA); (b) exposure of two sides of the porous alumina membrane; (c) formation of electrodes for electrochemical deposition of metal; (d) removal of alumina template; (e) electrochemical deposition of Ni; and (f) removal of the PMMA negative. (2) SEM images of Ni hole array membranes: (a) surface side, and (b) back surface. (c) Cross-sectional SEM image of a Ni hole array membrane. Reproduced from ref. 256 with permission from WILEY-VCH Verlag GmbH & Co. KGaA, Welnhelm. Copyright© 2005, WILEY-VCH Verlag GmbH & Co. KGaA, Welnhelm. (VI) TEM images (reverse print) mapping the morphology changes (A) before irradiation and after (B) 40, (C) 55, and (D) 70 hours of irradiation. Except for the inset in (A), the scale bar is 200 nm for all four images. Reproduced from ref. 258 with permission from American Association for the Advancement of Science. Copyright© 2001, American Association for the Advancement of Science. | ||
4.2. Temperature
Temperature is another factor that may cause a change in the SPR band. In their experiment Link and El-Sayed267 found a small temperature effect on the optical band. Their conclusion is shown in the Fig. 33 for AuNPs with a diameter of 22 nm. Kreibig examined certain Au and Ag clusters (diameter 1–10 nm) on a glass matrix and found that upon an increase in temperature from 1.5 to 300 K the SPR peak broadens and the intensity decreases.268,269 The electron–phonon interaction is responsible for the temperature dependence of the Ag particle.266 However, this effect may be compensated by a thermal lattice contraction of NPs with a decrease in temperature. The contraction effect is pronounced in case of the smaller particles.269 A similar result is attained for Ag NPs with mean sizes of 24 nm and 60 nm embedded in a silica glass host matrix at a temperature range 17–700 °C.270 The temperature dependence of the dielectric permittivity of the host matrix is also an important factor along with the thermal expansion of the NPs in this case. The NP volume increases with the increase in the temperature and the density of the free-electrons decreases. This lowering of electron density leads to a lowering of the plasma frequency by increasing the radiation damping. This is the reason behind the red shift and broadening of the SPR peak.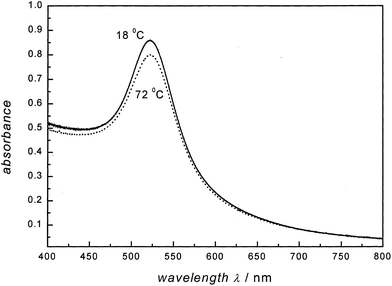 | ||
| Fig. 33 Temperature dependence of the plasmon band absorption for the 22 nm gold nanoparticles. The absorption spectra are measured at 18 °C (solid line) and 72 °C (dashed line). Reproduced from ref. 267 with permission from American Chemical Society. Copyright© 1999, American Chemical Society. | ||
Other experiments by Doremus for an Au particle with a diameter of 12 nm confirmed the broadening of the SPR band within the temperature range of 469–787 K. The broadening is accompanied by a decrease in the intensity and a slight red shift. The observed changes were much smaller than expected over such a wide range of temperatures. Doremus gave the explanation that the electronic contraction factor (which determines the plasmon frequency) decreases with the increase in temperature.271,272 However, it is also noted that this temperature dependence is valid for a small range of particle sizes. It is obvious that a significant change in the band needs a very high temperature. Hence, water cannot be used as a medium, rather it can be replaced by any matrix.267 The main problem with water is that it will vaporise, and the refractive index changes with temperature. This will cause a comparatively narrow band and a slight blue shift of the peak position. These two conclusions are totally opposite from the observed temperature effect. If the excitation energy of a photon of energy 2.38 eV is distributed among all the conduction electrons participating in the coherent excitation, the electron–phonon interaction becomes stronger through coupling. For 22 nm sized Au particles with ∼250![[thin space (1/6-em)]](https://www.rsc.org/images/entities/char_2009.gif) 000 atoms per particle, the energy of a single electron is 9.5 × 10⁻⁶ eV. As the Debye temperature of Au is 170 K,273 it follows all the phonon modes that are already excited at room temperature with energy 1.5 × 10⁻² eV (much higher than the energy of a single electron). Thus, a further temperature change will not show any significant change in the available phonon modes coupled with the electron.
000 atoms per particle, the energy of a single electron is 9.5 × 10⁻⁶ eV. As the Debye temperature of Au is 170 K,273 it follows all the phonon modes that are already excited at room temperature with energy 1.5 × 10⁻² eV (much higher than the energy of a single electron). Thus, a further temperature change will not show any significant change in the available phonon modes coupled with the electron.
4.3. Medium and surfactants
The shift of λmax with a different aspect ratio vs. refractive index of solvent plot indicates a decrease in sensitivity. However, the change in SPR due to a change in the medium dielectric constant is not as effective as that caused by a change in the aspect ratio.274 Also the stabilizing ligand can change the SPR band position. When a series of cationic (C10TAC, C12TAC, C14TAC, and C16TAC) and anionic (DSS, SDS, and SDBS) surfactants of variable chain length were used to detect the LSPR changes induced by binding the analytes to the Au colloids, it was found that the different chain lengths of the analytes imparted different dielectric environment and sensitivity towards the Au surface.275 Fig. 34 shows the variation. This may be accounted for by the non-homogeneity of the environment as the dense cells of the binding ligand provided a dielectric coating at the particle surface. Not only the ligand chain length but also the ligand functionality can change the SPR spectral position. It is seen that ligands with –OH or –NH2 groups interacts weakly with the Au particles and protect its electronic property, but thiol groups give significant stability by inducing significant charge distribution.275 However, the addition of anions causes a disturbance in the Fermi level of the particle, which in turn alters the SPR condition.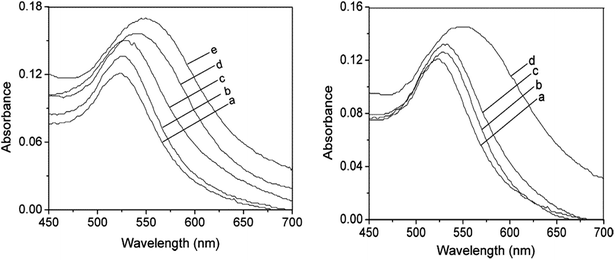 | ||
| Fig. 34 (A) Absorption spectrum of gold nanoparticles (50 μM) (a) as prepared in THF and after modification with 0.1 mM of (b) C10TAC, (c) C12TAC, (d) C14TAC, and (e) C16TAC, respectively. (B) Absorption spectrum of gold nanoparticles (50 μM) (a) as prepared in THF and after modification with 0.1 mM of (b) DSS (c) SDS and (d) SDBS, respectively. Reproduced from ref. 275 with permission from American Chemical Society. Copyright© 2004, American Chemical Society. | ||
4.4. Fermi level and SPR
The Fermi level for a material is the highest occupied energy level at absolute temperature. The total plasmonic energy stays in the Fermi level of the MNP.155,276 The Fermi distribution of the electrons varies only slowly with electronic temperature, and the scattering rate depends strongly on the availability of empty states just above or below the Fermi level. The charge or discharging events occurring due to plasmons cause changes in the metallic Fermi level.277 Addition of nucleophiles or electrophiles to colloidal NPs can cause changes in the position of the Fermi levels. Thus, the SPR peak position may change. In his experiments, Henglein257,278 showed that the physical and chemical properties of nm-sized finely divided Ag particles are significantly modified by the adsorption of nucleophilic species. These nucleophile modified Ag particles catalyze thermal and optical electrochemical reactions like the growth of core–shell279 metallic particles. This is due to the modification of the Fermi level of both the metal and reactant in the presence of a nucleophile.280 Another experiment by Henglein shows that the nature of the nucleophile can affect the plasmonic peak.276 When I− and I2 are adsorbed on the colloidal Ag surface, the change in the Ag plasmonic peak is identical at a lower concentration (Fig. 35). Though their addition can cause nearly the same structure (Agnδ−Agδ+Nu−) at the early stages of oxidation of Ag particles, the presence of iodine causes a shift in the Fermi level of AgNPs towards a more positive potential, and iodide causes a shift towards a negative potential. This is a shift of the Fermi level towards a higher energy, i.e., negative potential is due to the charge transfer from the anion to the metal. With the increase in the concentration of the nucleophile, the intensity decreases and the peaks broaden. Generally, nucleophile adsorption results in a blue shift of the plasmonic peak, and electrophilic adsorption causes a red shift. The red shift upon the adsorption of charged or neutral electrophiles can be explained by either dipole–dipole interactions between adjacent particles258 or withdrawal of electron density from the metal surface by the adsorbed species.259 The first case appears when the adsorbed particles cause destabilization through agglomeration in the colloidal sol system. The second case arises upon adsorption of the cationic species on the metal surface and increases with an increase in the electropositivity of the cation. Here, the ionic strength is not a deciding factor as monovalent Ag ion shows a stronger effect on the absorption band than bivalent Cd and Ni. Fig. 35 represents a descriptive diagram of this phenomenon with the cations Cd(II), Ni(II), Ag(I), Hg(II). The slight blue shifts for Cd(II) and Hg(II) are due to the change in the refractive index directly on the surface of the Ag particles (extended Mie theory165,281) and amalgam formation. | ||
| Fig. 35 (A) Absorption spectrum of a silver sol before and after addition of various concentrations of I−. pH = 6.0. (B) Absorption spectrum of a silver sol before and after addition of various amounts of iodine. Reproduced from ref. 276 with permission from American Chemical Society. Copyright© 1993, American Chemical Society. (C) Absorbance in the maximum of the plasmon band of a 4.0 × 10⁻⁴ M silver sol as a function of the concentration of added metal perchlorates. The electrochemical potential of the metal is also indicated. The dashed part of the curve for Hg2+ indicates the region where the plasmon band undergoes a blue-shift. In all the other case, the decrease in absorbance is accompanied by a red-shift of the band. Reproduced from ref. 281 with permission from American Chemical Society. Copyright© 1998, American Chemical Society. | ||
5. Progressing research of plasmonic nanoparticles
The research on plasmonic NPs is continuously going on. We have seen in the aforementioned discussions that sphere, rod, belt, cube, star, triangle, crescent, etc. nanostructures of plasmonic NPs (mainly Au and Ag) are widely utilized for sensing, catalysis, solar-cell, biomedicine, environment technology, etc. Of late, core–shell structures are also fabricated that can utilize SPR for wide potential applications. Very recently, Zhang et al.282 reported SPR from core–shell particles in which the conventional mode from the energy is concentrated at the outer surface of the bimetallic NP, and the extraordinary mode from whose energy is concentrated at the interface between the core and the shell together determine the line shape of the extinction spectrum as well as the shift of the SPR peak (to shorter or longer wavelengths) as a function of various geometric parameters. Wei et al.10 represented the various fabrication approaches for core–shell structures. Mostly magnetic cores are synthesized from inexpensive and easily oxidised metals from the Fe group (Fe, Co. Ni, etc.). To protect them from environmental corrosion, oxidation and fast dissolution in acidic medium, some external coating is needed. In most of the cases, plasmonic materials (in certain cases Mg283 and carbon284 shell are also used) are used in a shell portion that modifies the magnetic properties of the core. Such core–shell structure NPs are widely used in the fields of biomedical (mainly in drug delivery, mineral and protein release10), environmental remediation by removal of weakly biodegradable dyes,10,284 catalysis,285 giant magnetoresistance sensing,286 etc.Thus, the field of SPR is gradually increasing. We have presented a short summary on the various aspects of SPR.
6. Conclusion and outlook
Nanoscience has now become one of the key branches of applied scientific endeavours. All of the major application manifestos of NPs are dependent mainly on the surface phenomenon relating to SPR. Thus, surface related activity, such as catalysis and scattering, including SERS and luminescence, are understood both by theory and experiments. In the present day scenario, the surface phenomenon has drawn attention from scientists as this controls the anomalous behavior of NPs with respect to the bulk counterpart. The SPR of a particle becomes size and shape dependent. The refractive index, temperature and dielectric constant of the medium are also additional controlling factors for SPR. Development in this field is fast. Not only the theoretical explanation of the physical properties of MNPs, but the SPR theory also enriches the selective applications. The sensing technique is suitable for real-time and label-free detection of analytes based on their specific interactions with antibodies bound to Au coated SPR chips. The LSPR sensing is far better than other methods of sensing applications. This makes those sensors appropriate for chemical and biological sensing. The kinetic study of binding with macromolecules is also possible due to its faster activity. The fabrication of a range of glucose sensors can be useful in preparing potential glucose sensing contact lenses for diabetic patients. This could be incorporated into disposable, plastic contact lenses for non-invasive and continuous monitoring of tears and blood glucose, alleviating eye autofluorescence and overexposure of the eye to UV radiation. Nowadays, medicinal chemistry and devices (photodetector, computer chip, etc.) are completely dependent on the SPR theory as the nanoworld is the predominating factor in the science world. The area of plasmonics is flourishing due to SPR. The key step towards the fabrication of devices with great potential in sensing, diagnosis and also in other practical uses is the proper engineering of the morphology and assembly of MNPs. The calculation of some nonlinear optical properties like second and third harmonic generation and four-wave mixing etc. opens new windows for optical research with various NPs. Thus, we expect that this review will be helpful to have a general idea of the role of SPR in real life applications, and further experimentations will enrich the scientific world.Abbreviations
| Ag | Silver |
| Ag3PO4 | Silver phosphate |
| Al | Aluminium |
| Ar | Argon |
| Au | Gold |
| Co | Cobalt |
| Cr | Chromium |
| Cu | Copper |
| CTAB | Cetyl trimethylammonium bromide |
| CTAC | Cetyltrimethylammonium chloride |
| CNT | Carbon nanotubes |
| DNA | Deoxyribonucleic acid |
| DSS | Decylsodium sulfate |
| Er | Erbium |
| Fe | Iron |
| Fe2O3 | Ferric oxide |
| Fe(bpy)32+ | Iron(II)-tris(2,2′-bipyridine) |
| HIV | Human immunodeficiency virus |
| Hg | Mercury |
| H2O2 | Hydrogen peroxide |
| H2S | Hydrogen sulfide |
| In | Indium |
| IgG | Immunoglobulin G |
| KBr | Potassium bromide |
| Mn | Manganese |
| MgF2 | Manganese fluoride |
| NaCl | Sodium chloride |
| NO2 | Nitrogen dioxide |
| Ni | Nickel |
| Pd | Palladium |
| Pt | Platinum |
| poly-HEMA | Polyhydroxyethylmethacrylate |
| PANI | Polyaniline |
| Rh | Rhodium |
| SiOx | Silicon oxide |
| SiFx | Silicon fluoride |
| SDS | Sodium dodecyl sulfate |
| SDBS | Sodium dodecyl benzene sulfonate |
| TiO2 | Titanium dioxide |
| Zn | Zinc |
| PMMA | Poly(methyl methacrylate) |
| 2D | Two dimensional |
| 3D | Three dimensional |
| ATR | Attenuated total reflection |
| CCD | Change coupled device |
| DDA | Discrete dipole approximation |
| EOT | Extraordinary electron transmission |
| FDTD | Finite-difference time-domain |
| HRS | Hyper Raman scattering |
| LSPR | Localized surface plasmon resonance |
| MEF | Metal enhanced fluorescence |
| NSOM | Near-field scanning microscopy |
| NIR | Near-infrared |
| NSL | Nanosphere lithography |
| NP | Nanoparticle |
| NSL | Nanosphere lithography |
| PR | Photoresist |
| QD | Quantum dot |
| SPR | Surface plasmon resonance |
| SPP | Surface plasmon polariton |
| SPW | Surface plasmon wave |
| SPRi | Surface plasmon resonance imaging |
| SERS | Surface-enhanced Raman scattering |
| SEM | Scanning electron microscopy |
| SESHG | Surface enhanced second harmonic generation |
| TEM | Transmission electron microscopy |
| CFU | Colony-forming unit |
References
- S. K. Ghosh and T. Pal, Chem. Rev., 2007, 107, 4797 CrossRef CAS PubMed.
- M. Ganguly, A. Pal, Y. Negishi and T. Pal, Langmuir, 2013, 29, 2033 CrossRef CAS PubMed.
- M. Brack, Rev. Mod. Phys., 1993, 65, 677 CrossRef CAS.
- C. Caucheteur, T. Guo and J. Albert, Anal. Bioanal. Chem., 2015, 407, 3883–3897 CrossRef CAS PubMed.
- M. V. Bashevoy, F. Jonsson, A. V. Krasavin and N. I. Zheludev, Nano Lett., 2006, 6, 1113 CrossRef CAS PubMed.
- T. Nagao, T. Hildebrandt, M. Henzler and S. Hasegawa, Phys. Rev. Lett., 2001, 86, 5747 CrossRef CAS PubMed.
- P. Johns, K. Yu, M. S. Devadas and G. V. Hartland, ACS Nano, 2016, 10, 3375 CrossRef CAS PubMed.
- A. Otto, Zeitschrift für Physik, 1968, 216, 398 CrossRef CAS.
- S. Zeng, D. Baillargeat, H.-P. Hod and K.-T. Yong, Chem. Soc. Rev., 2014, 43, 3426 RSC.
- S. Wei, Q. Wang, J. Zhu, L. Sun, H. Lin and Z. Guo, Nanoscale, 2011, 3, 4474 RSC.
- L. M. Liz-Marzán, C. J. Murphy and J. Wang, Chem. Soc. Rev., 2014, 43, 3820 RSC.
- H. A. Atwater and A. Polman, Nat. Mater., 2010, 9, 205 CrossRef CAS PubMed.
- S. Fahr, C. Rockstuhl and F. Lederer, Appl. Phys. Lett., 2009, 95, 121105 CrossRef.
- D. Pacifici, H. Lezec and H. A. Atwater, Nat. Photonics, 2007, 1, 402 CrossRef CAS.
- R. J. Walters, R. V. A. van Loon, I. Brunets, J. Schmitz and A. Polman, Nat. Mater., 2010, 9, 21 CrossRef CAS PubMed.
- J. R. Krenn and J. C. Weeber, Philos. Trans. R. Soc., A, 2004, 362, 739 CrossRef CAS PubMed.
- A. Drezet, A. L. Stepanov, H. Ditlbacher, A. Hohenau, B. Steinberger, F. R. Aussenegg, A. Leitner and J. R. Krenn, Appl. Phys. Lett., 2005, 86, 074104 CrossRef.
- M. Salerno, J. R. Krenn, B. Lamprecht, G. Schider, H. Ditlbacher, N. Felidj, A. Leitner and F. R. Aussenegg, Opto-Electron. Rev., 2002, 10, 217 Search PubMed.
- W. L. Barnes, A. Dereux and T. W. Ebbesen, Nature, 2003, 424, 824 CrossRef CAS PubMed.
- Y. S. Yamamoto, Y. Ozakic and T. Itohd, J. Photochem. Photobiol., C, 2014, 21, 81 CrossRef CAS.
- J. R. Krenn, H. Ditlbacher, G. Schider, A. Hohenau, A. Leitner and F. R. Aussenegg, J. Microsc., 2003, 209, 167–172 CrossRef CAS PubMed.
- S. A. Maier, M. D. Friedman, P. E. Barclay and O. Painter, Appl. Phys. Lett., 2005, 86, 071103 CrossRef.
- W. L. Barnes, A. Dereux and T. W. Ebbesen, Nature, 2003, 424, 824 CrossRef CAS PubMed.
- Z. Liu, J. M. Steele, W. Srituravanich, Y. Pikus, C. Sun and X. Zhang, Nano Lett., 2005, 5, 1726 CrossRef CAS PubMed.
- E. Ozbay, Science, 2006, 311, 189 CrossRef CAS PubMed.
- J. A. Schuller, E. S. Barnard, W. Cai, Y. C. Jun, J. S. White and M. L. Brongersma, Nat. Mater., 2010, 9, 193 CrossRef CAS PubMed.
- E. Laux, C. Genet, T. Skauli and T. W. Ebbesen, Nat. Photonics, 2008, 2, 161 CrossRef CAS.
- X. Zhang, X. Yan, Q. He, H. Wei, J. Long, J. Guo, H. Gu, J. Yu, J. Liu, D. Ding, L. Sun, S. We and Z. Guo, ACS Appl. Mater. Interfaces, 2015, 7, 6125 CAS.
- W. Deng, F. Xie, H. T. M. C. M. Baltar and E. M. Goldys, Phys. Chem. Chem. Phys., 2013, 15, 15695 RSC.
- M. Ganguly, J. Jana, C. Mondal, A. Pal and T. Pal, Phys. Chem. Chem. Phys., 2014, 16, 18185 RSC.
- J. Jana, M. Ganguly and T. Pal, Phys. Chem. Chem. Phys., 2015, 17, 2394 RSC.
- M. Ganguly, J. Pal, C. Mondal, A. Pal and T. Pal, Dalton Trans., 2015, 44, 4370–4379 RSC.
- E. L. Moal, E. Fort, S. L. Fort, F. P. Cordelieres, M. P. Fontaine-Aupart and C. Ricolleau, Biophys. J., 2007, 92, 2150 CrossRef PubMed.
- C. D. Geddes and J. R. Lakowicz, J. Fluoresc., 2002, 12, 121 CrossRef.
- M. Ganguly, A. Pal, Y. Negishi and T. Pal, Chem.–Eur. J., 2012, 18, 15845 CrossRef CAS PubMed.
- J. R. Lakowicz, Anal. Biochem., 2004, 324, 153 CrossRef CAS PubMed.
- G. W. Ford and W. H. Weber, Phys. Rep., 1984, 113, 195 CrossRef CAS.
- R. R. Chance, A. Prock and R. Silbey, Adv. Chem. Phys., 1978, 37, 1 CrossRef CAS.
- K. Aslan, J. Huang, G. M. Wilson and C. D. Geddes, J. Am. Chem. Soc., 2006, 128, 4206 CrossRef CAS PubMed.
- J. H. Song, T. Atay, S. Shi, H. Urabe and A. V. Nurmikko, Nano Lett., 2005, 5, 1557 CrossRef CAS PubMed.
- J. R. Lakowicz, M. H. Chowdhury, K. Ray, J. Zhang, Y. Fu, R. Badugu, C. R. Sabanayagam, K. Nowaczyk, H. Szmacinski, K. Aslan and C. D. Geddes, Proc. SPIE, 2006, 6099, 609909 CrossRef.
- Y. Zhang, A. Dragan and C. D. Geddes, J. Phys. Chem. C, 2009, 113, 12095 CAS.
- J. R. Lakowicz, Anal. Biochem., 2005, 337, 171 CrossRef CAS PubMed.
- A. Bek, R. Jansen, M. Ringler, S. Mayilo, T. A. Klarm and J. Feldmann, Nano Lett., 2008, 8, 485 CrossRef CAS PubMed.
- M. Ganguly, J. Pal, C. Mondal, A. Pal and T. Pal, Chem.–Eur. J., 2014, 20, 12470 CrossRef CAS PubMed.
- E. Susie and M. A. El-Sayed, Chem. Soc. Rev., 2006, 35, 209 RSC.
- J. R. Lakowicz, Anal. Biochem., 2001, 298, 1 CrossRef CAS PubMed.
- C. D. Geddes, H. Cao, I. Gryczynski, I. Z. Gryczynski, J. Fang and J. R. Lakowicz, J. Phys. Chem. A, 2003, 107, 3443 CrossRef CAS.
- K. Aslan, J. R. Lakowicz and C. D. Geddes, J. Phys. Chem. B, 2005, 109, 6247 CrossRef CAS PubMed.
- K. Aslan, Z. Leonenko, J. R. Lakowicz and C. D. Geddes, J. Phys. Chem. B, 2005, 109, 3157 CrossRef CAS PubMed.
- K. Aslan, M. Wu, J. R. Lakowicz and C. D. Geddes, J. Fluoresc., 2007, 17, 127 CrossRef CAS PubMed.
- K. Aslan, Z. Leonenko, J. R. Lakowicz and C. D. Geddes, J. Fluoresc., 2005, 15, 643–654 CrossRef CAS PubMed.
- W. Qin, W. Liu and M. Tan, Anal. Chim. Acta, 2002, 468, 287 CrossRef CAS.
- R. Gill, L. Tian, W. R. C. Somerville, E. C. L. Ru, H. V. Herbert van Amerongen and V. Subramaniam, J. Phys. Chem. C, 2012, 116, 16687 CAS.
- Y. Zhang, K. Aslan, M. J. R. Previte and C. D. Geddes, Appl. Phys. Lett., 2007, 90, 173116 CrossRef.
- P. P. Pompa, L. Martiradonna, A. Della Torre, F. Della Sala, L. Manna, M. De Vittorio, F. Calabi, R. Cingolani and R. Rinaldi, Nat. Nanotechnol., 2006, 1, 126 CrossRef CAS PubMed.
- E. Dulkeith, M. Ringler, T. A. Klar, J. Feldmann, J. A. Munoz and W. J. Parak, Nano Lett., 2005, 5, 585 CrossRef CAS PubMed.
- M. Ganguly, A. Pal and T. Pal, J. Phys. Chem. C, 2012, 116, 9265 CAS.
- K. Aslan, S. N. Malyn and C. D. Geddes, J. Fluoresc., 2007, 17, 7 CrossRef CAS PubMed.
- K. Aslan, S. N. Malyn and C. D. Geddes, Chem. Phys. Lett., 2008, 453, 222 CrossRef CAS PubMed.
- J. Lukomska, J. Malicka, Z. Gryczynski, Z. Leonenko and J. R. Lakowicz, Biopolymers, 2005, 77, 31 CrossRef CAS PubMed.
- Y. Zhang, K. Aslan, M. J. R. Previte and C. D. Geddes, Appl. Phys. Lett., 2007, 90, 173116 CrossRef.
- H. Mertens and A. Polman, in ArXiv e-prints, 2007, 711.
- H. Diehl, C. C. Hach and J. C. Bailar, Inorganic Syntheses, ed. L. F. Audrieth, John Wiley & Sons, Inc., Hoboken, NJ, USA, 1950, vol. 3, DOI:10.1002/9780470132340.ch53.
- G. B. Roy, Inorg. Chim. Acta, 2009, 362, 1709 CrossRef CAS.
- G. D. Liu, J. P. Liao, S. S. Huang, G. L. Shen and R. Q. Yu, Anal. Sci., 2001, 17, 1031 CrossRef CAS PubMed.
- P. Chen, R. Lu, P. Xue, T. Xu, G. Chen and Y. Zhao, Langmuir, 2009, 25, 8395 CrossRef CAS PubMed.
- M. L. Deda, M. Ghedini, I. Aiello and A. Grisolia, Chem. Lett., 2004, 33, 1060 CrossRef.
- C. E. White and F. Cuttitta, Anal. Chem., 1959, 31, 2083 CrossRef CAS.
- M. E. Germain and M. J. Knapp, Inorg. Chem., 2008, 47, 9748 CrossRef CAS PubMed.
- J. H. Lee, A. R. Jeong, I. S. Shin, H. J. Kim and J. I. Hong, Org. Lett., 2010, 12, 764 CrossRef CAS PubMed.
- I. Aoki, A. Takahashi and K. Watanabe, Anal. Sci., 1992, 8, 323 CrossRef CAS.
- H. Fares, H. Elhouichet, B. Gelloz and M. Féerid, J. Appl. Phys., 2015, 117, 193102 CrossRef.
- M. Ganguly, C. Mondal, J. Jana, A. Pal and T. Pal, Langmuir, 2014, 30, 4120 CrossRef CAS PubMed.
- J. Homola, Chem. Rev., 2008, 108, 462 CrossRef CAS PubMed.
- C. F. Bohren and D. R. Huffman, Absorption and Scattering of Light by Small Particles, Wiley, New York, 1983, p. 148 Search PubMed.
- D. Maystre, Theory of Wood's Anomalies, 2012, ch. 2, pp. 39–83 Search PubMed.
- E. Kretscbmann and H. Raether, Zeitschrift für Naturforschung A, 1968, 23, 2135–2136 Search PubMed.
- J. Homola, Anal. Bioanal. Chem., 2003, 377, 528–539 CrossRef CAS PubMed.
- A. K. Sharma, R. Jha and B. D. Gupta, IEEE Sens. J., 2007, 7, 1118–1129 CrossRef.
- A. L. Ghindilis, P. Atanasov, M. Wilkins and E. Wilkins, Biosens. Bioelectron., 1998, 13, 113–131 CrossRef CAS PubMed.
- X. Chu, Z. H. Lin, G. L. Shen and R. Q. M. Yu, Analyst, 1995, 120, 2829–2832 RSC.
- G. Gauglitz, Sensor Technology, 1996, 1, 1–48 CAS.
- T.-H. Lee, S.-W. Lee, J.-A. Jung, J. Ahn, M.-G. Kim and Y.-B. Shin, Sensors, 2010, 10, 2045–2053 CrossRef CAS PubMed.
- S. Zhu, C. L. Du and Y. Fu, Opt. Mater., 2009, 31, 1608–1613 CrossRef CAS.
- G. Sakai, S. Nakata, T. Uda, N. Miura and N. Yamazoe, Electrochim. Acta, 1999, 44, 3849 CrossRef CAS.
- H. Agrawal, A. M. Shrivastav and B. D. Gupta, Sens. Actuators, B, 2016, 227, 204–211 CrossRef CAS.
- C. Mouvet, R. D. Harris, C. Maciag, B. J. Luff, J. S. Wilkinson, J. Piehler, A. Brecht, G. Gauglitz, R. Abuknesha and G. Ismail, Anal. Chim. Acta, 1997, 338, 109 CrossRef CAS.
- R. D. Harris, B. J. Luff, J. S. Wilkinson, J. Piehler, A. Brecht, G. Gauglitz and R. A. Abuknesha, Biosens. Bioelectron., 1999, 14, 377 CrossRef CAS PubMed.
- N. Miura, K. Ogata, G. Sakai, T. Uda and N. Yamazoe, Chem. Lett., 1997, 26, 713 CrossRef.
- G. A. Baxter, J. P. Ferguson, M. C. O'Conner and C. T. Elliott, J. Agric. Food Chem., 2001, 49, 3204–3207 CrossRef CAS PubMed.
- G.-H. Yao, R.-P. Liang, C.-F. Huang, L. Zhang and J.-D. Qiu, Anal. Chim. Acta, 2015, 871, 28–34 CrossRef CAS PubMed.
- B. D. Spangler, E. A. Wilkinson, J. T. Murphy and B. J. Tyler, Anal. Chim. Acta, 2001, 444, 149–161 CrossRef CAS.
- A. Rasooly, J. Food Prot., 2001, 64, 37–43 CAS.
- P. M. Fratamico, T. P. Strobaugh, M. B. Medina and A. G. Gehring, Biotechnol. Tech., 1998, 12, 571–576 CrossRef CAS.
- V. Koubova, E. Brynda, L. Karasova, J. Škvor, J. Homola, J. Dostalek, P. Tobiška and J. Rošický, Sens. Actuators, B, 2001, 74, 100–105 CrossRef CAS.
- I. E. Sendroiu, L. K. Gifford, A. Luptak and R. M. Corn, J. Am. Chem. Soc., 2011, 133, 4271–4273 CrossRef CAS PubMed.
- S. Tombelli, M. Minunni, E. Luzi and M. Mascini, Bioelectrochemisty, 2005, 67, 135–141 CrossRef CAS PubMed.
- K. Gebhardt, A. Shokraei, E. Babaie and B. H. Lindqvist, Biochemistry, 2000, 39, 7255–7265 CrossRef CAS PubMed.
- A. Rhodes, N. Smithersd, T. Chapman, S. Parsons and S. Rees, FEBS Lett., 2001, 506, 85–90 CrossRef CAS PubMed.
- R. P. Van Duyne, A. J. Haes and A. D. McFarland, Proc. SPIE, 2003, 5223, 197–207 CrossRef CAS.
- K. L. Lee, J. B. Huang, J. W. Chang, S. H. Wu and P. K. Wei, Sci. Rep., 2015, 5, 8547 CrossRef PubMed.
- O. Tokel, U. H. Yildiz, F. Inci, N. G. Durmus, O. O. Ekiz, B. Turker, C. Cetin, S. Rao, K. Sridhar, N. Natarajan, H. Shafiee, A. Dana and U. Demirci, Sci. Rep., 2015, 5, 9152 CrossRef CAS PubMed.
- J. W. Chung, S. D. Kim, R. Bernhardt and J. C. Pyun, Sens. Actuators, B, 2005, 111, 416–422 CrossRef.
- B. Liedberg, C. Nylander and I. Lunström, Sens. Actuators, 1983, 4, 299–304 CrossRef CAS.
- R. L. Rich and D. G. Myszka, Anal. Biochem., 2007, 361, 1–6 CrossRef CAS PubMed.
- M. A. Hayat, Colloidal Gold, Principles, Methods and Applications, Academic Press, New York, 1989 Search PubMed.
- D. C. Cullen and C. R. Lowe, Sens. Actuators, B, 1990, 1, 576–579 CrossRef CAS.
- J. M. Bingham, J. N. Anker, L. E. Kreno and R. P. Van Duyne, J. Am. Chem. Soc., 2010, 132, 17358 CrossRef CAS PubMed.
- T. Karakouz, A. Vaskevich and I. Rubinstein, J. Phys. Chem. B, 2008, 112, 14530–14538 CrossRef CAS PubMed.
- S. Miwa and T. Arakawa, Thin Solid Films, 1996, 281–282, 466–468 CrossRef CAS.
- A. Abdelghani, J. M. Chovelon, N. Jaffrezic-Renault, C. Ronot-Trioli, C. Veillas and H. Gagnaire, Sens. Actuators, B, 1997, 38–39, 407 CrossRef.
- M. Niggemann, A. Katerkamp, M. Pellmann, P. Bolsmann, J. Reinbold and K. Cammann, Sens. Actuators, B, 1996, 34, 328 CrossRef CAS.
- R. P. Podgorsek, T. Sterkenburgh, J. Wolters, T. Ehrenreich, S. Nischwitz and H. Franke, Sens. Actuators, B, 1997, 39, 349–352 CrossRef CAS.
- G. J. Ashwell and M. P. S. Roberts, Electron. Lett., 1996, 32, 2089 CrossRef CAS.
- B. Chadwick and M. Gal, Appl. Surf. Sci., 1993, 68, 135 CrossRef CAS.
- R. Tabassum, S. K. Mishra and B. D. Gupta, Phys. Chem. Chem. Phys., 2013, 15, 11868 RSC.
- Y. Nishijima, H. Nigorinuma, L. Rosa and S. Juodkazis, Opt. Mater. Express, 2012, 2, 1367 CrossRef CAS.
- R. Gordon, D. Sinton, K. L. Kavanagh and A. G. Brolo, Acc. Chem. Res., 2008, 41, 1049 CrossRef CAS PubMed.
- A. Lesuffleur, H. Im, N. C. Lindquist and S. H. Oh, Appl. Phys. Lett., 2007, 90, 261104 CrossRef.
- N. L. Rosi and C. A. Mirkin, Chem. Rev., 2005, 105, 1547 CrossRef CAS PubMed.
- R. Elghanian, J. J. Storhoff, R. C. Mucic, R. L. Letsinger and C. A. Mirkin, Science, 1997, 277, 1078 CrossRef CAS PubMed.
- L. Gunnarsson, T. Rindzevicius, J. Prikulis, B. Kasemo, M. Kall, S. Zou and G. C. Schatz, J. Phys. Chem. B, 2005, 109, 1079 CrossRef CAS PubMed.
- H. Nakashima, K. Furukawa, Y. Kashimura and K. Torimitsu, Chem. Commun., 2007, 1080 RSC.
- C. L. Schofield, A. H. Haines, R. A. Field and D. A. Russell, Langmuir, 2006, 22, 6707 CrossRef CAS PubMed.
- J. Liu and Y. Lu, Angew. Chem., Int. Ed., 2006, 45, 90–94 CrossRef CAS PubMed.
- M. S. Han, A. K. R. Lytton-Jean and C. A. Mirkin, J. Am. Chem. Soc., 2006, 128, 4954–4955 CrossRef CAS PubMed.
- A. G. Kanaras, Z. Wang, M. Brust, R. Cosstick and A. D. Bates, Small, 2007, 3, 590 CrossRef CAS PubMed.
- Z. Wang, R. Levy, D. G. Fernig and M. Brust, J. Am. Chem. Soc., 2006, 128, 2214 CrossRef CAS PubMed.
- M. Nuopponen and H. Tenhu, Langmuir, 2007, 23, 5352 CrossRef CAS PubMed.
- N. H. Mack, J. W. Wackerly, V. Malyarchuk, J. A. Rogers, J. S. Moore and R. G. Nuzzo, Nano Lett., 2007, 7, 733 CrossRef CAS PubMed.
- H. Jiang, J. Markowski and J. Sabarinathan, Opt. Express, 2009, 17, 21802 CrossRef CAS PubMed.
- C. T. Campbell and G. Kim, Biomaterials, 2007, 28, 2380 CrossRef CAS PubMed.
- B. Rothenhäusler and W. Knoll, Nature, 1988, 332, 615 CrossRef.
- G. Spoto and M. Minunni, J. Phys. Chem. Lett., 2012, 3, 2682 CrossRef CAS PubMed.
- S. Scarano, M. Mascini, A. P. F. Turner and M. Minunni, Biosens. Bioelectron., 2010, 25, 957 CrossRef CAS PubMed.
- M. Ito, F. Nakamura, A. Baba, K. Tamada, H. Ushijima, K. H. A. Lau, A. Manna and W. Knoll, J. Phys. Chem. C, 2007, 111, 11653 CAS.
- R. D'Agata, R. Corradini, G. Grasso, R. Marchelli and G. Spoto, ChemBioChem, 2008, 9, 2067 CrossRef PubMed.
- R. D'Agata, R. Corradini, C. Ferretti, L. Zanoli, M. Gatti, R. Marchelli and G. Spoto, Biosens. Bioelectron., 2010, 25, 2095 CrossRef PubMed.
- R. D'Agata, G. Breveglieri, L. M. Zanoli, M. Borgatti, G. Spoto and R. Gambari, Anal. Chem., 2011, 83, 8711 CrossRef PubMed.
- L. K. Gifford, I. E. Sendroiu, R. M. Corn and A. Lupták, J. Am. Chem. Soc., 2010, 132, 9265–9267 CrossRef CAS PubMed.
- W. Zhou, Y. Chen and R. M. Corn, Anal. Chem., 2011, 83, 3897–3902 CrossRef CAS PubMed.
- T. H. Seefeld, A. R. Halpern and R. M. Corn, J. Am. Chem. Soc., 2012, 134, 12358–12361 CrossRef CAS PubMed.
- E. Sackmann, Science, 1996, 271, 43–48 CAS.
- S. Joshi, P. Pellacani, T. A. van Beek, H. Zuilhof and M. W. F. Nielen, Sens. Actuators, B, 2015, 209, 505–514 CrossRef CAS.
- I. H. El-Sayed, X. Huang and M. A. El-Sayed, Cancer Lett., 2006, 239, 129–135 CrossRef CAS PubMed.
- X. Huang, P. K. Jain, I. H. El-Sayed and M. A. El-Sayed, Photochem. Photobiol., 2006, 82, 412–417 CrossRef CAS PubMed.
- K. M. Mayer and J. H. Hafner, Chem. Rev., 2011, 111, 3828–3857 CrossRef CAS PubMed.
- H. Hou, L. Chen, H. He, L. Chen, Z. Zhao and Y. Jin, J. Mater. Chem. B, 2015, 3, 5189 RSC.
- L. D. Mello and L. T. Kubota, Food Chem., 2002, 77, 237–256 CrossRef CAS.
- H. Wang, X. Guo, S. Fu, T. Yang, Y. Wen and H. Yang, Food Chem., 2015, 188, 137–142 CrossRef CAS PubMed.
- A. Monkawa, T. Nakagawa, H. Sugimori, E. Kazawa, K. Sibamoto, T. Takei and M. Haruta, Sens. Actuators, B, 2014, 196, 1 CrossRef CAS.
- M. Benounis, N. Jaffrezic, C. Martelet, I. Dumazet-Bonnamour and R. Lamartine, Mater. Trans., 2015, 56, 539 CrossRef CAS.
- R. Tabassum and B. D. Gupta, Plasmonics, 2016, 11, 483–492 CrossRef CAS.
- W. Hou and S. B. Cronin, Adv. Funct. Mater., 2013, 23, 1612–1619 CrossRef CAS.
- Y. Tian and T. Tatsuma, J. Am. Chem. Soc., 2005, 127, 7632–7637 CrossRef CAS PubMed.
- C. G. Silva, R. Juárez, T. Marino, R. Molinari and H. García, J. Am. Chem. Soc., 2011, 133, 595–602 CrossRef PubMed.
- J. Yu, G. Dai and B. Huang, J. Phys. Chem. C, 2009, 113, 16394–16401 CAS.
- Y. Lu, H. T. Yu, S. Chen, X. Quan and H. M. Zhao, Environ. Sci. Technol., 2012, 46, 1724–1730 CrossRef CAS PubMed.
- A. Kay, I. Cesar and M. Gratzel, J. Am. Chem. Soc., 2006, 128, 15714–15721 CrossRef CAS PubMed.
- K. Awazu, M. Fujimaki, C. Rockstuhl, J. Tominaga, H. Murakami, Y. Ohki, N. Yoshida and T. Watanabe, J. Am. Chem. Soc., 2008, 130, 1676–1680 CrossRef CAS PubMed.
- H. Zhang, H. Huang, H. Ming, H. Li, L. Zhang, Y. Liu and Z. Kang, J. Mater. Chem., 2012, 22, 10501–10506 RSC.
- H. J. Huang, B.-H. Liu and J. Andrew Yeh, Catal. Commun., 2013, 36, 16–19 CrossRef CAS.
- H. Gao, C. Liu, H. E. Jeong and P. Yang, ACS Nano, 2012, 6, 234–240 CrossRef CAS PubMed.
- J. Pal, A. K. Sasmal, M. Ganguly and T. Pal, J. Phys. Chem. C, 2015, 119, 3780–3790 CAS.
- L. Novotny and B. Hecht, Principles of Nano-Optics, Cambridge University Press, New York, 2006 Search PubMed.
- V. Giannini, A. I. Fernandez-Domínguez, S. C. Heck and S. A. Maier, Chem. Rev., 2011, 111, 3888–3912 CrossRef CAS PubMed.
- M. A. Garcia, J. Phys. D: Appl. Phys., 2011, 44, 283001 CrossRef.
- W. Ding, R. Bachelot, S. Kostcheev, P. Royer and R. E. De Lamaestre, J. Appl. Phys., 2010, 108, 124314–124319 CrossRef.
- N. Verellen, Y. Sonnefraud, H. Sobhani, F. Hao, V. V. Moshchalkov, P. V. Dorpe and P. Nordlander, Nano Lett., 2009, 9, 1663–1667 CrossRef CAS PubMed.
- E. K. Payne, K. L. Shuford, S. Park, G. C. Schatz and C. A. Mirkin, J. Phys. Chem. B, 2006, 110, 2150 CrossRef CAS PubMed.
- X. Xuan, S. Xu, Y. Liu, H. Li, W. Xu and J. R. Lombardi, J. Phys. Chem. Lett., 2012, 3, 2773–2778 CrossRef CAS.
- S. Neretina, W. Qian, E. C. Dreaden, M. A. El-Sayed, R. A. Hughes, J. S. Preston and P. Mascher, Nano Lett., 2009, 9, 1242–1248 CrossRef CAS PubMed.
- M. P. Singh and G. F. Strouse, J. Am. Chem. Soc., 2010, 132, 9383–9391 CrossRef CAS PubMed.
- D. M. O'Carroll, C. E. Hofmann and H. A. Atwater, Adv. Mater., 2010, 22, 1223–1227 CrossRef PubMed.
- T. Ming, L. Zhao, Z. Yang, H. Chen, L. Sun, J. Wang and C. Yan, Nano Lett., 2009, 9, 3896–3903 CrossRef CAS PubMed.
- T. H. Taminiau, F. D. Stefani, F. B. Segerink and N. F. V. Hulst, Nat. Photonics, 2008, 2, 234–237 CrossRef CAS.
- X. Xuan, S. Xu, Y. Liu, H. Li, W. Xu and J. R. Lombardi, J. Phys. Chem. Lett., 2012, 3, 2773–2778 CrossRef CAS.
- T. Grosjean, M. Mivelle, F. I. Baida, G. W. Burr and U. C. Fischer, Nano Lett., 2011, 11, 1009–1013 CrossRef CAS PubMed.
- M. W. Knight, L. Liu, Y. Wang, L. Brown, S. Mukherjee, N. S. King, H. O. Everitt, P. Nordlander and N. J. Halas, Nano Lett., 2012, 12, 6000–6004 CrossRef CAS PubMed.
- F. J. G. de Abajo, Rev. Mod. Phys., 2010, 82, 209–275 CrossRef.
- H. A. Atwater and A. Polman, Nat. Mater., 2010, 9, 205 CrossRef CAS PubMed.
- M. Lee, J. U. Kim, K. J. Lee, S. H. Ahn, Y.-B. Shin, J. Shin and C. B. Park, ACS Nano, 2015, 9, 6206–6213 CrossRef CAS PubMed.
- D. Vercruysse, Y. Sonnefraud, N. Verellen, F. B. Fuchs, G. D. Martino, L. Lagae, V. V. Moshchalkov, S. A. Maier and P. V. Dorpe, Nano Lett., 2013, 13, 3843–3849 CrossRef CAS PubMed.
- M. Righini, P. Ghenuche, S. Cherukulappurath, V. Myroshnychenko, F. J. García de Abajo and R. Quidant, Nano Lett., 2009, 9, 3387–3391 CrossRef CAS PubMed.
- J.-H. Lee, M.-H. You, G.-H. Kim and J.-M. Nam, Nano Lett., 2014, 14, 6217–6225 CrossRef CAS PubMed.
- Y. S. Yamamoto, M. Ishikawa, Y. Ozaki and T. Itoh, Frontiers of Physics, 2014, 9, 31–46 CrossRef.
- S. Sarkar, M. Pradhan, A. K. Sinha, M. Basu and T. Pal, Chem.–Eur. J., 2012, 18, 6335–6342 CrossRef CAS PubMed.
- S. Kundu, M. Mandal, S. K. Ghosh and T. Pal, J. Colloid Interface Sci., 2004, 272, 134–144 CrossRef CAS PubMed.
- Z. Zhang and T. Imae, J. Colloid Interface Sci., 2001, 233, 107 CrossRef CAS PubMed.
- H. A. Clark, P. J. Campagnola, J. P. Wuskell, A. Lewis and L. M. Loew, J. Am. Chem. Soc., 2000, 122, 10234 CrossRef CAS.
- J. R. Small, N. S. Foster, J. E. Amonette and T. Autrey, Appl. Spectrosc., 2000, 54, 1142 CrossRef CAS.
- Z. V. Saponjic, R. Csencsits, T. Rajh and N. M. Dimitrijevic, Chem. Mater., 2003, 15, 4521 CrossRef CAS.
- M. Litorja, C. L. Haynes, A. J. Haes, T. R. Jensen and R. P. V. Duyne, J. Phys. Chem. B, 2001, 105, 6907 CrossRef CAS.
- Y. Xiong, J. M. McLellan, J. Chen, Y. Yin, Z.-Y. Li and Y. Xia, J. Am. Chem. Soc., 2005, 127, 17118–17127 CrossRef CAS PubMed.
- M. A. Mahmoud, C. E. Tabor and M. A. El-Sayed, J. Phys. Chem. C, 2009, 113, 5493–5501 CAS.
- A. D. McFarland, M. A. Young, J. A. Dieringer and R. P. Van Duyne, J. Phys. Chem. B, 2005, 109, 11279–11285 CrossRef CAS PubMed.
- C. L. Haynes and R. P. Van Duyne, J. Phys. Chem. B, 2003, 107, 7426–7433 CrossRef CAS.
- S. Jana, S. Pande, A. K. R. Sinha, S. Sarkar, M. Pradhan, M. Basu, S. Saha and T. Pal, J. Phys. Chem. C, 2009, 113, 1386–1392 CAS.
- Y. Jing, H. Wang, X. Chen, X. Wang, H. Wei and Z. Guo, Appl. Surf. Sci., 2014, 316, 66 CrossRef CAS.
- S. Sarkar, M. Pradhan, A. K. Sinha, M. Basu and T. Pal, J. Phys. Chem. Lett., 2010, 1, 439–444 CrossRef CAS.
- M. Tabatabaei, M. Najiminaini, K. Davieau, B. Kaminska, M. R. Singh, J. J. L. Carson and F. Lagugné-Labarthet, ACS Photonics, 2015, 2, 752–759 CrossRef CAS.
- J. Butet and O. J. F. Martin, J. Phys. Chem. C, 2015, 119, 15547–15556 CAS.
- H. Chi Zhang, Y. Fan, J. Guo, X. Fu and T. J. Cui, ACS Photonics, 2016, 3, 139–146 CrossRef.
- A. Wokaun, J. P. Gordon and P. F. Liao, Phys. Rev. Lett., 1982, 48, 957–960 CrossRef CAS.
- I. I. Smolyaninov, C. H. Lee, C. C. Davis and S. Rudin, J. Microsc., 1999, 194, 532–536 CrossRef CAS PubMed.
- A. C. R. Pipino, G. C. Schatz and R. P. Van Duyne, Phys. Rev. B: Condens. Matter Mater. Phys., 1996, 53, 4162–4169 CrossRef CAS.
- R. McGurn, T. A. Leskova and V. M. Agranovich, Phys. Rev. B: Condens. Matter Mater. Phys., 1991, 44, 11441 CrossRef.
- J. W. Haus, N. Kalyaniwalla, R. Inguva, M. Bloemer and C. M. Bowden, J. Opt. Soc. Am. B, 1989, 6, 797–807 CrossRef CAS.
- Y. Tsutsui, T. Hayakawa, G. Kawamura and M. Nogami, Nanotechnology, 2011, 22, 275203 CrossRef PubMed.
- H. B. Liao, R. F. Xiao, H. Wang, K. S. Wong and G. K. L. Wong, Appl. Phys. Lett., 1998, 72, 1817 CrossRef CAS.
- J.-Y. Fang, S.-Q. Qin, X.-A. Zhang, Y.-M. Nie and F. Wang, RSC Adv., 2012, 2, 11777–11785 RSC.
- S. Link and M. A. El-Sayed, Int. Rev. Phys. Chem., 2000, 19, 409–453 CrossRef CAS.
- H. Metiu and P. Das, Annu. Rev. Phys. Chem., 1984, 35, 507 CrossRef CAS.
- J. I. Gersten and A. Nitzan, J. Chem. Phys., 1980, 73, 3023 CrossRef CAS.
- D.-S. Wang, H. Chew and M. Kerker, Appl. Opt., 1980, 19, 2256 CrossRef CAS PubMed.
- M. Moskovits, J. Chem. Phys., 1978, 69, 4159 CrossRef CAS.
- M. Moskovits, Solid State Commun., 1978, 32, 59 CrossRef.
- J. I. Gersten, J. Chem. Phys., 1980, 72, 5779 CrossRef CAS.
- M. Kerker, D. S. Wang and H. Chew, Appl. Opt., 1980, 19, 3373 CrossRef CAS PubMed.
- C. Y. Chen and E. Burstem, Phys. Rev. Lett., 1980, 45, 1278 CrossRef.
- U. Kreibig and M. Vollmer, Optical Properties of Metal Clusters, Springer Series in Materials Science, Springer, Berlin, 1995, vol. 25 Search PubMed.
- J. Kevin, M. G. Giacomelli and A. Wax, J. Opt. Soc. Am. A, 2008, 25, 1866–1874 CrossRef.
- K. S. Lee and M. A. El-Sayed, J. Phys. Chem. B, 2006, 110, 19220 CrossRef CAS PubMed.
- R. Gans, Ann. Phys., 1912, 342, 881–900 CrossRef.
- E. Ringe, M. R. Langille, K. Sohn, J. Zhang, J. Huang, C. A. Mirkin, R. P. Van Duyne and L. D. Marks, J. Phys. Chem. Lett., 2012, 3, 1479–2148 CrossRef CAS PubMed.
- H. J. Chen, X. S. Kou, Z. Yang, W. H. Ni and J. F. Wang, Langmuir, 2008, 24, 5233 CrossRef CAS PubMed.
- C. L. Nehl, H. W. Liao and J. H. Hafner, Nano Lett., 2006, 6, 683 CrossRef CAS PubMed.
- L. J. Sherry, R. Jin, C. A. Mirkin, G. C. Schatz and R. P. Van Duyne, Nano Lett., 2006, 6, 2060 CrossRef CAS PubMed.
- M. Liu and P. Guyot-Sionnest, J. Phys. Chem. B, 2005, 109, 22192 CrossRef CAS PubMed.
- R. Bukasov and J. S. Shumaker-Parry, Nano Lett., 2007, 7, 1113 CrossRef CAS PubMed.
- M. A. Mahmoud, B. Snyder and M. A. El-Sayed, J. Phys. Chem. C, 2010, 114, 7436–7443 CAS.
- A. L. Schmucker, N. Harris, M. J. Banholzer, M. G. Blaber, K. D. Osberg, G. C. Schatz and C. A. Mirkin, ACS Nano, 2010, 4, 5453–5463 CrossRef CAS PubMed.
- R. H. Ritchie, Surf. Sci., 1973, 34, 1 CrossRef CAS.
- K. Mallik, M. Mandal, N. Pradhan and T. Pal, Nano Lett., 2001, 1, 319–322 CrossRef CAS.
- E. Ringe, J. Zhang, M. R. Langille, K. Sohn, C. M. Cobley, L. Au, Y. Xia, C. A. Mirkin, J. Huang, L. D. Marks and R. P. Van Duyne, Mater. Res. Soc. Symp. Proc., 2010, 1208, O10-02 Search PubMed.
- C. L. Haynes, A. J. Haes and R. P. Van Duyne, Mater. Res. Soc. Symp. Proc., 2001, 635, C6.3.1–C6.3.6 Search PubMed.
- W. Haiss, N. T. K. Thanh, J. Aveyard and D. G. Fernig, Anal. Chem., 2007, 79, 4215–4221 CrossRef CAS PubMed.
- S. Peng, J. M. McMahon, G. C. Schatz, S. K. Gray and Y. Sun, Proc. Natl. Acad. Sci. U. S. A., 2010, 107, 14530–14534 CrossRef CAS PubMed.
- K. L. Kelly, E. Coronado, L. L. Zhao and G. C. Schatz, J. Phys. Chem. B, 2003, 107, 668–677 CrossRef CAS.
- T. K. Sau, A. Pal and T. Pal, J. Phys. Chem. B, 2001, 105, 9266–9272 CrossRef CAS.
- N. R. Jana, T. K. Sau and T. Pal, J. Phys. Chem. B, 1999, 103, 115–121 CrossRef CAS.
- K. A. Willets and R. P. Van Duyne, Annu. Rev. Phys. Chem., 2007, 58, 267–297 CrossRef CAS PubMed.
- B. D. Gates, Qi. Xu, M. Stewart, D. Ryan, C. G. Willson and G. M. Whitesides, Chem. Rev., 2005, 105, 1171–1196 CrossRef CAS PubMed.
- C. L. Haynes and R. P. Van Duyne, J. Phys. Chem. B, 2001, 105, 5599–5611 CrossRef CAS.
- T. R. Jensen, R. P. Van Duyne, S. A. Johnson and V. A. Maroni, Appl. Spectrosc., 2000, 54, 371–377 CrossRef CAS.
- T. R. Jensen, M. D. Malinsky, C. L. Haynes and R. P. Van Duyne, J. Phys. Chem. B, 2000, 104, 10549–10556 CrossRef CAS.
- J. C. Hulteen, D. A. Treichel, M. T. Smith, M. L. Duval, T. R. Jensen and R. P. Van Duyne, J. Phys. Chem. B, 1999, 103, 3854–3863 CrossRef CAS.
- R. Micheletto, H. Fukuda and M. Ohtsu, Langmuir, 1995, 11, 3333–3336 CrossRef CAS.
- G. Cunge, P. Chabert and J. Booth, Plasma Sources Sci. Technol., 1997, 6, 349–360 CrossRef CAS.
- S. Lal, J. H. Hafner, N. J. Halas, S. Link and P. Nordlander, Acc. Chem. Res., 2012, 45, 1887 CrossRef CAS PubMed.
- L. J. E. Anderson, C. M. Payne, Y.-R. Zhen, P. Nordlanderm and J. H. Hafner, Nano Lett., 2011, 11, 5034 CrossRef CAS PubMed.
- H.-A. Chen, H.-Y. Lin and H.-N. Lin, J. Phys. Chem. C, 2010, 114, 10359 CAS.
- J. Aizpurua, P. Hanarp, D. S. Sutherland, M. Kall, G. W. Bryant and F. J. Garcia de Abajo, Phys. Rev. Lett., 2003, 90, 057401 CrossRef CAS PubMed.
- A. Cleary, A. Clark, A. Glidle, J. M. Cooper and D. Cumming, Microelectron. Eng., 2009, 86, 1146–1149 CrossRef CAS.
- T. Yanagishita, K. Nishio and H. Masuda, Adv. Mater., 2005, 17, 2241–2243 CrossRef CAS.
- T. Linnert, P. Mulvaney and A. Henglein, Ber. Bunsen-Ges. Phys. Chem., 1991, 95, 838 CrossRef CAS.
- R. Jin, Y. W. Cao, C. A. Mirkin, K. L. Kelly, G. C. Schatz and J. G. Zheng, Science, 2001, 294, 1901 CrossRef CAS PubMed.
- N. Zhao, Y. Wei, N. J. Sun, Q. J. Chen, J. W. Bai, L. P. Zhou, Y. Qin, M. X. Li and L. M. Qi, Langmuir, 2008, 24, 991 CrossRef CAS PubMed.
- G. S. Métraux and C. A. Mirkin, Adv. Mater., 2005, 17, 412 CrossRef.
- C. Xue and C. A. Mirkin, Angew. Chem., Int. Ed., 2007, 46, 2036 CrossRef CAS PubMed.
- S. Chen and D. L. Carroll, Nano Lett., 2002, 2, 1003 CrossRef CAS.
- C. S. Ah, Y. J. Yun, H. J. Park, W.-J. Kim, D. H. Ha and W. S. Yun, Chem. Mater., 2005, 17, 5558 CrossRef CAS.
- B. Wiley, Y. Sun, J. Chen, H. Cang, Z.-Y. Li, X. Li and Y. Xia, MRS Bull., 2005, 30, 356 CrossRef CAS.
- J. E. Millstone, G. S. Métraux and C. A. Mirkin, Adv. Funct. Mater., 2006, 16, 1209 CrossRef CAS.
- R. Jin, Y. C. Cao, E. Hao, G. S. Métraux, G. C. Schatz and C. A. Mirkin, Nature, 2003, 425, 487 CrossRef CAS PubMed.
- S. Link and M. A. El-Sayed, J. Phys. Chem. B, 1999, 103, 4212–4217 CrossRef CAS.
- U. Kreibig, J. Phys. F: Met. Phys., 1974, 4, 999 CrossRef CAS.
- U. Kreibig, J. Phys., 1977, 38, C2–C97 Search PubMed.
- O. A. Yeshchenko, I. S. Bondarchuk, A. A. Alexeenko and A. V. Kotko, Funct. Mater., 2013, 20, 357 CrossRef CAS.
- R. H. Doremus, J. Chem. Phys., 1965, 42, 414 CrossRef CAS.
- R. H. Doremus, J. Chem. Phys., 1964, 40, 2389 CrossRef.
- C. Kittel, Introduction to Solid State Physics, Wiley, New York, 1996 Search PubMed.
- J. W. Haus, N. Kalyaniwalla, R. Inguva, M. Bloemer and C. M. Bowden, J. Opt. Soc. Am. B, 1989, 6, 797–880 CrossRef CAS.
- S. K. Ghosh, S. Nath, S. Kundu, K. Esumi and T. Pal, J. Phys. Chem. B, 2004, 108, 13963–21397 CrossRef CAS.
- T. Llnaert, P. Mulvaney and A. Henglein, J. Phys. Chem., 1993, 97, 679 CrossRef.
- M. D. Scanlon, P. Peljo and M. A. Métraux, Chem. Sci., 2015, 6, 2705 RSC.
- A. Henglein and M. Giersig, J. Phys. Chem. B, 1999, 103, 9533–9539 CrossRef CAS.
- P. Mulvaney, M. Giersig and A. Henglein, J. Phys. Chem., 1992, 96, 10419–10424 CrossRef CAS.
- M. Maillard, P. Huang and L. Brus, Nano Lett., 2003, 3, 1611–1615 CrossRef CAS.
- A. Henglein, Chem. Mater., 1998, 10, 440 CrossRef.
- C. Zhang, B.-Q. Chen, Z.-Y. Li and Y. Xia, J. Phys. Chem. C, 2015, 119, 16836–16845 CAS.
- K. J. Klabunde, D. Zhang, G. N. Glavee, C. M. Sorensen and G. C. Hadjipanayis, Chem. Mater., 1994, 6, 784 CrossRef CAS.
- D. Zhang, S. Wei, D. P. Young and Z. Guo, Nanoscale, 2010, 2, 917 RSC.
- J. Bao, J. He, Y. Zhang, Y. Yoneyama and N. Tsubaki, Angew. Chem., Int. Ed., 2008, 47, 353 CrossRef CAS PubMed.
- J. Q. Xiao, J. S. Jiang and C. L. Chien, Phys. Rev. Lett., 1992, 68, 3749 CrossRef CAS PubMed.
| This journal is © The Royal Society of Chemistry 2016 |


