Preparation and physical property assessments of liquid-core hydrogel beads loaded with burdock leaf extract

Fu-Hsuan Tsaiab, Po-Yuan Chiang*a, Yutaka Kitamurac, Mito Kokawac and Nauman Khalidd
aDepartment of Food Science and Biotechnology, National Chung Hsing University, 250 Kuokuang Road, Taichung 40227, Taiwan, Republic of China. E-mail: pychiang@chu.edu.tw; Fax: +8864 2285 1665; Tel: +8864 2285 1665
bGraduate School of Life and Environmental Sciences, University of Tsukuba, 1-1-1 Tennodai, Tsukuba, Ibaraki 305-8577, Japan
cFaculty of Life and Environmental Sciences, University of Tsukuba, 1-1-1 Tennodai, Tsukuba, Ibaraki 305-8577, Japan
dThe Alliance for Research on North Africa, University of Tsukuba, 1-1-1 Tennodai, Tsukuba, Ibaraki 305-8572, Japan

Received 28th May 2016 , Accepted 2nd September 2016

First published on 5th September 2016


Abstract

Secondary gelation is an important but overlooked element which has a significant impact on the quality of liquid-core hydrogel beads (LHB). This study firstly searches the optimized extraction conditions of burdock leaf and analyses its functional compounds and antioxidant abilities. Then, we measure loading efficiency, relative hardness, swelling capacity, and outer appearance to evaluate the optimized preparation conditions of LHB loaded with burdock leaf extract (BLE). The results showed that the optimized extraction conditions of burdock leaf were a solid to liquid (95% ethanol) ratio of 1[thin space (1/6-em)]:[thin space (1/6-em)]3, and extraction at 80 °C for 90 min. This extraction contained 23.81 mg g−1 dw chlorogenic acids (CGA) and the DPPH scavenging activity was 59.49%. LHB prevented the DPPH scavenging ability of BLE from decreasing during storage. The diameter and swelling capacity of burdock LHB increased, and hardness and loading efficiency decreased with longer gelation times. Relative hardness of the LHB prepared by 1% CaCl2 in the secondary gelation was 5.6-fold higher than that of the control, but there was no significant difference in CGA loading efficiency.
1. Introduction

Burdock (Arctium lappa L.) is an important cultivar in Asia, sometimes called “the king of vegetables”. Because the root, leaf, seed, and stem contain an abundance of dietary fiber and nutrients, it is widely preferred in medicine and health care, and by consumers.1 Currently, the burdock root is mainly consumed, and a lot of residue including the leaf and stem are disposed of as waste during harvesting and processing every year, which creates significant food waste for producers.

In the last few decades, the demand for functional food has increased considerably, and novel and undeveloped ingredients with high functionality have been searched for. Recently, much attention has been devoted to the recycling of cultivar by-products and wastes during harvesting and processing. Burdock leaf is the waste after harvesting the burdock root. It contains an abundance of phenolic compounds, including chlorogenic acid (CGA), caffeic acid, rutin, cynarin, and quercetin, and is used for detoxifying and heat-clearing in Chinese traditional medicine.2 The predominant polyphenol in burdock is CGA, an important natural antioxidant which is more accessible than many flavonoids, and which relates to the bioavailability of many antibacterial, antimutagen, and anti-inflammatory compounds.3–6 Reusing of the by-products of burdock as a new natural and functional ingredient would not only contribute to cutting down the waste production but also to upgrading the value of the burdock plant.

Capsulation is a technique where the coating or embedding materials surround a specific compound into a matrix, producing small capsules with many properties. This technique has been used for many years in the pharmaceutical industry to design delivery systems, and in the food industry to protect functional components.7 Hydrogel bead is a type of capsulation, which has been widely used to reduce the reactivity between the specific compound and environmental factors; to adjust the controlled-release ability of the core material; to make the material easier to handle; to change the appearance of materials; to cover bad flavors.8 Generally, basic hydrogel beads, which are wholly formed from the gelated gel, are produced by mixing specific compounds and wall materials such as alginate, and then extruding the mixture into a curing agent, such as calcium solution. The osmotic gradient between the mixture droplet and calcium solution causes the calcium ions (Ca2+) to permeate into the droplet, making the structure of calcium alginate. The wall material plays an important role in protecting the core and controlling its release.9 Alginate has been used in food and biopharmaceutical techniques, as carriers for specific delivery and controlled release of functional compounds.10,11 The most important property of alginates is their ability to form gels by reaction between its carboxyl group and divalent cations such as calcium ions. Sodium ions in alginate polymer are replaced by these divalent cations to form an egg-box structure.10 However, the process cannot be used to capsulate compounds or materials which have low pH or low polarity, for example, acid or alcoholic solutions, because they would cause alginate gelation to occur before the alginate combines with calcium ions.

On the other hand, liquid-core hydrogel beads (LHB) are formed by a droplet surrounded by a thin layer of membrane. In a cell delivery system, liquid-core allows cells to grow to a greater and uniform density.12 The liquid-core hydrogel beads are prepared by first mixing specific compounds and the calcium source. Then the mixture is extruded into alginate. The calcium ions diffuse from the droplet into the surrounding alginate, forming a water-insoluble calcium alginate outer-layer. This method can be used to encapsulate a broader range of materials than the basic encapsulation method.

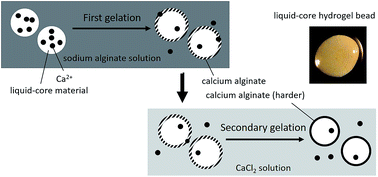
Previous studies indicate that LHB need an additional hardening process after the calcium alginate outer-layer is formed.13–15 However, there is no paper that clearly defines the step in which the LHB are resuspended into the curing agent. Herein, in this study, we named the step of suspending the calcium solution into sodium alginate (SA) as “first gelation”, and the step of additional hardening as “secondary gelation” (Fig. 1). We provided the first report on the effect of secondary gelation on physical properties of LHB.


image file: c6ra13843h-f1.tif
Fig. 1 Gelation mechanism of LHB.

This study searches for the optimal extraction conditions of burdock leaf and then analyzes the total phenolic compounds, total flavonoid, the amount of chlorogenic acid, and antioxidant abilities in extracts. Secondly, LHB are prepared from the burdock leaf extracts (BLE) and their physical properties, i.e., diameter, swelling capacity (SC), relative hardness, and chlorogenic acid loading efficiency (CGA LE), are evaluated.

2. Materials and methods

2.1. Materials

Burdock leaves were obtained from a local farmer. Following washing and cutting, the leaves were stored at −80 °C. Food grade SA (low viscosity; 160–200 mPa s of 2% solution) was purchased from Gemfont Corporation (Taiwan) and chitosan (degree of deacetylation approximately 85%; molecular weight of approximately 300 kDa) was purchased from G&B Corporation (Taiwan). Other chemicals in the investigation were of analytical grade. Citric acid, ethanol, calcium chloride (CaCl2), sodium carbonate (Na2CO3), aluminum chloride (AlCl3·6H2O), sodium hydrogen phosphate (Na2HPO4), sodium dihydrogen phosphate (NaH2PO4), methanol, acetic acid, potassium ferricyanide (K3Fe(CN)6), and ferric chloride (FeCl3) were purchased from Union Chemical Works Ltd. (Taiwan). Folin–Ciocalteu reagent was purchased from Merck Millipore Corporation (USA). Gallic acid, quercetin, chlorogenic acid, butylated hydroxyanisole (BHA), and α,α-diphenyl-β-picrylhydrazyl (DPPH) were purchased from Sigma-Aldrich (USA).

2.2. Extraction of burdock leaf

Burdock leaves, 85.58% of moisture content, were taken out from the freezer and extracted by the following conditions: (1) burdock leaves and extraction solvent (0.1 M citric acid in 95% ethanol) were mixed with a ratio of 1[thin space (1/6-em)]:[thin space (1/6-em)]2, 1[thin space (1/6-em)]:[thin space (1/6-em)]3, 1[thin space (1/6-em)]:[thin space (1/6-em)]4, 1[thin space (1/6-em)]:[thin space (1/6-em)]5, and 1[thin space (1/6-em)]:[thin space (1/6-em)]6 (g mL−1), and extracted at 800 °C for 90 min. (2) Burdock leaves and extraction solvent (0.1 M citric acid in 95% ethanol) were mixed with a ratio of 1[thin space (1/6-em)]:[thin space (1/6-em)]3 (g mL−1), and extracted at 50, 60, 70, 80, and 90 °C for 90 min. (3) Burdock leaves and extraction solvent (0.1 M citric acid in 95% ethanol) were mixed with a ratio of 1[thin space (1/6-em)]:[thin space (1/6-em)]3 (g mL−1), and extracted at 80 °C for 30, 60, 90, 120, 150 min. (4) Burdock leaves and extraction solvent (0.1 M citric acid in 0, 25, 50, 75, 95% ethanol) were mixed with a ratio of 1[thin space (1/6-em)]:[thin space (1/6-em)]3 (g mL−1), and extracted at 80 °C for 90 min. After extraction, burdock leaf extracts (BLE) were filtered through a filter paper (Whatman no. 1, Whatman International Ltd., Maidstone, England), and stored at −80 °C.

2.3. Measurement of functional compounds of the BLE

2.3.1. Total phenolic compounds (TP). Analyses were conducted with 1 mL of Folin–Ciocalteu reagent added to 1 mL of BLE and incubated for 3 min at room temperature. The sample was vortexed every 10 min after 100 μL of 100 g L−1 Na2CO3 solution was added. The absorbance (Abs) was measured after 1 h by a spectrophotometer (U-2800-A, Hitachi, Japan) at 735 nm. The amount of TP was determined by comparing a standard curve prepared by gallic acid solution, Abs = 21.726X − 0.0312 where X is the amount of gallic acid (g L−1), and was expressed as mg gallic acid equivalent per g of sample (mg gallic acid eq. per g dry weight).16
2.3.2. Total flavonoid (TF). BLE (1 mL) was mixed with 1 mL of 20 g L−1 AlCl3·6H2O and after placing at room temperature for 10 min, the absorbance (Abs) was measured by a spectrophotometer at 430 nm. The amount of TF was determined by comparing a standard curve prepared by quercetin solution, Abs = 4.6627X + 0.0222 where X is the amount of quercetin (g L−1), and was expressed as mg quercetin equivalent per g of sample (mg quercetin eq. per g dry weight).17
2.3.3. Chlorogenic acid (CGA). CGA was analyzed by high-performance liquid chromatography (HPLC, pump: L-6000, Hitachi, Japan; LC controller: L-5000, Hitachi, Japan; diode array detector: L-2450, Hitachi, Japan) with the column of Mightysil RP-18 (250 mm × 4.6 mm, 5 μm, Kanto Chemicals, Japan). The samples were filtered with 0.45 μm PTFE filter (Advantec, Japan). Injection volume was 20 μL. The mobile phases were: (A) methanol and (B) 1% acetic acid at a constant flow of 1 mL min−1. The gradient program was as follows: 10% A at 0 min, 10% A at 5 min, 50% A at 15 min, 80% A at 20 min, 80% A at 30 min, and 10% at 40 min. The peak area (Area) of CGA was monitored at 325 nm (Fig. 2). The amount of CGA was determined by comparing a standard curve, Area = 113.62X + 7.8075, where X is the amount of CGA (mg mL−1 BLE).
image file: c6ra13843h-f2.tif
Fig. 2 HPLC chromatograms of standard of chlorogenic acids (a) and burdock leaf (b).

2.4. Measurement of antioxidant properties of BLE

2.4.1. Reducing power. Reducing power was used to study the antioxidant ability of burdock leaves. BLE (0.1 mL) was adjusted to 10 mL with distilled water. A mixture of 0.2 mL of dilution, 0.2 mL of 0.2 M sodium phosphate buffer (pH 6.6), and 0.2 mL of 10 g L−1 K3Fe(CN)6 was centrifuged (Mikro 22R, Hettich, Germany) at 5000 rpm for 10 min after incubating at 50 °C for 20 min. The supernatant (0.6 mL) was mixed with 0.6 mL of distilled water and 0.12 mL of 1 g L−1 FeCl3. The absorbance was measured by a spectrophotometer at 700 nm after 10 min. Reducing power was expressed as BHA equivalent per 100 g of sample (g BHA eq. per 100 g dry weight).18
2.4.2. DPPH scavenging activity. DPPH scavenging activity was used to study the antioxidant ability of BLE. BLE (1 mL) was mixed with 1 mL of 0.2 mM DPPH in methanol. On the other hand, 1 mL of water replaced the sample as a control. The mixture was incubated in dark at room temperature for 30 min. The absorbance of a sample (As) and control (Ac) were measured by a spectrophotometer at 517 nm against blank (Ab).19 DPPH scavenging activity was calculated as follows:
image file: c6ra13843h-t1.tif

2.5. Preparation of LHB

According to the results of the pre-test, we found that the concentration of SA, first gelation time and CaCl2 concentration in secondary gelation were the most important variables during the production of LHB. Therefore, the effect of these variables on the quality of LHB were studied.

Firstly, BLE were prepared by mixing burdock leaves and extraction solvent (0.1 M citric acid in 95% ethanol) with a ratio of 1[thin space (1/6-em)]:[thin space (1/6-em)]3, and extracting at 80 °C for 90 min. Following the filtration, BLE were concentrated to 1/10 of the original solution at 40 °C.

Chitosan was dissolved in 10 mL L−1 acetic acid. Liquid-core material (LCM) was made by mixing concentrated BLE with 40 g L−1 chitosan with a ratio of 1[thin space (1/6-em)]:[thin space (1/6-em)]10 (mL g−1), and then adding CaCl2 to achieve a final concentration of 10 g kg−1. Chitosan was used as a thickener to prevent the liquid-core from deforming by shear stress when suspended in the alginate solution.12 Chitosan has a relatively higher solubility than many hydrogels and it is a non-toxic, biocompatible, and biodegradable polysaccharide with positive electricity.20 Various complexes of alginate and chitosan have been widely used in the food and pharmaceutical industries. The interaction between these two polymers was also expected to play a role in protecting CGA from oxidation.

In the first gelation step, LCM was dropped into 6, 8, and 10 g L−1 SA solution by passing it through a coaxial bead generator (Unit-Varj1, Nisco Engineering AG, Switzerland) with gentle stirring. LHB prepared from 6, 8, and 10 g L−1 SA in the first gelation are expressed as SA6, SA8, and SA10, respectively. After 10, 30, and 50 min of bead formation, the beads were collected by filtration and rinsed sequentially with distilled water and 95% ethanol. Following secondary gelation for 5 min in 0, 5, and 10 g L−1 CaCl2 solution, LHB were collected and rinsed sequentially with distilled water and 95% ethanol again. The LHB prepared by 0, 5, and 10 g L−1 CaCl2 in secondary gelation are expressed as CA0, CA5, and CA10, respectively.

2.6. Physical properties of LHB

2.6.1. Outer appearance and diameter. The outer appearance of LHB was obtained by a stereomicroscope (SMZ 800, Nikon, Japan). Several shots were taken at different focus distances by a digital single lens reflex camera, and the shots were combined into a fully focused image with the software, Helicon Focus (v. 5.1.6. X64, Helicon soft Ltd., Ukraine). The diameter of LHB was determined by vernier caliper (530-104, Mitutoyo, Japan).
2.6.2. SC of LHB. SC was determined by the method of an earlier study with some modifications.21 LHB (1 g, W1) were incubated in 10 mL of distilled water at room temperature. After 10 min, excess water on the surface was removed gently with a paper towel and the weight of swollen LHB were weighed (W2). SC was calculated as follows:
image file: c6ra13843h-t2.tif
2.6.3. Relative hardness. Relative hardness was determined by a texture analyzer (TA-XT2, Stable Micro Systems Ltd. England) with a cylinder probe no. P/35 at room temperature. A compression test was performed at pre-test speed of 5.0 mm s−1, test speed of 1.0 mm s−1, post-test speed of 10 mm s−1, and compression distance of 95% sample height. The hardness of SA10 was used as a standard. The relative hardness was expressed as a percentage calculated as follows:
image file: c6ra13843h-t3.tif
where H1 is the hardness of different variation of LHB and H0 is the hardness of standard.
2.6.4. CGA LE and antioxidant ability. CGA LE was determined by the method of an earlier study with some modifications.21 LHB (0.5 g) stored for 0 days (S0) and 7 days (S7) were homogenized with 9.5 mL of distilled water and centrifuged at 2000 rpm for 10 min. The amount of CGA in the supernatant of S0 and S7 was determined by HPLC. CGA LE was calculated with the following equation:
image file: c6ra13843h-t4.tif
where Ms is the amount of CGA in the sample and M0 is the total amount of used CGA. Furthermore, DPPH scavenging activity of the supernatant (1 mL) of S0 and S7 and LCM (1 mL) were determined by the method explained in the Section 2.4.2.

2.7. Statistical analysis

The experiments were repeated at least three times, and the values were expressed as means ± standard deviations. Data were analyzed by the analysis of the variance (ANOVA), using SAS (SAS Institute Inc., USA). Significant differences between means were determined by Duncan's multiple range tests. p-Values of 0.05 or less were considered to be significant.

3. Results and discussion

3.1. Yield of functional compounds and antioxidant abilities

The results indicated that solid (burdock leaves) to liquid (extraction solvent) ratio exhibited significant effects on the extraction efficiency of functional compounds from burdock leaves (Fig. 3a). The yield of functional compounds was found to first increase with the increase of solid to liquid ratio and then to decrease. The highest amount of functional compounds was obtained with a solid to liquid ratio of 1[thin space (1/6-em)]:[thin space (1/6-em)]3 (g mL−1). TP, TF, and CGA content were 38.73, 111.41, and 23.81 mg g−1 dw, respectively. An earlier study22 also showed that the yield of TP increased with the increase of solvent and then to decrease. They indicate that the large solid to liquid ratio allows a larger concentration gradient between solvent and burdock leaf, enabling higher extraction efficiency, but the large volume of solvent makes adequate stirring difficult.
image file: c6ra13843h-f3.tif
Fig. 3 Effect of solid to liquid ratio (a), temperature (b), time (c), and ethanol concentration (d) on the yield of functional components of BLE.

The effect of extraction temperature on the yield of functional compounds is shown in Fig. 3b. The yield of functional compounds increased with the increase of extraction temperature and then sharply decreased between 80 °C to 90 °C. The amount of CGA increased from 20.31 mg g−1 dw to 23.81 mg g−1 dw when the extraction temperature increased from 50 °C to 80 °C but decreased to 21.86 mg g−1 dw when extracted at 90 °C. CGA is an important active ingredient in many plants and vegetables.6 Some studies showed that CGA not only had many anti-bacterial, anti-mutagen, and anti-inflammatory abilities but also inhibited N-nitroso compounds and low-density lipoprotein oxidation.4,5 The yield of functional compounds increased with the increase of extraction time up to 90 min and then decreased (Fig. 3c). TP, TF, and CGA contents were 30.04, 4.36, and 19.01 mg g−1 dw, respectively, when extraction time was 30 min, and increased to 38.73, 111.41, and 23.62 mg g−1 dw at 90 min.

Ethanol concentration had a linear effect on the TP, TF, and CGA content. An earlier study23 reported the amount and composition of phenols varied greatly among different extracting solutions. TP contents showed highest concentrations when extracted with ethyl acetate, next with n-butanol, and lowest in water. Similar results were observed with the CGA content, which showed that the higher the polarity of the extracting solution, the higher the amount of extracted CGA. Fig. 3d depicts that the TP, TF, and CGA content extracted with 95% ethanol was 2.4-fold, 7.4-fold, and 2.7-fold higher than those of 0% ethanol. These results are probably due to the lower polarity of ethanol compared to water.

Summarizing these results, the optimum extraction conditions of burdock leaves were: solid to liquid ratio, 1[thin space (1/6-em)]:[thin space (1/6-em)]3; extracting temperature, 80 °C; extracting time, 90 min; and ethanol concentration, 95%. Under these conditions, the extracted amounts of TP, TF, and CGA were 38.73, 111.41, and 23.81 mg g−1 dw, respectively. The amount of GCA was higher than previous investigations. Some studies22,23 reported that 1.3 mg g−1 dw and 1.2 mg g−1 dw of CGA was extracted with ethyl acetate and the ionic liquids based simultaneous ultrasonic and microwave assisted extraction, respectively. In this study, we extracted burdock leaves by 0.1 M citric acid with the different concentration of ethanol. A study24 indicated that when the extraction pH decreased from pH 8 to pH 3, the amount of TP was increased.

Previous research results showed that TP, TF, and CGA had antibacterial and antioxidant capabilities.23 In the measurement of reducing power, where the antioxidant ability of burdock leaves was determined, the results showed similar trends with TP, TF, and CA content at different extraction temperatures, extraction times, and ethanol concentrations (Fig. 4). Furthermore, we used DPPH free radical scavenging activity to determine the antioxidant ability of BLE. In contrast to TP, TF, and CGA contents, DPPH free radical scavenging activity was highest when solid to liquid ratio was 1[thin space (1/6-em)]:[thin space (1/6-em)]2. This was because the amount of leaves was highest when solid to liquid ratio was smallest. On the other hand, in the experiment of TP, TF, CGA content, and reducing power, the dilution should be considered and converted to amounts per unit amount of dry burdock leaf samples. Under the optimum extraction conditions, reducing power was 6.67 g BHA eq. per 100 g dw and DPPH free radical scavenging activity was 59.49%.


image file: c6ra13843h-f4.tif
Fig. 4 Effect of solid to liquid ratio (a), temperature (b), time (c), and ethanol concentration (d) on antioxidant abilities of BLE.

3.2. Outer appearance and diameter of LHB

SA, the wall material be used, is a copolymer of (1–4)-linked β-D-mannuronic acid (M-blocks) and α-L-guluronic acid (G-blocks). When G-blocks are coordinated with calcium ions, sodium ions are replaced by calcium, and a high stable water-insoluble metal alginate gel complex, calcium alginate, is formed.25

In this study, we proposed the concepts of first gelation and secondary gelation. First gelation occurs when the core material is extruded into SA solution. The osmotic gradient between the droplet and SA solution causes the calcium ions to diffuse from the droplet to the surrounding SA. When G-blocks are coordinated with calcium ions, a water insoluble calcium alginate outer-layer forms. In the following secondary gelation, the semifinished beads are suspended into CaCl2 solution. The osmotic gradient between the semifinished bead and CaCl2 solution causes the calcium ions to permeate into the beads, making the structure of calcium alginate become much more stable. In brief, the outer-layer is formed in first gelation and strengthened in secondary gelation.

When the cationic CaCl2 solution was dropped into the anionic SA solution, a spherical gel membrane was immediately formed around the droplet. The instantaneous diffusion of calcium ions through the membrane surface resulted in a progressive build-up to form a calcium alginate layer surrounding the core and increased the droplet diameter and membrane thickness until the calcium ions contained within the droplet was completely utilized to form cross-linkages. It could be seen that LHB have a bilayer structure (Fig. 5), with a LCM core and calcium alginate membrane coating. The diameter of LHB ranged from 2.64 to 4.01 mm (Table 1). In this study, the diameter of LHB increased along with an increase in SA concentration, but there was no significant difference between SA8 and SA10. An earlier study26 also indicated that the diameter of liquid-core caviar had a tendency to remain constant in SA concentrations over 8 g L−1, although the density of the gel membrane increased.


image file: c6ra13843h-f5.tif
Fig. 5 Effect of different treatment on the outer appearance of LHB. (a) SA6; (b) SA8; (c) SA10; (d) 10 min; (e) 30 min; (f) 50 min; (g) CA0; (h) CA5; (i) CA10.
Table 1 Experiment design and physical properties of LHBa
Code Variables Physical properties
Concentration of SA (g L−1) First gelation time (min) CaCl2 concentration in secondary gelation (g L−1) Diameter (mm) SC (%) Relative hardness (%) CGA LE (%)
a Means of 3 replicates ± standard deviation; means within the same column of each treatment with different superscript letters are significantly different at p < 0.05.
Treatment 1
SA6 6 30 5 2.64 ± 0.12a 13.45 ± 0.46a 30.20 ± 1.99c 76.17 ± 4.25a
SA8 8 30 5 2.70 ± 0.13b 12.21 ± 0.53ab 60.91 ± 2.70b 79.28 ± 2.35a
SA10 10 30 5 2.79 ± 0.19b 11.90 ± 0.92b 100.00 ± 3.84a 82.71 ± 3.95a
[thin space (1/6-em)]
Treatment 2
10 min 10 10 5 2.68 ± 0.06c 17.87 ± 0.28b 85.66 ± 2.31b 92.36 ± 1.13a
30 min 10 30 5 2.79 ± 0.19b 11.90 ± 0.92c 100.00 ± 3.84a 82.71 ± 3.95a
50 min 10 50 5 3.16 ± 0.10a 23.83 ± 1.80a 70.20 ± 2.56c 64.33 ± 5.01b
[thin space (1/6-em)]
Treatment 3
CA0 10 30 0 4.01 ± 0.20a 68.05 ± 3.14a 19.31 ± 1.22c 76.67 ± 2.57a
CA5 10 30 5 2.79 ± 0.19b 11.90 ± 0.92b 100.00 ± 3.84b 82.71 ± 3.95a
CA10 10 30 10 2.70 ± 0.12b 8.10 ± 0.33b 108.80 ± 4.17a 83.04 ± 2.98a


There was also an increase in the diameter along with the increase of gelation time. When LHB were suspended in SA from 10 to 50 min, their diameter increased from 2.68 to 3.16 mm. Assuming that the diameter of the cores remained constant, we can infer that the increase in diameter of the LHB was caused by the thickening of the calcium alginate layer. This is understandable, since more calcium can be combined with alginate over time, leading to a thicker outer layer. A similar phenomenon was demonstrated by an earlier study:12 the particle size of alginate-membrane liquid-core strawberry capsules increased over gelation time.

Not only the diameter but the shape of LHB was influenced by gelation time. Fig. 5d–f shows that LHB were roughly spherical at 10 and 30 min but became elliptical at 50 min. To ensure that the LHB would be roughly spherical, we prevented the LHB adhering to the beaker or each other by stirring the SA solution gently during first gelation (100 rpm). Beads may have been tugged by the shearing force, causing them to become elliptical with longer gelation times.

Secondary gelation is an additional hardening process where the LHB are suspended in the calcium solution. We inferred that before secondary gelation, the calcium alginate outer-layers of semifinished beads were not stable. When G-blocks of alginate are coordinated with calcium ions, a high stable water- insoluble metal alginate gel complex is formed. However, during this process, some apertures may form because of SA polymer bonding without combining with calcium ions first gelation. When LHB are suspend in a solution, water tends to fill these apertures, causing water absorption until the equilibrium state is reached.27 This phenomenon probably caused the diameter of CA0 to be larger than CA5 and CA10. The thicker outer-layer could also be observed in Fig. 5g–i.

3.3. SC of LHB

The SC of LHB is considered to be related to the presence of osmotic pressure between LHB and environment, and lower SC indicates higher stability. As we mentioned before, LHB tend to absorb water until the equilibrium state is reached. The phenomenon causes the egg-box structure of SA to become fragile, reduces the hardness of the LHB and results in the release of compounds from the core. Table 1 shows that there was a decrease in SC of LHB along with an increase in SA concentration. With an increase in gelation time, SC of LHB decreased and then increased. SC of LHB was 23.83% at 50 min, approximately 2-fold higher than 30 min (11.90%). An earlier study12 indicated that with longer gelation times, a large amount of water would enter from the alginate solution into the liquid-core of the capsules by osmotic action, resulting in their bursting.

Secondary gelation has an important role on stabling the structure of calcium alginate layer in the LHB. According to Table 1, SC of CA5 (11.90%) and CA10 (8.10%) were significantly (p < 0.05) lower than CA0 (68.05%). This was presumable because some G-groups of alginate did not combine with calcium ion during first gelation, and water entered into these pores by osmotic pressure. After secondary gelation, some of these pores were filled by calcium ion, making it difficult for water to enter into these gaps, leading to a decrease in SC (Table 1).

3.4. Relative hardness of LHB

Hardness was determined by a texture analyzer with a cylinder probe. Low hardness should be avoided since the LHB could burst easily during processing, transportation, or storage. Table 1 shows that along with an increase in SA concentration, there was a linear increase in the relative hardness of LHB. This is because a higher concentration of alginate can produce a denser gel membrane.26 Furthermore, with an increase in first gelation time, the relative hardness of LHB increased and then decreased. LHB had the highest hardness when crosslinked for 30 min. The effect of secondary gelation on relative hardness was obvious. The relative hardness of CA10 was 108.80%, about 5.6-fold higher than CA0 (19.31%). It was also observed that the increase of swelling capacity tends to lead to a decrease in hardness.

3.5. CGA LE and antioxidant ability of LHB

LE indicates the degree of CGA retention during processing, the lower the LE, the larger the amount of CGA loss during processing. For successful oral delivery, the carrier must have a high LE.28 CGA LE showed no significant difference (p < 0.05) among different concentrations of alginate (Table 1). However, CGA LE decreased from 92.36 to 64.33% when LHB was suspended in SA from 10 to 50 min in the first gelation. The decrease of CGA LE may be due to CGA leakage into the gelation solution by osmotic action over time. Furthermore, the effect of secondary gelation on CGA LE showed no significant difference among different formulations (CA0, CA5, and CA10).

Fig. 6 presents the antioxidant ability of LHB variations. The LCM without encapsulation showed a higher DPPH scavenging activity (55.22%) than LHB (33.19–53.16%). We inferred that the CGA lost during encapsulation was the reason for the decrease in antioxidant ability of LHB. The correlation between DPPH scavenging activity and CGA LE is shown in Fig. 7. It was found that DPPH scavenging activity was positively correlated with CGA LE (R2 = 0.94). The results indicated that higher amounts of CGA in LHB lead to better antioxidant ability. This experimental result was similar to the research results of an earlier study29 but LHB seemed to provide a relatively higher CGA LE than normal hydrogel beads.


image file: c6ra13843h-f6.tif
Fig. 6 Effect of different treatment on the change of DPPH scavenging activity of LHB. (a) Sodium alginate; (b) gelation time; (c) CaCl2 concentration.

image file: c6ra13843h-f7.tif
Fig. 7 The correlation between DPPH scavenging activity and CGA loading efficiency.

Along with increased storage duration, DPPH scavenging activity of LHB was reduced. Although the DPPH scavenging activity of the LHB were lower than the LCM after 7 day storage, the descent rates of the LHB (14.42–20.00%) were lower than that of the LCM (21.17%). This suggests that the calcium alginate layer was effective in protecting the CGA in the LHB, presumably by obstructing the diffusion of oxygen and inhibiting the oxidation of CGA.29 With an increase in SA concentration, the descent rates of DPPH scavenging activity decreased. As mentioned in 3.4., a higher concentration of alginate could produce a denser membrane matrix, which could inhibit the movement of oxygen. However, there was no significant difference between the descent rates of SA8 (14.54%) and SA10 (14.61%), which decreased and then increased with an increase of CaCl2 concentration in secondary gelation. These results demonstrated that the density of the alginate membrane was not the only factor effecting the diffusion of oxygen, but choosing the appropriate permeability of coating was also an important factor which controlled the exchange of oxygen.30 The descent rates of DPPH scavenging activity showed a decrease by first gelation time. LHB prepared by 10 min gelation showed relatively higher descent rates of DPPH scavenging activity. We inferred that the thinner outer membrane (Fig. 5) and weaker structure (Table 1) lead to the poor capacity of preventing CGA from oxidation.

4. Conclusions

The result of this analysis indicated that the optimal extracting parameters of burdock leaf were as follows: the solid to liquid ratio, 1[thin space (1/6-em)]:[thin space (1/6-em)]3; extracting temperature, 80 °C; extracting time, 90 min; ethanol concentration, 95%. Under these conditions, the extracted amounts of TP, TF, and CGA were 38.73, 111.41, and 23.81 mg g−1 dw, respectively. Furthermore, the DPPH scavenging ability was 59.49%, and reducing power was 6.67 g BHA eq. per 100 g. In the gelation process, SC of LHB was found to increase with the decrease of relative hardness. LHB crosslinked for a longer time in the first gelation showed higher SC, lower hardness, and lower CGA LE, in other words, a long first gelation time caused the quality of LHB to decrease. The LHB prepared by SA concentration of 10 g L−1 and gelation for 30 min in first gelation and CaCl2 concentration of 5 g L−1 in secondary gelation was regarded as the best preparation condition because it had a low SC, high hardness and CGA LE, and low descent rate of DPPH scavenging activity. It was found that DPPH scavenging activity had a high correlation with CGA LE. Although DPPH scavenging ability decreased after encapsulation because of CGA lost during processing, LHB showed a lower descent rate of DPPH scavenging ability. The relative hardness of the LHB increased and SC decreased after secondary gelation. Thus, the results showed that secondary gelation is an important step in LHB processing.

Abbreviations

BLEBurdock leaf extracts
CACalcium chloride
CGAChlorogenic acid
LCMLiquid-core material
LELoading efficiency
LHBLiquid-core hydrogel beads
SASodium alginate
SCSwelling capacity
TFTotal flavonoid
TPTotal phenolic compounds

Notes and references

  1. R. Ferracane, G. Graziani, M. Gallo, V. Fogliano and A. Ritieni, J. Pharm. Biomed. Anal., 2010, 51, 399–404 CrossRef CAS PubMed.
  2. Z. Lou, X. Song, Y. Hong, H. Wang and Y. Lin, Food Control, 2013, 32, 270–274 CrossRef CAS.
  3. T. Yamaguchi, M. Katsuda, Y. Oda, J. Terao, K. Kanazawa, S. Oshima, T. Inakuma, Y. Ishiguro, H. Takamura and T. Matoba, Food Sci. Technol. Res., 2003, 9, 79–83 CrossRef CAS.
  4. M. R. Olthof, P. C. Hollman and M. B. Katan, J. Nutr., 2001, 131, 66–71 CAS.
  5. Z. Xiang and Z. Ning, LWT--Food Sci. Technol., 2008, 41, 1189–1203 CrossRef CAS.
  6. R. Niggeweg, A. J. Michael and C. Martin, Nat. Biotechnol., 2004, 22, 746–754 CrossRef CAS PubMed.
  7. Y. Li, M. Hu, Y. Du, H. Xiao and D. J. McClements, Food Hydrocolloids, 2011, 25, 122–130 CrossRef CAS.
  8. F. Shahidi and X. Q. Han, Crit. Rev. Food Sci. Nutr., 1993, 33, 501–547 CrossRef CAS PubMed.
  9. L. Trugo and P. M. Finglas, in Microcapsule, ed. C. Thies, NewsRx, Atlanta, 2003, pp. 3892–3903 Search PubMed.
  10. M. George and T. E. Abraham, J. Controlled Release, 2006, 114, 1–14 CrossRef CAS PubMed.
  11. D. Zhu, Z. Chen, K. Zhao, B. Kan, H. Li, X. Zhang, B. Lin and L. Zhang, RSC Adv., 2015, 5, 26977–26984 RSC.
  12. K. Koyama and M. Seki, J. Biosci. Bioeng., 2004, 97, 111–118 CrossRef CAS PubMed.
  13. I. K. Yoo, G. H. Seong, H. N. Chang and J. K. Park, Enzyme Microb. Technol., 1996, 19, 428–433 CrossRef CAS.
  14. R. Dembczynski and T. Jankowski, Enzyme Microb. Technol., 2002, 31, 111–115 CrossRef CAS.
  15. A. Nussinovitch, Z. Gershon and M. Nussinovitch, Food Hydrocolloids, 1997, 11, 209–215 CrossRef CAS.
  16. M. Sato, N. Ramarathnam, Y. Suzuki, T. Ohkubo, M. Takeuchi and H. Ochi, J. Agric. Food Chem., 1996, 44, 37–44 CrossRef CAS.
  17. C. Quettier-Deleu, B. Gressier, J. Vasseur, T. Dine, C. Brunet, M. Luyckx, M. Cazin, J. C. Cazin, F. Bailleul and F. Trotin, J. Ethnopharmacol., 2000, 72, 35–42 CrossRef CAS PubMed.
  18. E. Bursal and E. Köksal, Food Res. Int., 2011, 44, 2217–2221 CrossRef CAS.
  19. L. S. Lai, S. T. Chou and W. W. Chao, J. Agric. Food Chem., 2001, 49, 963–968 CrossRef CAS PubMed.
  20. W. Yu, H. Song, G. Zheng, X. Liu, Y. Zhang and X. Ma, J. Membr. Sci., 2011, 377, 214–220 CrossRef CAS.
  21. R. Gong, C. Li, S. Zhu, Y. Zhang, Y. Du and J. Jiang, Carbohydr. Polym., 2011, 85, 869–874 CrossRef CAS.
  22. Z. Lou, H. Wang, S. Zhu, M. Zhang, Y. Gao, C. Ma and Z. Wang, J. Chromatogr. A, 2010, 1217, 2441–2446 CrossRef CAS PubMed.
  23. Z. Lou, H. Wang, W. Lv, C. Ma, Z. Wang and S. Chen, Food Control, 2010, 21, 1272–1278 CrossRef CAS.
  24. Z. Tan, C. Wang, Y. Yi, H. Wang, M. Li, W. Zhou, S. Tan and F. Li, Sep. Purif. Technol., 2014, 132, 396–400 CrossRef CAS.
  25. Y. Zhao, F. Hu, J. J. Evans and M. T. Harris, Chem. Eng. Sci., 2011, 66, 848–858 CrossRef CAS.
  26. C. Ji, S. Cho, Y. Gu and S. Kim, Food Sci. Biotechnol., 2007, 16, 557–564 CAS.
  27. G. Pasparakis and N. Bouropoulos, Int. J. Pharm., 2006, 323, 34–42 CrossRef CAS PubMed.
  28. P. Mukhopadhyay, S. Chakraborty, S. Bhattacharya, R. Mishra and P. P. Kundu, Int. J. Biol. Macromol., 2015, 72, 640–648 CrossRef CAS PubMed.
  29. G. Lozano-Vazquez, C. Lobato-Calleros, H. Escalona-Buendia, G. Chavez, J. Alvarez-Ramirez and E. J. Vernon-Carter, Food Hydrocolloids, 2015, 48, 301–311 CrossRef CAS.
  30. E. Ayranci and S. Tunc, Food Chem., 2003, 80, 423–431 CrossRef CAS.

This journal is © The Royal Society of Chemistry 2016
Click here to see how this site uses Cookies. View our privacy policy here.