 Open Access Article
Creative Commons Attribution 3.0 Unported Licence
Optical properties of quaternary kesterite-type Cu2Zn(Sn1−xGex)S4 crystalline alloys: Raman scattering, photoluminescence and first-principle calculations
M. Ya.
Valakh
a,
A. P.
Litvinchuk
*b,
V. M.
Dzhagan
ac,
V. O.
Yukhymchuk
a,
Ye. O.
Havryliuk
a,
M.
Guc
de,
I. V.
Bodnar
f,
V.
Izquierdo-Roca
d,
A.
Pérez-Rodríguez
dg and
D. R. T.
Zahn
c
aInstitute of Semiconductor Physics, National Academy of Sciences of Ukraine, pr. Nauky 45, 03028 Kyiv, Ukraine
bTexas Center for Superconductivity and Department of Physics, University of Houston, Houston, Texas 77204-5002, USA. E-mail: litvin@central.uh.edu
cSemiconductor Physics, Technische Universität Chemnitz, D-09107 Chemnitz, Germany
dIREC, Catalonia Institute for Energy Research, Barcelona 08930, Spain
eInstitute of Applied Physics, Academy of Sciences of Moldova, Chisinau MD 2028, Moldova
fDepartment of Chemistry, Belarusian State University of Informatics and Radioelectronics, Minsk, Belarus
gIN2UB, Departament d’Electronica, Universitat de Barcelona, Barcelona 08028, Spain
First published on 5th July 2016
Abstract
The transformation of the vibrational spectrum of Cu2Zn(Sn1−xGex)S4 single crystals over the entire composition range (0 ≤ x ≤ 1) is studied experimentally by low-temperature Raman scattering and photoluminescence spectroscopies, as well as theoretically in the framework of density functional theory (DFT). It is shown that unlike “classic” mixed binary II–VI and III–V compounds, which are characterized by either one- or two-mode behavior of spectra transformation upon composition variation, the vibrational modes of the quaternary semiconductor Cu2Zn(Sn1−xGex)S4 exhibit both types of behavior within the same alloy system. DFT calculations reveal that the two-mode transformation is in fact observed for the vibrational modes, which possess a very small dispersion across the Brillouin zone, that is typical for a molecular crystal. These modes are due to the “breathing” motion of sulfur within GeS4 and SnS4 tetrahedra. The effects of structural (positional) disorder of mixed crystals are analyzed based on Raman scattering as well as photoluminescence results.
1 Introduction
Quaternary chalcogenides of the Cu2ZnSnS4-type (CZTS) have been at the focus of research activities over the past several years. This is due to an appropriate combination of chemical and physical properties for CZTS, that makes them particularly efficient for photovoltaic applications as an absorber layer in thin film solar cells. First of all, these materials are based on earth abundant, affordable and low toxicity constituents and are characterized by the direct energy gap (Eg ∼ 1.50 eV) with a high inter-band absorption coefficient (∼104 cm−1). The band gap of CZTS could be tuned by replacing the chalcogenide in the anion sublattice (S/Se) or the group IV element within the cation sublattice (Sn/Ge/Si); simultaneous cation–anion substitution could also be realized. A reported power conversion efficiency (PCE) of 12.6% has been achieved for the anion-substituted mixed Cu2ZnSn(S,Se)4 [CZT(SSe)] compound.1 There are a number of reports predicting theoretically and showing experimentally enhancements of the PCE of CZT(SSe) solar cells upon Ge-alloying.2–4Apart from practical applications, there are several fundamental issues with mixed CZ(SnGe)(SSe) alloys, which are of general interest in solid state physics and in material science. One of them is the transformation of the electronic and vibrational spectra of solid solutions upon variation in the alloy composition. Previously reported density functional theory calculations of quaternary CZTS-type compounds provide a solid basis for understanding fundamental aspects of the bonding and electronic band structure in such quaternary systems, which crystallize in a variety of crystallographic structures, and for the interpretation of available experimental results.5–9
Regarding the lattice dynamics of quaternary chalcogenide compounds, a large number of materials have been studied experimentally. Comparison of these experimental data with theoretical lattice dynamics calculations, despite the natural complexity of quaternary compounds and the large number of vibrational modes, allowed the assignment of lines in the spectra to the specific lattice eigenmodes.9–15 This brought Raman spectroscopy to a new higher level as a complex material characterization tool, in particular for monitoring the crystalline structure, presence and chemical content of impurity phases etc.14–18
Reports on the transformation of lattice dynamics properties of mixed quaternary compounds are scarce. To the best of our knowledge, there are only a few reports on the phonon spectra of CZT(SSe)19–21 and CZ(GT)S solid solutions.22–24 In particular, available experimental Raman scattering data for CZ(GT)S were collected at room temperature only and the behavior of several selected high-frequency modes in the range of 250–400 cm−1 was analyzed. It is imperative, however, to analyze the entire phonon spectrum of the alloy system in order to establish the type of transformation of modes of distinct origin upon composition variation.
In this paper we report the results of a comprehensive low temperature Raman scattering study of Cu2Zn(Sn1−xGex)S4 in a wide range of frequencies between 70 and 1200 cm−1, which covers low frequency optical vibrations as well as multi-phonon excitations. The extension of the range toward lower frequencies is rather important in view of the fact that this is the region where vibrations of substituted Ge and Sn occur. Low temperature measurements, due to the reduced widths of phonon lines, allow the resolution of several closely lying vibrational bands in the spectra. The Raman scattering spectra taken under resonant band-to-band excitation reveal a remarkable enhancement of the LO components of polar modes as well as the appearance of numerous lines of multi-phonon origin. A comparison of resonant Raman scattering data with photoluminescence results provides a basis for analysing the effects of positional lattice disorder in mixed crystals.
2 Samples, experimental and calculation techniques
Mixed Cu2Zn(Sn1−xGex)S4 single crystals were synthesized by a chemical vapor transport method. Initially, the end-member compounds CZTS and CZGS were grown in the kesterite structural modification. They were further used as source materials for the synthesis of mixed crystals, as described earlier in ref. 24. The composition of samples studied, as determined by energy-dispersive X-ray spectroscopy, was x = 0, 0.31, 0.55, 0.71, 0.90, and 1.Raman scattering and photoluminescence measurements were carried out in the back-scattering geometry on a LabRam HR800 micro-Raman spectrometer equipped with a CCD detector. The microscope objective 50× was used to both focus incident laser radiation onto the sample and collect scattered light. The lines λ = 514.7 nm of a DPSS laser (Cobolt) or 632.8 nm of a He–Ne laser were used as the excitation source. The spectral resolution of the system did not exceed 2.0 cm−1. All measurements were performed at T = 80 K using a Linkam cooling stage.
First principle calculations of the electronic ground states of CZGS, CZTS and mixed Cu2Zn(Sn0.5Ge0.5)S4 crystals were performed within the generalized gradient approximation using the Perdew–Burke–Ernzerhof local functional25 and norm-conserving pseudopotentials as implemented in the CASTEP code.26 The plane wave basis cut-off energy was set to 880 eV. Prior to performing the calculations, the structures were relaxed while keeping lattice parameters fixed and equal to the experimentally determined ones, so that forces on atoms in the equilibrium position did not exceed 2 meV Å−1 and the residual stress was below 0.01 GPa. A self-consistent field (SCF) tolerance better than 10−7 eV and a phonon SCF threshold of 10−12 eV were imposed. Integration within the Brillouin zone of primitive cells of CZTS or CZGS, which are of I![[4 with combining macron]](https://www.rsc.org/images/entities/char_0034_0304.gif) symmetry, was performed over a 3 × 3 × 3 Monkhorst–Pack grid27 in reciprocal space. In the case of mixed crystals, which possess P
symmetry, was performed over a 3 × 3 × 3 Monkhorst–Pack grid27 in reciprocal space. In the case of mixed crystals, which possess P![[4 with combining macron]](https://www.rsc.org/images/entities/char_0034_0304.gif) symmetry, the integration was done over a 3 × 3 × 1 grid. Fixed electron occupancy constraints were imposed on the self-consistent field energy minimization as a prerequisite for using the linear response scheme28 in the phonon calculations, treating the atomic displacements as perturbations. Furthermore, an electric field response along different crystallographic directions was estimated, which allows, in addition to the transverse optical (TO) modes, a non-analytical correction to longitudinal (LO) phonon frequencies at the Brillouin zone center to be calculated.
symmetry, the integration was done over a 3 × 3 × 1 grid. Fixed electron occupancy constraints were imposed on the self-consistent field energy minimization as a prerequisite for using the linear response scheme28 in the phonon calculations, treating the atomic displacements as perturbations. Furthermore, an electric field response along different crystallographic directions was estimated, which allows, in addition to the transverse optical (TO) modes, a non-analytical correction to longitudinal (LO) phonon frequencies at the Brillouin zone center to be calculated.
3 Lattice dynamics calculations
The results of DFT calculations of both CZTS7,12 and CZGS15,29 in the kesterite structural modification have been reported previously. For both compounds a reasonable agreement between theory and experiment has been established. Therefore, in the following we will focus on the calculated results for mixed Cu2Zn(Sn0.5Ge0.5)S4 crystals. From the standpoint of group theory, 21 optical vibrational modes of kesterite end-member compounds are distributed among irreducible representations as follows:| Γopt = 3A ⊕ 6B ⊕ 6E |
All of them are Raman active. The fully symmetric A-modes are non-polar and thus are not infrared-active.
The crystallographic unit cell of the mixed crystal with equal Ge and Sn content is not centrosymmetric so that the primitive cell volume and the number of atoms doubles in comparison with the undoped CZGS and CZTS. The vibrational representation of Cu2Zn(Sn0.5Ge0.5)S4 at the Brillouin zone center contains now 45 optical modes:
| Γopt = 8A ⊕ 11B ⊕ 13E |
It is interesting to point out that, by symmetry, all three fully symmetric modes in CZGS and CZTS are exclusively due to the motion of S atoms. For the mixed Cu2Zn(Sn0.5Ge0.5)S4 the number of additional A-modes is not simply doubled to 6, but increases to 8. The 6 modes will originate from the motion of S atoms, and there will also be 2 additional fully symmetric modes associated with Zn and Cu, due to the lowering of their site symmetry from S4 in the ideal kesterite to C2 in the mixed crystal.
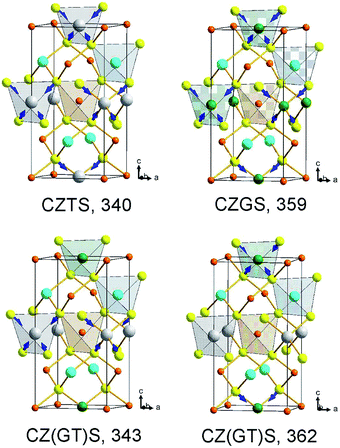
Now we will briefly summarize the results of lattice dynamics calculations of kesterite structured end-member compounds CZGS and CZTS, which were reported earlier.7,12,15 First of all, we mention that the three A-symmetry modes are predicted to be at 359, 309 and 305 cm−1 for CZGS and 340, 284, 275 cm−1 for CZTS. For each of the compounds these three modes, in order of decreasing frequency, are shown to correspond to the stretching of S octahedra around either Ge or Sn, their bending, and rotation about the c-axis.15 Calculations of the mixed crystal Cu2Zn(Sn0.5Ge0.5)S4 show that very similar modes do exist in the alloy, as shown in the lower row of Fig. 1. It is important that, despite the very close frequencies of two vibrations for CZGS and CZTS (359 and 340 cm−1) possessing the same symmetry, no mode “mixing” is predicted for the alloy, and corresponding modes are calculated to be at 362 and 343 cm−1. One of them corresponds to the SnS4 symmetric octahedra stretching (“breathing”), whereas the other one corresponds to the stretching of the GeS4 octahedra.
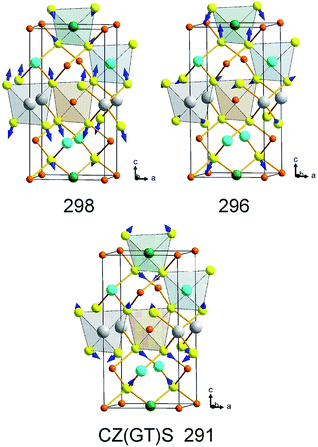
In the frequency range of 275–310 cm−1, where the remaining A-symmetry modes of kesterite CZTS and CZGS occur, crystal theory predicts the existence of three fully symmetric modes for the mixed Cu2Zn(Sn0.5Ge0.5)S4, as shown in Fig. 2. As can be seen, all of these modes are “mixed” in the sense that for each of them both SnS4 and GeS4 octahedra are involved simultaneously: the 298 cm−1 mode is due to the bending of SnS4 and the rotation of GeS4 octahedra, the 296 cm−1 mode is due to the rotation of SnS4 and the bending of GeS4 octahedra, and finally, the 291 cm−1 mode is due to the rotation of both SnS4 and GeS4 octahedra.
4 Experimental results and discussion
4.1 First-order Raman scattering
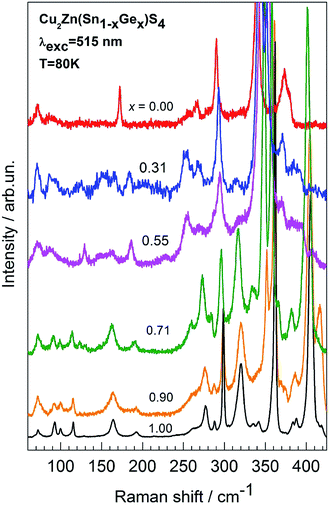
Raman spectra of mixed Cu2Zn(Sn0.5Ge0.5)S4 crystals under λ = 514.7 nm (2.41 eV) excitation are shown in Fig. 3. The spectra of the end-member compounds (x = 0 and x = 1) are in good agreement with those reported earlier both experimentally and theoretically for the kesterite structural modification of these materials. For samples with x = 0.71, 0.90, and 1.00, a higher relative intensity of phonon lines around 400 cm−1, which are known to correspond to longitudinal optical (LO) modes, signals the occurrence of a resonant enhancement of the scattering cross section due to closeness of the excitation laser energy and the band gap of the respective mixed crystals. As already mentioned, the magnitude of the band gap of alloys under consideration varies between 2.25 eV (CZGS) and 1.50 eV (CZTS). As a consequence, the Raman scattering spectra of Ge-rich compounds with x = 0.71, 0.90, and 1.00, under 632.8 nm (1.96 eV) laser excitation (not shown in Fig. 3) are not dominated by the above-mentioned LO-lines, but instead by the two lines around 340 and 360 cm−1, as well as several lower frequency lines for the x = 0.55 and x = 0.31 samples.It appears to be non-typical (in comparison with known data for binary II–VI compounds, for example) to observe similar resonant enhancement of the spectra for materials of various compositions and, correspondingly, various band gaps. The reason for such a “uniform” resonant enhancement for fixed excitation in Cu2Zn(Sn1−xGex)S4 with different x is apparently related to the effect of structural disorder within the cation sublattice, which leads to a considerable smearing of electronic states around the band edges (especially the valence band), and the formation of “tails” in the gap with a rather large density of states.
It is obvious from Fig. 4 that the presented low-temperature spectra taken at T = 80 K, in comparison with the previously reported room temperature data of ref. 22–24, allow the unambiguously observation of the two-mode behavior of the most intense fully symmetric A-lines in the spectra at 341 cm−1 (x = 0) and 362 cm−1 (x = 1). Such behavior of closely lying modes of the same symmetry seems to contradict experimental and theoretical data for numerous II–VI and III–V semiconducting alloys. In these latter materials, the two-mode transformation of the phonon spectrum upon composition variation is typically observed only in the case of a substantial separation of phonons.30–32
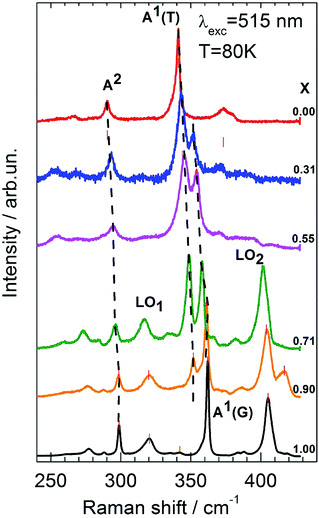 | ||
| Fig. 4 High-frequency range of Raman spectra of mixed Cu2Zn(Sn1−xGex)S4 crystals. A1(G) and A1(T) refer to the germanium- and tin-like modes, respectively. | ||
One has to mention, however, the principal difference between the “classic” binary II–VI and III–V semiconductors and the Cu2Zn(Sn1−xGex)S4 alloys under consideration. First of all, for “classic” compounds, one usually analyzes the behavior of polar modes which are both Raman- and infrared-active (with the exception of two non-polar E2 modes in wurtzite structure materials) and, correspondingly, possess a LO–TO splitting and a “Reststrahlen band” with a typical width of several tens of wavenumbers due to the long range electrostatic interaction. As a consequence, the two-mode spectrum transformation with varying composition was argued to occur in the case of non-overlapping “Reststrahlen bands” of the two constituents in a solid solution.
The tetragonal Cu2Zn(Sn1−xGex)S4 compound of the kesterite structural modification is different in the sense that due to symmetry restrictions, the fully symmetric A-modes (there are in total 3 modes of this symmetry in the end-member materials) are not polar, and corresponding “Reststrahlen bands” do not exist. Therefore, it is plausible to expect the two-mode spectrum transformation of a solid solution in the case when phonon dispersion branches of respective A-modes of the end-member compounds do not overlap over the entire Brillouin zone. Indeed, theoretical calculation of the phonon dispersion of kesterite CZGS shows29 only a very small (less than 10 cm−1) dispersion of the 359 cm−1 A1(G)-mode over the entire Brillouin zone, that does not reach down the CZTS vibrational mode A1(T), located at 340 cm−1.
The proposed assumption finds its confirmation in a different type of mode transformation with composition, which is observed for another fully symmetric A-mode (we will refer to these modes as A2) of Cu2Zn(Sn1−xGex)S4. The peak at 299 cm−1 in CZGS, that was shown to correspond to a fully symmetric vibrational mode,15 shifts monotonously down in frequency to the value of 290 cm−1 in CZTS upon composition variation (Fig. 4). Thus, it exhibits typical one-mode behavior. This finding is not surprising due to the fact that the dispersion of the corresponding vibrational branch of CZGS over the Brillouin zone does exceed29 the mode separation, 9 cm−1.
We point out several other important features, which follow from the spectra presented in Fig. 4. As already mentioned, the resonant enhancement of the LO-components of B-symmetry modes around 400 cm−1 for materials with x = 1.00, 0.90, and 0.71, abruptly disappears upon a further decrease of the band gap of the material with composition x = 0.55. The intensity of the corresponding lines drops by at least an order of magnitude. Simultaneously, one observes a gradual decrease in intensity of two other lines in the spectra, located at 320 and 277 cm−1, which are also related to polar B- and E-symmetry modes.15 The A-symmetry modes, instead, do not exhibit any drastic changes of intensity upon variation of alloy composition. As a matter of fact, the observed pronounced resonant behavior of the 277 cm−1 in CZGS is more evidence in favor of its non-fully symmetric nature. The same reasoning implies that this should also be true for the corresponding peak at 266 cm−1 in CZTS, even though some research has interpreted it differently in earlier studies.
Another notable feature of the spectra shown in Fig. 4 is the presence of a rather intense resonant line at 417 cm−1 for x = 0.90. Its frequency exceeds the highest frequency vibrational mode known either theoretically or experimentally for the kesterite CZGS.15 At the same time, polar modes with a high frequency are expected for either wurtzstannite structural modification (space group Pmn21)10 or, more probably, a “disordered kesterite” (space group P![[4 with combining macron]](https://www.rsc.org/images/entities/char_0034_0304.gif) 2c).15 This fact might hint at the presence of “non-kesterite phase” inclusions in the sample with x = 0.90, which differ from the ideal kesterite in the cation sublattice ordering. The volume of this phase appears to be rather small because only its strongest line emerges in the spectra under (favorable) resonant excitation conditions. Further convincing support of such interpretation for the appearance of the 417 cm−1 line will be given below during discussion of the multi-phonon resonant Raman and photoluminescence spectra.
2c).15 This fact might hint at the presence of “non-kesterite phase” inclusions in the sample with x = 0.90, which differ from the ideal kesterite in the cation sublattice ordering. The volume of this phase appears to be rather small because only its strongest line emerges in the spectra under (favorable) resonant excitation conditions. Further convincing support of such interpretation for the appearance of the 417 cm−1 line will be given below during discussion of the multi-phonon resonant Raman and photoluminescence spectra.
One has to also note that the overall scattering intensity for the sample x = 0.31 is weaker in comparison with crystals of other compositions. Thus, acquisition of the corresponding spectrum required a longer time period. It might be that this is due to the larger inhomogeneity of this particular sample in comparison with other compositions, which also manifests itself in a stronger inelastic scattering background. We will refer to this point later on while discussing two-phonon Raman scattering data and photoluminescence.
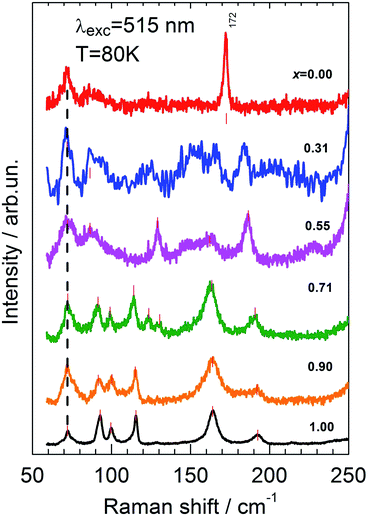
Fig. 5 summarizes the low-frequency scattering spectra in the entire composition range 0 ≤ x ≤ 1. Here, in comparison with Fig. 3, the intensity of the spectra are re-scaled. This allows us to more clearly see the defect-induced weakness of the spectrum for the sample x = 0.31. With regards to the transformation of low-frequency spectra upon composition variation, it is seen that in the range of 1.00 ≥ x ≥ 0.71, the spectra are basically identical in terms of line positions. Mode frequencies start to slightly shift toward lower wavenumbers only for larger Sn contents. This is apparently a consequence of the fact that, according to the lattice dynamics calculations, all atoms of the material participate in the low-frequency vibrations (below 200 cm−1). Thus, assuming a simple dependence of mode frequency against the mass of participating atoms as ω ∼ μ−1/2 (where μ is a reduced mass), it is hardly possible to expect any considerable change upon the substitution of the heaviest atoms (Ge and Sn).
4.2 Higher-order resonant Raman scattering
Given the assignment of the fundamental first-order Raman scattering lines of Cu2Zn(Sn1−xGex)S4 crystals (as shown in Fig. 4), it is straightforward to interpret multi-phonon spectra observed in the second and the third scattering orders, depicted in Fig. 6. The rather small width of multi-phonon features signals the participation of Brillouin zone-center phonons only in these processes. Table 1 summarizes this assignment for the crystal with x = 0.71, where the resonant behavior is the most pronounced.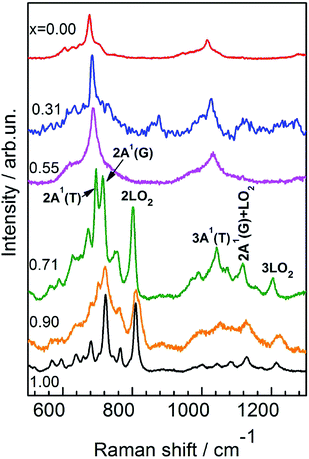 | ||
| Fig. 6 Higher-order Raman spectra of mixed Cu2Zn(Sn1−xGex)S4 crystals. The assignment of the strongest lines is indicated for the x = 0.71 spectrum. | ||
| Experim. freq. | Intensity | Origin | Estim. freq. |
|---|---|---|---|
| 589 | Weak | 2A2 | 592 |
| 632 | Weak | 2LO1 | 634 |
| 673 | Medium | A1(G) + LO1 | 673 |
| 696 | Strong | 2A1(T) | 698 |
| 715 | Strong | 2A1(G) | 716 |
| 753 | Weak | A1(T) + LO2 | 750 |
| 758 | Medium | A1(G) + LO2 | 759 |
| 802 | Strong | 2LO2 | 802 |
| 1045 | Medium | 3A1(T) | 1047 |
| 1075 | Weak | 3A1(G) | 1077 |
| 1097 | Weak | 2A1(T) + LO2 | 1099 |
| 1118 | Medium | 2A1(G) + LO2 | 1117 |
| 1154 | Weak | A1(T) + 2LO2 | 1151 |
| 1204 | Medium | 3LO2 | 1203 |
It is remarkable that along with the strong higher-order scattering lines by LO phonons due to Fröhlich-induced electron–phonon interactions, and typical for the “classic” polar II–VI and III–V semiconductors and their solid solutions,33,34 one observes also rather intense overtones of the fully symmetric non-polar A modes, as well as combinations involving non-polar A-symmetry phonons and LO modes. Further in depth theoretical analysis of such resonance effects is required to better understand the underlying microscopic scattering mechanism for observed multi-phonon processes.
Here we also want to point out some broadening of the multi-phonon lines in the resonant scattering spectrum of the x = 0.90 sample in comparison to those for x = 1.0 and x = 0.71. Apparently, as mentioned above, this is due to the presence of “non-kesterite phase” inclusions due to disorder within the cation sublattice. This experimental finding does not contradict the well established fact of the high sensitivity of second-order scattering for monitoring the effects of spatial homogeneity, disorder (e.g., by implantation), and phase transformations of semiconductors.35
4.3 Photoluminescence
As far as the homogeneity of mixed crystals and the effects of disorder are concerned, we further compare the Raman scattering findings with the results of photoluminescence (PL) measurements that are shown in Fig. 7. The low temperature (T = 80 K) luminescence spectra of CZTS are known to be due to electronic transitions between the conduction band and acceptor levels of defects, that are situated at about 0.28 eV above the bottom of the valence zone.36 As is obvious from the inset to Fig. 7, for all CZ(TG)S alloys studied, the location of the PL band closely follows the position of the fundamental band gap for the corresponding crystal, which was recently obtained from spectroscopic ellipsometry measurements.24 This fact implies the similar nature of PL recombination (band-to-impurity) of photoexcited charge carriers over the entire composition range. Therefore, both the PL intensity and linewidth are expected to be determined by the density of defect states or, in other words, the defect concentration.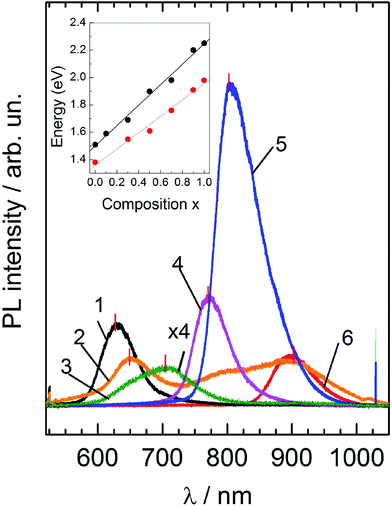 | ||
| Fig. 7 Photoluminescence spectra of mixed Cu2Zn(Sn1−xGex)S4 crystals at T = 80 K. Composition x: 1 – 1.0; 2 – 0.90; 3 – 0.71; 4 – 0.55; 5 – 0.31; 6 – 0.0. The inset shows the position of the fundamental band gap of alloys as determined from spectroscopic ellipsometry measurements at room temperature (after ref. 24) – black points, and from the position of observed PL peaks – red points. | ||
Experimental results confirm the high PL intensity of the x = 0.31 sample, indicating a rather high defect concentration in this crystal. On the other hand, the weakest PL spectrum is observed for the sample x = 0.71, which was shown to exhibit the best resonant Raman scattering spectrum and seems to be the most homogenous with the smallest concentration of lattice defects. At the same time, the PL spectrum of the sample with x = 0.90, unlike any other sample, exhibits several broad overlapping emission lines, a fact which correlates with our earlier assumption about the presence of “non-kesterite” inclusions, that possess a slightly lower band gap in comparison with the ideal kesterite. Thus, there is a good qualitative agreement between the PL results and resonant Raman scattering data with respect to the sample homogeneity and the presence of lattice defects.
5 Conclusions
In summary, the transformation of the vibrational spectrum of Cu2Zn(Sn1−xGex)S4 single crystals upon variation of composition is studied experimentally by low temperature Raman scattering. It is shown that fully symmetric “breathing” modes of GeS4 and SnS4 octahedra exhibit the so-called two-mode type of behavior, despite the closeness of their frequencies (360 and 340 cm−1, respectively). This implies the existence of corresponding modes with a virtually unchanged frequency over the entire composition range (0 ≤ x ≤ 1) and their weak interaction with other modes of the system. Density functional lattice dynamics calculations confirm this experimental finding. Other vibrational modes are found to show the typical one-mode type of transformation with composition.Resonant Raman scattering experiments, which are realized for the Ge-rich alloys of Cu2Zn(Sn1−xGex)S4, allowed the observation of the second- and the third-order scattering processes. Along with overtones and combinations of LO-lines that are typical for resonant Raman spectra of polar semiconductors, we also observed overtones of non-polar fully symmetric A-lines, as well as the combinations nA + mLO. The effects of structural (positional) disorder of mixed crystals were analyzed based on Raman scattering as well as the photoluminescence results.
Acknowledgements
This work was partially supported by the Alexander von Humboldt Foundation, the State Fund for Fundamental Research of Ukraine (F54.1/005), FP7 (project no. 269167 – “PVICOKEST”), and the State of Texas though the Texas Center for Superconductivity at the University of Houston.References
- W. Wang, M. T. Winklern, O. Gunawan, T. Gokmen, T. K. Todorov, Y. Zhu and D. B. Mitzi, Adv. Energy Mater., 2014, 4, 1301465 CrossRef.
- Q. Guo, G. M. Ford, W.-C. Yang, C. J. Hages, H. W. Hillhouse and R. Agrawal, Sol. Energy Mater. Sol. Cells, 2012, 105, 132–136 CrossRef CAS.
- S. Bag, O. Gunawan, T. Gokmen, Y. Zhu and D. B. Mitzi, Chem. Mater., 2012, 24, 4588–4593 CrossRef CAS.
- Q. Shu, J.-H. Yang, S. Chen, B. Huang, H. Xiang, X.-G. Gong and S.-H. Wei, Phys. Rev. B: Condens. Matter Mater. Phys., 2013, 87, 115208 CrossRef.
- S. Chen, A. Walsh, Y. Luo, J.-H. Yang, X. G. Gong and S.-H. Wei, Phys. Rev. B: Condens. Matter Mater. Phys., 2010, 82, 195203 CrossRef.
- K. Biswas, S. Lany and A. Zunger, Appl. Phys. Lett., 2010, 96, 201902 CrossRef.
- T. Gürel, C. Sevik and T. Cağin, Phys. Rev. B: Condens. Matter Mater. Phys., 2011, 84, 205201 CrossRef.
- S. Chen, A. Walsh, X.-G. Gong and S.-H. Wei, Adv. Mater., 2013, 35, 1522–1539 CrossRef PubMed.
- A. P. Litvinchuk, Phys. Status Solidi B, 2016, 253, 323–328 CrossRef CAS.
- M. Guc, A. P. Litvinchuk, S. Levcenko, V. Izquierdo-Roca, X. Fontané, M. Y. Valakh, E. Arushanov and A. Pérez-Rodríguez, Phys. Rev. B: Condens. Matter Mater. Phys., 2014, 89, 205205 CrossRef.
- A. P. Litvinchuk, V. M. Dzhagan, V. O. Yukhymchuk, M. Y. Valakh, I. S. Babichuk, O. V. Parasyuk, L. V. Piskach, O. D. Gordan and D. R. T. Zahn, Phys. Rev. B: Condens. Matter Mater. Phys., 2014, 90, 165201 CrossRef.
- A. Khare, B. Himmetoglu, M. Johnson, D. J. Norris, M. Cococcioni and E. S. Aydil, J. Appl. Phys., 2012, 111, 083707 CrossRef.
- A. P. Litvinchuk, V. M. Dzhagan, V. O. Yukhymchuk, M. Y. Valakh, O. V. Parasyuk, L. V. Piskach, X. Wang, A. J. Jacobson and D. R. T. Zahn, Phys. Status Solidi B, 2016, 253 DOI:10.1002/pssb.201600175.
- J. M. Skelton, A. J. Jackson, M. Dimitrievska, S. K. Wallace and A. Walsh, APL Mater., 2015, 3, 041102 Search PubMed.
- M. Guc, A. P. Litvinchuk, S. Levcenko, M. Y. Valakh, I. V. Bodnar, V. M. Dzhagan, V. Izquierdo-Roca, E. Arushanov and A. Pérez-Rodríguez, RSC Adv., 2016, 6, 13278–13285 RSC.
- X. Fontané, V. Izquierdo-Roca, E. Saucedo, S. Schorr, V. O. Yukymchuk, M. Y. Valakh, A. Pérez-Rodríguez and J. R. Morante, J. Alloys Compd., 2012, 539, 190–194 CrossRef.
- M. Y. Valakh, O. F. Kolomys, S. S. Ponomaryov, V. O. Yukhymchuk, I. S. Babichuk, V. Izquierdo-Roca, E. Saucedo, A. Pérez-Rodríguez, J. R. Morante, S. Schorr and I. V. Bodnar, Phys. Status Solidi RRL, 2013, 7, 258–261 CrossRef CAS.
- R. Caballero, J. M. Cano-Torres, E. Garcia-Llamas, X. Fontané, A. Pérez-Rodríguez, D. Greiner, C. A. Kaufmann, J. M. Merino, I. Victorov, G. Baraldi, M. Valakh, I. Bodnar, V. Izquierdo-Roca and M. León, Sol. Energy Mater. Sol. Cells, 2015, 139, 1–9 CrossRef CAS.
- M. Grossberg, J. Krustok, J. Raudoja, K. Timmo, M. Altosar and T. Raadik, Thin Solid Films, 2011, 519, 7403–7406 CrossRef CAS.
- M. Dimitrievska, G. Gurieva, H. Xie, A. Carrete, A. Cabot, E. Saucedo, A. Pérez-Rodríguez, S. Schorr and V. Izquierdo-Roca, J. Alloys Compd., 2015, 628, 464–470 CrossRef CAS.
- J. J. S. Scragg, J. K. Larsen, M. Kumar, C. Persson, J. Sendler, S. Siebentritt and C. P. Björkman, Phys. Status Solidi B, 2015, 253, 247–254 CrossRef.
- D. B. Khadka and J. Kim, J. Phys. Chem. C, 2015, 119, 1706–1713 CAS.
- J. Chen, W. Li, C. Yan, S. Huang and X. Hao, J. Alloys Compd., 2015, 621, 154–161 CrossRef CAS.
- E. Garcia-Llamas, J. M. Merino, R. Serna, X. Fontané, I. A. Victorov, A. Pérez-Rodríguez, M. León, I. V. Bodnar, V. Izquierdo-Roca and R. Caballero, Sol. Energy Mater. Sol. Cells, 2016 DOI:10.1016/j.solmat.2015.12.021.
- J. P. Perdew, K. Burke and M. Ernzerhof, Phys. Rev. Lett., 1996, 77, 3865–3868 CrossRef CAS PubMed.
- S. J. Clark, M. D. Segall, C. J. Pickard, P. J. Hasnip, M. I. J. Probert, K. Refson and M. C. Payne, Z. Kristallogr., 2005, 220, 567–570 CAS.
- H. J. Monkhorst and J. D. Pack, Phys. Rev. B: Solid State, 1976, 13, 5188–5192 CrossRef.
- K. Refson, P. R. Tulip and S. J. Clark, Phys. Rev. B: Condens. Matter Mater. Phys., 2006, 73, 155114 CrossRef.
- M. Y. Valakh, A. P. Litvinchuk, V. M. Dzhagan, V. O. Yukymchuk, A. M. Yaremko, Y. A. Romanyuk, M. Guc, I. V. Bodnar, A. Pérez-Rodríguez and D. R. T. Zahn, J. Phys.: Condens. Matter, 2016, 28, 065401 CrossRef PubMed.
- I. F. Chang and S. S. Mitra, Adv. Phys., 1971, 20, 359–404 CrossRef CAS.
- A. S. Barker and A. J. Sievers, Rev. Mod. Phys., 1975, 47, S1–S179 CrossRef.
- V. M. Burlakov, A. P. Litvinchuk, V. N. Pyrkov, G. G. Tarasov and N. I. Vitrikhovskii, Phys. Status Solidi B, 1985, 128, 389–400 CrossRef CAS.
- J. F. Scott, R. C. C. Leite and T. C. Damen, Phys. Rev., 1969, 188, 1285–1290 CrossRef CAS.
- M. Y. Valakh, A. P. Litvinchuk, G. S. Pekar and G. N. Polisskii, Phys. Status Solidi B, 1981, 104, 743–750 CrossRef CAS.
- P. Mishra and K. P. Jain, Phys. Rev. B: Condens. Matter Mater. Phys., 2001, 64, 073304 CrossRef.
- M. Grossberg, J. Krustok, J. Raudoja and T. Raadik, Appl. Phys. Lett., 2012, 101, 102102 CrossRef.
| This journal is © The Royal Society of Chemistry 2016 |

