Membranes combining chitosan and natural-origin nanoliposomes for tissue engineering

Franck Cleymanda, Hongyuan Zhanga, Gabriel Dostertb, Patrick Menub, Elmira Arab-Tehrany*c, Emilie Velotb and João F. Manoad
aInstitut Jean Lamour, UMR 7198 CNRS – Université de Lorraine, Parc de Saurupt CS50840 54011, Nancy Cedex, France
bUMR 7365 CNRS – Université de Lorraine, Ingénierie Moléculaire et Physiopathologie Articulaire (IMoPA), Biopôle de l'Université de Lorraine, Campus Biologie-Santé, Faculté de Médecine, Avenue de la forêt de Haye, C.S. 50184, F-54505 Vandœuvre-lès-Nancy Cedex, France
cLaboratoire d'Ingénierie des Biomolécules, Nancy-Université, 2, Avenue de la Forêt de Haye, F 54504 Vandœuvre-Lès-Nancy Cedex, France. E-mail: elmira.arab-tehrany@univ-lorraine.fr
dDepartment of Chemistry, CICECO, University of Aveiro, 3810-193 Aveiro, Portugal

Received 25th May 2016 , Accepted 20th July 2016

First published on 26th August 2016


Abstract

Chitosan thin films, elaborated by solvent casting, were functionalized by incorporating nanoliposomes based on natural vegetable (soy based) and marine (salmon derived) lecithin. The marine lecithin used in this study contains a higher percentage of polyunsaturated fatty acids (PUFAs) and polar lipids compared with vegetal lecithin. The physical-chemistry properties of the obtained films were characterized by water contact angle (WCA), Fourier Transform InfraRed spectroscopy (FT-IR), water uptake test, and Torsional Harmonic Atomic Force Microscopy analysis (TH-AFM). The surface wettability, swelling ratio, roughness and local stiffness of the thin films can be modified and controlled by adding nanoliposomes. The WCA decreased with the increase of the amount of nanoliposomes. Equilibrium water uptakes of about 170% were achieved in 24 h for the different formulations. The FT-IR results showed the existence of chemical interactions between chitosan and nanoliposomes. The surface topography of the films were identical in terms of asymmetry and amplitude distribution of roughness measurements but showed a significant increase of asperity height when incorporating soya nanoliposomes. This variation is accompanied with a decrease in the average of surface rigidity and of adhesive force value, resulting in a heterogeneous surface. The behaviour of human mesenchymal stem cells (hMSCs) cultured on the films was investigated. Results showed that the films favor cell proliferation when the concentration of soya and salmon nanoliposomes is below 2 mg mL−1 and 4 mg mL−1, respectively. The highest cell proliferation of hMSCs culture was observed when the concentration of salmon nanoliposomes was 1 mg mL−1. This work provides evidence that nanoliposome-functionalized chitosan thin films could offer adequate cyto-friendly cell culture supports for hMSCs, and may potentially be used as suitable scaffolds for tissue engineering applications.
1. Introduction

Tissue Engineering (TE) is a multidisciplinary/interdisciplinary field to restore and maintain the function of damaged tissues by combining the knowledge and technology of cells, materials engineering, and external factors (e.g. biochemical molecules and/or mechanical stimulation).1,2 Scaffolds to support tissue development should exhibit a number of characteristics such as:3,4 (i) own physical cues able to favor cell adhesion, proliferation and differentiation; (ii) enable to facilitate the diffusion, transport of nutrients and vital cellular secretary products; (iii) exhibit appropriate evolution of mechanical properties over a long time, compatible with the evolution of the regenerative process.

Both biologically derived and synthetic materials have been extensively explored in TE. Compared to synthetic polymers, natural polymers are advantageous because of their inherent properties of biological recognition and their ability to mimic the tissue microenvironment and stimulate appropriate physiological responses to satisfy the requirements of cellular regeneration.5,6 Among these natural polymers, chitosan-based biomaterials have been widely investigated as tools for TE involving bone, cartilage, myocardium,7–9 skin10,11 or liver regeneration.12,13

Chitosan, a linear polysaccharide consisting of β (1 → 4)-D-glucosamine and β (1 → 4)-N-acetyl-D-glucosamine units, is prepared from chitin, one of the most abundant natural biopolymer, which is extracted from the exoskeletons of crustaceans such as crab and shrimp.14 Chitosan contains amino and hydroxyl groups and has a chemical structure similar to GlycoAminoGlycans (GAGs) that is a potential candidate to connective TE. The primary amino group at 2-position of glucosamine subunits makes it possible to be further physically or chemically modified.15 At low pH values, chitosan can be protonated and become positively-charged.16 At these conditions chitosan solubility is increased17,18 and electrostatic interactions are established with negative charged molecules leading to complex with many types of anionic molecules, such as growth factors, nucleic acids, and cytokines.19–21 This complexation provides an advantage against the degradation and increases local concentration and effectiveness of these bioactive factors.22–26 Besides, these native active agents could improve physicochemical, biological and even mechanical properties of chitosan.

Chitosan membranes have been proposed as a platform for developing hybrid devices for TE. To improve the biological performance, such films are often modified using, for example, cell adhesive protein coatings27 or through plasma modification.28 The combination of chitosan with liposomes has been also employed, for example, to enhance its antibacterial activity.29

Since their first description by Bangham in 20th century 60ies,30 liposomes were known as new agent/drug carriers, able to achieve selective localization of active drug in disease sites such as tumors31–33 and inflammation sites.34 Such reservoirs are able to increase the in vivo drug stability and bioavailability by preventing interactions of the transported drug with unwanted molecules, and reducing toxic side effects;35 at the same time, they can offer the extra advantages of low toxicity, increased surface area, biocompatibility, and biodegradability.36,37 Some studies showed that nanoliposomes based on vegetable and marine lecithin improve cell culture conditions depending on their concentration.37,38 Moreover, these particles can be used to encapsulate hydrophobic and hydrophilic bioactive molecules without using organic solvent,39 reducing inflammatory risk and cell apoptosis.40

In this study, chitosan thin films have been functionalized in volume by incorporating nanoliposomes based on soya (vegetable origin) and salmon head lecithin (animal origin). These two kinds of lecithin are cheaper and much easier to purify compared to other lecithin (e.g. egg yolk and bovine brain lecithin).38 Soya lecithin consist mainly of three mono- and poly-unsaturated fatty acids namely oleic (C18:1), linoleic (C18:2), and linolenic acids (C18:3). Marine lecithin from salmon (Salmo salar) contains a high percentage of polyunsaturated fatty acids (PUFAs), especially eicosapentaenoic acid (EPA, 20:5n-3, 6.7%) and docosahexaenoic acid (DHA, 22:6n-3, 10.8%). Soya lecithin is richer in polar lipids (81.9 ± 0.3%) than salmon lecithin (61.1 ± 0.2%) and its TAG percentage was 18.2 ± 0.2% inferior to TAG containing in salmon lecithin (38.9 ± 0.8%). The characterization of these nanoliposomes has been already done in a previous study.39 We hypothesise that the combination of such liposomes and chitosan could result in composite membranes with potential applicability in the biomedical field.

In this study the properties of chitosan and natural-origin nanoliposomes/chitosan blend thin films were evaluated by water contact angle (WCA), water uptake ability, Fourier Transform InfraRed spectroscopy (FT-IR) and Torsional Harmonic Atomic Force Microscopy analysis (TH-AFM).

In order to study the biological performance effect of chitosan before and after functionalization with nanoliposomes, in vivo tests were performed using human mesenchymal stem cell (hMSCs). hMSCs possess great therapeutic potential due to their multipotency.41,42 They are an attractive tool for tissue engineering and can be isolated from different sources such as bone marrow, adipose tissue and more particularly from the connective tissue of umbilical cord.41–43 There are numerous recent reports which investigated the potential of hMSCs combined with chitosan-based scaffolds for TE.44–50 For further underlying hMSCs-scaffold interactions, we investigated effects of nanoliposomes composition and concentration on cell adhesion, metabolic activity and proliferation.

Such set of results should provide valuate information on the potential of chitosan films functionalised with natural-origin nanoliposomes to be used as multifunctional biomaterials for supporting cell activity, facilitating regeneration, and guiding tissue repair.

2. Experimental

2.1. Materials

Chitosan obtained from shrimp shells was supplied by Tokyo Chemical Industry co., LTD. (ref: C0831-lot E6QYH, low molecular weight, DD = 85.9%, viscosity 265 mPa s−1). The salmon lecithin from Salmo salar by-products and soya lecithin were extracted by a low temperature enzymatic process without any organic solvent.51 Acetic acid (100%) was supplied by Prolabo-VWR. Dimethyl sulfoxide (DMSO, ref. W387509), 3-(4,5-dimethylthiazolyl-2)-2,5-diphenyl-tetra-zolium bromide (MTT, ref. M2128), Triton™ X-100 (ref. T8532) were supplied by Sigma-Aldrich. Hoechst 33528 (ref. H3569) and calf thymus DNA solution (ref. 15633-019) were supplied by Invitrogen. Lactate dehydrogenase (LDH) cytotoxicity detection kit was supplied by Roche (ref. 11 644 793 001). Alexa Fluor® 488 Phalloidin was supplied by Molecular Probe® (ref. A12379), and fluorescent mounting medium was supplied by Dako (ref. S3023).

Cell culture reagents comprised: collagenase type II (ref. NC9693955, Fisher), alpha Minimal Eagle Medium (α-MEM, ref. BE12-169F, Lonza) or Dulbecco's Modified Eagle Medium (DMEM) low glucose (ref. 31885 Gibco), Foetal Calf Serum (FCS, ref. 12105C, Sigma-Aldrich), L-glutamin (ref. 11500626, Gibco), penicillin/streptomycin (ref. 11548876, Gibco) and Fungizone® (ref. 11520496, Gibco).

2.2. Isolation and culture of umbilical cord mesenchymal stem cells

Fresh human umbilical cords were obtained after full-term births with informed consent using the guidelines approved by the University Hospital Center of Nancy. Fresh human umbilical cords were obtained after full-term births (cesarean section or normal vaginal delivery) with mothers' informed agreement applying the guidelines ratified by the University Hospital Center of Nancy (agreement TCG/11/R11). The hMSCs were harvest and characterized as previously described.49 Briefly, the cords were aseptically stored at 4 °C in sterile saline until processing. Umbilical cord connective mesenchymal tissue was cut into small pieces (1–2 mm3). The pieces were incubated in a digestion solution of collagenase type II (1 mg mL−1) in DMEM for 18 h (5% CO2, 95% humidity at 37 °C) to release hMSCs from umbilical matrix. The enzyme was then inactivated with FCS. The hMSCs were subsequently suspended and cultured in α-MEM complete proliferation medium supplemented with FCS10%, penicillin/streptomycin 100 IU mL−1 and 100 μg mL−1 respectively, glutamine 2 mM, and Fungizone® 2.5 μg mL−1, and maintained at 37 °C (5% CO2, 95% humidity) with a medium change every 2 days. The cells were immunophenotyped by flow cytometry to ensure their mesenchymal nature and maintained in these cultured in standard conditions until further experiments.49

2.3. Nanoliposomes preparation

Lecithin solutions 5% (w/w) were obtained by adding of 2 g of soya or salmon lecithin into 38 mL of distilled water. The suspensions were stirred for 4 h in nitrogen atmosphere. Then, they were sonicated at 40 kHz and 40% power for 180 s (1 s on and 1 s off) to obtain the colloid suspension of nanoliposomes. They were stored in sterilized bottles in the dark at 37 °C. Nanoliposomes fatty acid composition, lipid classed, size, electrophoretic mobility and surface tension were characterized using previously described protocols.38,39,51

Soya lecithin was found to be richer in polar lipids (81.9 ± 0.3%) and poorer in triacylglycerols (18.2 ± 0.2%) than salmon lecithin (61.1 ± 0.2% and 38.9 ± 0.8%, respectively). Soya lecithin consists mainly of three mono- and poly-unsaturated fatty acids namely oleic (C18:1), linoleic (C18:2), and linolenic acids (C18:3). Marine lecithin from salmon (Salmo salar) contains a high percentage of polyunsaturated fatty acids (PUFAs), especially eicosapentaenoic acid (EPA, 20:5n-3, 6.7%) and docosahexaenoic acid (DHA, 22:6n-3, 10.8%).

The electrophoretic mobility is higher in soya lecithin (−5 μm cm V−1 s−1) than for fish (−3.1 μm cm V−1 s−1) lecithin. The average diameter of the nanoliposomes was 122 ± 3 nm and polydispersity index was 0.46 for salmon lecithin and 138.5 ± 1 nm with a polydispersity index of 0.28 for soya lecithin. Soya lecithin has lower surface tension (26 mN m−1 at 25 °C after 3 days) than salmon lecithin (33 mN m−1 at 25 °C after 3 days) due to the rigidity and the high-packing properties of saturated and mono-unsaturated fatty acids.

2.4. Membranes preparation

2% (w/v) chitosan was dissolved in 1% acetic acid solution, and stirred 12 h at room temperature and filtered before being used. Then 0.5%, 1%, and 2% (v/v) nanoliposomes/chitosan blend solutions were stirred for 12 h, respectively. 40 g of nanoliposomes/chitosan blend solution was casted in round Petri™ dishes (diameter 90 mm). The nanoliposome concentration were estimated to be 1, 2 and 4 mg mL−1 in the mixed solutions, respectively.

Then the dried films were removed from the dishes and immersed in an aqueous solution of sodium hydroxide (0.2 M) for 30 min. After alkali treatment, the films were washed thoroughly with distilled water until the wash water reached a neutral pH and then stored in phosphate-buffered saline (PBS, with 100 IU mL−1 penicillin and 100 μg mL−1 streptomycin) solution at 4 °C. The films were sterilized by UV for more than 15 min after washing by water before using in cell culture.

The obtained thin films of soya and salmon nanoliposomes/chitosan blends were named as ns–cht 1, ns–cht 2, ns–cht 4, nf–cht 1, nf–cht 2, and nf–cht 4.

2.5. Physical, chemical characterization of scaffolds

2.5.1. Static water contact angle. Static Water Contact Angle (WCA) measurements of natural-origin nanoliposomes/chitosan blend thin films were performed using the sessile drop method with a contact angle instrument (Digidrop Contact Angle Meter) equipped with an image analysis attachment (Windrop). Uniform drops of liquids (0.75 μL) were carefully deposited on a horizontal film verso side (contact surface with Petri™ dish) using a micrometer syringe. The volume of the drops was kept constant since variations in the volume of the drops can lead to inconsistent contact angle measurements. Measurements were consistently conducted under the constant conditions of relative humidity (39%) and temperature (23 °C). Contact angle measurements were recorded three times on three different locations on the verso side within 5 s for a given blend thin film.
2.5.2. Surface energy measurements. The total surface energy of the films was determined graphically by the Owens–Wendt method, which is usually applied for solids with low surface energy like polymers. The Owens–Wendt theory divides the surface energy into two components: one due to dispersive interactions and one due to polar interactions.52 The total surface energy of a solid, γTs, can be expressed as the sum of contributions from dispersive γds and polar (non-dispersive) γps force components. These can be determined from the contact angle, θ, of polar and non-polar liquids with known dispersive γdL and polar γpL parts of their surface energy, via the following relations:
 
γTs = γds + γps (1)
 
image file: c6ra13568d-t1.tif(2)

The total surface energy, polar component and dispersion component of chitosan and nanoliposomes blend thin films had been determined by the water and diiodomethane contact angle using Digidrop contact angle meter apparatus. The total surface energy γTL, dispersive γdL and polar γpL of water at room temperature are 72.8 mJ m−2, 26.4 mJ m−2 and 46.4 mJ m−2. The total surface energy γTL, dispersive γdL and polar γpL of diiodomethane at room temperature are 50.8 mJ m−2, 50.8 mJ m−2 and 0 mJ m−2.

2.5.3. Water uptake ability and swelling ratio. The samples (nanoliposomes/chitosan blend films: 0.5, 1 and 2% v/v) were dried at 50 °C for 24 h and pre-weighed. Then they were incubated in PBS at 37 °C for 24 h under sterile condition. The PBS solution was replaced every 7 days. On 1st, 7th, 14th, and 21st day, samples were taken out of PBS solution. They were weighted after rinsed by distilled water for several times and blotted out of excess surface water with filter paper. The percentage swelling at equilibrium was calculated from the formula:
 
image file: c6ra13568d-t2.tif(3)
where Ww and Wd are weights of wet and dry films respectively.

The pH values were precisely checked by pH meter standardized between 7.3 and 7.5.

2.5.4. Fourier transform infrared spectroscopy. Fourier Transform InfraRed spectroscopy (FT-IR) scans were obtained with a Tensor 27 mid-FTIR Bruker spectrometer (Bruker, Karlsruhe, Germany) equipped with a diamond ATR (Attenuated Total Reflectance) module specially design for thin films. Scanning rate was 20 kHz and 64 scans were used for reference and samples between 850 cm−1 and 4000 cm−1. The nominal instrument resolution was 2 cm−1. References were recorded in standard atmosphere. Then, the chitosan and nanoliposomes/chitosan blend thin films were put on the diamond crystal of the optical cell. All treatments were carried out using OPUS software (Bruker, Karlsruhe, Germany). Raw absorbance spectra were smoothed using a nine-points Savitzky–Golay smoothing functions. 200 points were used for the baseline correction.
2.5.5. Torsional harmonic atomic force microscopy analysis (TH-AFM). Chitosan and nanoliposomes/chitosan blend thin films were characterized using TH-AFM analysis to assess the mechanical properties at a nanometric length scale.

For TH-AFM mode, torsional harmonic cantilevers (HarmoniX™ probes, HMX, BrükerNano Surface) were used, with resonance frequency 53 kHz, torsional frequency 951 kHz, and spring constant 1.2 N m−1.

Measurements were done in air under ambient conditions at 37 °C using a Dimension 3100 with a NanoScope V controller. For the determination of the elastic modulus the cantilevers were calibrated using a standard PS/LDPE sample.53

Elasticity moduli were determined using the Derjaguin–Muller–Toporov (DMT) model.54 The level of the force applied to the surface was adjusted by the amplitude set point, which was used for feedback control to 40% of the free amplitude. Imaging was performed at 0.5 Hz scan rate.

The adhesion force was also determined by the minimum force of retract curve, in real time.

All offline image flattening and analyses were conducted with the software environment provided by the TH-AFM manufacturer. The installed software permitted to estimate several parameters related with the samples' roughness (ASME B46.1, 1995), including:

- Average roughness (Ra): the average of absolute value of height deviations from mean surface;

- Root mean square roughness (Rq): the root means square average of height deviations from the mean data plane;

- Skewness (Sk): the measure of asymmetry of data or more precisely, the lack of symmetry (ISO 4287);

- Kurtosis (Ek): the measure of amplitude distribution or more precisely the measure of whether the data are peaked or flat relative to a normal distribution.

2.6. In vitro evaluation of the nanoliposomes/chitosan blend films

2.6.1. Cell seeding. At passage 4, hMSCs were seeded on sterilized support made of chitosan films or nanoliposomes/chitosan blend films. The used cell seeding density was 1000 cells per cm2, onto 12-, 24- or 96-well tissue culture plates. The cell-seeded scaffolds were incubated in standard conditions (5% CO2, 95% humidity at 37 °C) during 1, 7, 14 and 21 days. Chitosan alone was considered as the control.
2.6.2. Cell morphology and density. After 7, 14 and 21 days, the cells on the membranes in 24-well plates were fixed with 2% paraformaldehyde at 25 °C for 30 min, washed with PBS 3 times, and then permeabilized with 0.5% Triton™ X-100. Fluorescent dyes were used to stain both actin cytoskeleton (phalloidin coupled with a green fluorophore, Alexa 488) and DNA (blue labelling with DAPI). Samples were then rinsed with PBS and incubated with phalloidin and DAPI for 30 min and 1 min, respectively. Labelled cells were mounted on glass slides and fluorescence images were obtained using a fluorescence microscope (Leica DMI3000B).
2.6.3. Biocompatibility assays. To evaluate the impact of the different films on cell behavior, different parameters were estimated: cytotoxicity, cell metabolic activity and cell proliferation.
2.6.3.1. Evaluation of the cytotoxicity of the membranes by LDH assay. LDH is an enzyme that remains in the cytoplasm when a cell is healthy. If this enzyme is massively released outside the cell, it means that its environment is cytotoxic. Here, the cytotoxicity of the membranes was assessed by cells LDH release in culture supernatant, where LDH cytotoxicity detection kit was used according to manufacturer's instructions. The cytotoxicity values obtained with nanoliposomes/chitosan blend scaffolds were compared to the results obtained with chitosan alone, which were considered as the basal release.

Briefly, after 24 h of culture onto the different membranes, cell culture supernatants were collected. Their LDH content was assayed by spectrophotometry (Varioskan® Flash, Thermo) to determine the amount of reduced nicotinamideadenine dinucleotide (NAD) at 492 nm in the presence of lactate and LDH. Positive control experiments were performed on each membrane using 2% (v/v) Triton™ X-100 to lysate cells and to release all their LDH content and set as 100% cytotoxicity. The cytotoxicity percentage of each membrane was evaluated by the ratio [A]sample/[A]100%, where [A]sample and [A]100% denote the absorbance.


2.6.3.2. Cell proliferation. Cell proliferation was assessed after 7, 14 and 21 days of hMSCs culture onto the films using the Hoechst assay, which allows cell DNA quantification.55 Hoechst 33258 is a fluorescent dye which binds to DNA allowing its quantification. Briefly, hMSCs were harvested from 12-well plates coated with the films. The cells were suspended in 100 μL of Hoechst buffer (10 mM TRIS, 1 mM EDTA, and 0.1 M of NaCl, pH 7.4) before 5 series of freezing (nitrogen liquid)/defreezing (60 °C, 5 min) for lysing cells and releasing their DNA into solution.

Low fluorescent background black flat-bottom plates were used to perform the assay and a calf thymus DNA standard curve was used in the quantification. The samples were mixed with 2 mL of Hoechst solution (0.1 μg mL−1 in final concentration) and the lecture of DNA sample and standards was performed by fluorescence spectrophotometry (360 nm excitation/460 nm emissions, Varioskan® Flash, Thermo). The DNA concentration (μg mL−1) of each unknown sample is based on its fluorescence measurement relative to the standard curve.


2.6.3.3. Cell metabolic activity. Cell metabolic activity was measured using the MTT assay as described explained elsewhere,55 where hMSCs seeded on standard plastic 96-well culture plates was used as reference value to normalize the results.

After each culture time, 50 μL of MTT solution (2 mg mL−1) was added to 200 μL of cell culture medium. Briefly, hCSMs were incubated for 4 h (5% CO2, 95% humidity at 37 °C) to allow the yellow dye to be transformed into blue formazan crystals by the mitochondrial dehydrogenases related to cell metabolism. The supernatant was removed and this insoluble product was protected from light and dissolved by addition of 200 μL DMSO and gently mixed at 37 °C for 5 min. The supernatants were removed, protected from light, centrifuged, and their absorbance was read within 30 min using a Varioskan® Flash (Thermo) multiplate reader at 540 nm. MSCs metabolic activity on standard plastic 96-well culture plates was used as the reference value.

The cell metabolic activity results on the different membranes were presented in fold versus plastic results.

2.7. Statistics

Results are depicted as mean ± SD from at least three separate measurements (n = 3). Significance between the mean values was calculated by ANOVA one-way analysis. Probability values p < 0.05 were considered significant.

3. Results and discussion

3.1. Thin films physical and chemical characterization

3.1.1. Static water contact angle. Table 1 shows the surface wettability of natural-origin nanoliposomes/chitosan blend thin films measured by static WCA. Significant differences can be noticed in the surface wettability of blend thin film with varying proportions of nanoliposomes. ns–cht 4 and nf–cht 4 displayed the smallest contact angle among all the films which indicates a higher surface wettability. The WCA decreases when the amount of nanoliposomes increased in the films. This is likely due to the polar lipid proportion in nanoliposomes.51 Although both types of thin films are wettable, salmon nanoliposomes/chitosan blend films may be more suitable for tissue engineering applications because of variety of polar components and presence of various polyunsaturated fatty acids especially, long chain.
Table 1 Water contact angle and surface energy of pure chitosan and nanoliposomes/chitosan blend films. The films were named ns–cht for soya and nf–cht for salmon (e.g. ns–cht 1 means that the concentration of soya nanoliposomes in the film is 1 mg mL−1). Results are mean ± S.D. (n = 3)
Thin film Average of contact angle (°) Total energy γTs (MJ m−2) Polar component γpL (MJ m−2) Dispersive component γdL (MJ m−2)
Diiodomethane Water
Chitosan 58 ± 3 101 ± 2 43 ± 4 11 ± 3 30 ± 1
ns–cht 1 74 ± 1 99 ± 2 28 ± 2 8 ± 2 21 ± 1
nf–cht 1 50 ± 3 77 ± 1 58 ± 1 24 ± 2 34 ± 1
ns–cht 2 42 ± 1 84 ± 1 49 ± 1 10 ± 1 39 ± 1
nf–cht 2 47 ± 3 64 ± 3 82 ± 7 46 ± 8 36 ± 1
ns–cht 4 31 ± 2 78 ± 4 57 ± 5 13 ± 4 44 ± 1
nf–cht 4 51 ± 3 56 ± 3 104 ± 7 70 ± 5 34 ± 2


3.1.2. Surface energy measurements. Table 1 presents the evolution of the total surface energy of the different films in PBS solution. Both total surface energy and the polar component of nanoliposomes blend thin films significantly increase compared to pure chitosan thin film (except for the case of ns–cht 1).

Increased surface energy represents an increased level of free energy on the surface that is ready to bind with external substances.56 That can be explained by introducing hydrophilic chemical groups, such as esters resulting from the addition of nanoliposomes. These functional groups make the surface of films more polar and therefore more hydrophilic. This result can be proved in part by FT-IR (cf. 3.1.4).

It is known that substrates with high or intermediate hydrophilicity sustain better cell adhesion and proliferation.57,58 The results of appropriated surface energy and polarity mirror those of stable attachment that leads to the proliferation of hMSCs.

3.1.3. Water uptake ability. The swelling behavior in the composite films is vital for practical application in TE. It is difficult to obtain a uniform distribution of attached cells inside a hydrophobic scaffold. Thus, a scaffold with suitable water uptake ability, allows easier penetration of the cell suspension and culture medium.59

There are several parameters affecting the swelling ratio, hydrophilicity, stiffness and pore structure of a matrix. The sample with the highest degree of swelling will have the highest surface area/volume ratio. The hydrophilic nature of chitosan-based material may be a major factor that influences the extent of swelling of these matrices.

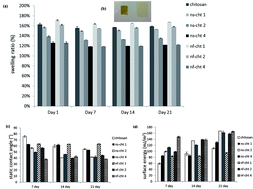
In Fig. 1a, the ns–cht 1, nf–cht 1 and nf–cht 2 indicate equal or higher water uptake ability than chitosan films upon 24 hours. Equilibrium water uptake for nf–cht 1 was up to about 170%. From the 7th day of incubation, the weight variations of films became stable. Fig. 1b shows representative examples of nf–cht 1 film before and after 24 h incubated in PBS, where it is clear that the change in the thickness of the membrane upon swelling is also accompanied by an increase in its area.


image file: c6ra13568d-f1.tif
Fig. 1 Water uptake ability and kinetic swelling behavior of the scaffolds. (a) Kinetic swelling behavior of the scaffolds in PBS at 37 °C for 21 days. The nanoliposomes/chitosan blend films were named ns–cht for soya and nf–cht for salmon (e.g. ns–cht 1 means that the concentration of soya nanoliposomes in the film is 1 mg mL−1). Results are mean ± S.D. (n = 3). Bars indicate statistical significant differences (* p < 0.05). (b) Water uptake ability demonstrated as an example for nf–cht 1 film before and after 24 h incubation in PBS. Bars indicate 1 cm. (PBS: phosphate-buffered saline). (c) Water contact angle and (d) surface energy of nanoliposomes/chitosan blend films measured after 7, 14 and 21 days when incubated in PBS at 37 °C.
3.1.4. Fourier transform infrared spectroscopy. FT-IR spectra of chitosan and nanoliposomes/chitosan blend thin film are shown in Fig. 2. Only the spectra of the thin films chitosan, ns–cht 4, and nf–cht 4 were shown in this paper. The concentration of nanoliposomes had no effect on the FT-IR spectra.
image file: c6ra13568d-f2.tif
Fig. 2 Representative FTIR spectrum of pure chitosan, ns–cht, and nf–cht blend thin films. The nanoliposomes/chitosan blend films were named ns–cht for soya and nf–cht for salmon (e.g. ns–cht 1 means that the concentration of soya nanoliposomes in the film is 1 mg mL−1).

Comparing with the reference frequency of Coates,60 the difference in measured and indexed peaks does not exceed 20 cm−1.

The peaks of C–N, ν(C–O–C), C–H/C–C, the tertiary alcohol, the carbonyl stretch (amide I) and bending NH2 (amide II) could be clearly observed for the thin films. Among these peaks, the absorption at 1000–1200 cm−1 is consistent with the saccharide nature of chitosan. The peaks around 1050 cm−1 and 1074 cm−1 correspond to the vibration ν(C–O–C). The peaks at 1143 cm−1 and 1155 cm−1 represent the vibration of the C–H and C–C bonds. The vibration of the tertiary alcohol is around 1368 cm−1 and 1412 cm−1. The peaks at 1529 cm−1 and 1660 cm−1 correspond to the vibration of the amide groups I and II.

The peaks correspond to the specific bonds of phospholipids could be observed. We may identify the ester bonds at 1730 cm−1 and 1738 cm−1, the methylene symmetric stretch (–CH2–) around 2844 cm−1 and 2868 cm−1, and the methyne stretch (C–H) near 2911 cm−1 and 2916 cm−1. Peaks position and the corresponding groups are summarized in Table 2.

Table 2 The functional groups/assignment of pure chitosan and nanoliposomes/chitosan blend films. The films were named ns–cht for soya and nf–cht for salmon. 4 indicates that the concentration of nanoliposomes in the film is 4 mg mL−1. The reference frequencies were via ref. 58
Functional group/assignment Reference frequency (cm−1) Chitosan ns–cht 4 nf–cht 4
C–N 1090–1020 1014 1034 1017
ν(C–O–C) 1150–1050 1069 1050 1074
C–H/C–C 1225–950/1350–1000 1145 1143 1155
Amide III (C–N, N–H) 1390–1325 1374 1374 1374
Tertiary alcohol 1410–1310 1396 1391 1368
Amide II (N–H) 1650–1550 1529 1533 1531
Amide I (N–H) 1650–1590 1619 1619 1660
Ester 1735–1750 1731 1730
Methylene sym. stretch (–CH2–) 2865–2845 2879 2868 2844
Methyne stretch (C–H) 2900–2880 2896 2912 2911


Compared with thin films of pure chitosan, the vibration C–N of ns–cht 4 shifted to 1034 cm−1, and the vibration ν(C–O–C) shifted to 1050 cm−1. The tertiary alcohol vibration of nf–cht 4 shifted to 1368 cm−1, and the amide I bond shifted to 1660 cm−1. The amide I bond had almost no shift for ns–cht 4, the addition of soya nanoliposomes does not change the bond amide I of pure chitosan. On contrast, the adding of salmon nanoliposomes may influence the chitosan conformation on the amide I bond. This could be explained by the variety of polyunsaturated fatty acids (PUFAs) present in salmon nanoliposomes. The spectra of FTIR confirmed that there are no new bonds formed after the adding of nanoliposomes in chitosan-base films. Only interactions at the chemical level could be detected using this technique between the nanoliposomes and chitosan.

3.1.5. Torsional harmonic atomic force microscopy analysis (TH-AFM). Fig. 3a, d and g show that the surface microstructure of films was slightly affected by adding nanoliposomes. The statistical parameters related with sample roughness (Table 3) indicate that only the asperity height distribution of ns–chitosan is affected by the incorporation of nanoliposomes.
image file: c6ra13568d-f3.tif
Fig. 3 TH-AFM analysis of nanoliposomes/chitosan blend thin films. 3D height images of pure chitosan (a), ns–chitosan (d), nf–chitosan (g) thin film surfaces. DMT modulus images of pure chitosan (b), ns–chitosan (e), nf–chitosan (h) thin film surfaces. Adhesive force images of pure chitosan (c), ns–chitosan (f), nf–chitosan (i) thin film surfaces. Ns–cht and nf–cht label the soya and salmon nanoliposomes/chitosan blend films, respectively.
Table 3 Average roughness (Ra), root mean square roughness (Rq), skewness (Sk), and kurtosis (Ek) for films of chitosan and blends with soya and salmon nanoliposomes
Thin film Ra (nm) Rq (nm) Sk (nm) Ek (nm)
Chitosan 4 5 1.0 5
ns–cht 15 20 0.3 3
nf–cht 3 4 0.5 4


Table 3, confirm that all samples have Skewness (Sk) values superior to 0 and kurtosis (Ek) superior to 3 nm, indicating a concentration of material far from the top of the profile and large sharp peaks and valleys. Pure chitosan (Fig. 3a) and nf–cht films (Fig. 3g) present a smooth morphology with similar Ra and Rq values. The ns–cht surface (Fig. 3d) exhibits height deviations from mean surface values 4 folds superior to that of both pure chitosan and nf–cht films (Ra around 15 nm and Rq around 20 nm).

Nanomechanical properties of chitosan and nanoliposomes/chitosan blend films, characterized by TH-AFM, show that contact rigidity on the surface of chitosan (around 1.5 GPa) and nf–cht films (around 1.3 GPa) is in average higher than on the ns–cht films (around 0.6 GPa). In the case of ns–cht, the existence of micro-domains surface (Fig. 3d) can be associated with local variation of mechanical properties (Fig. 3e).

The adhesion images are presented for chitosan, ns–cht and nf–cht films in Fig. 3c, f and i. Such results follow the same trend as the Young moduli. The adhesion forces include contributions from van der Waals forces, electrostatic forces and chemical bonding forces.61 The results show that adhesive force of the nf–cht films (16.4 nN) is somewhat higher than that of chitosan (15.5 nN). The ns–cht films have a smallest adhesive force (11.7 nN). The variations observed by adding nanoliposomes follows the same tendencies than the variations of non-dispersive component, γps, of surface energy determined by WCA (see Table 1). Thus the adhesion force variations can be attributed to hydrogen bonds induced on the surface by adding nanoliposomes.62 This fact is confirmed by FT-IR analysis (Fig. 1 and Table 1). By adding salmon nanoliposomes, the average adhesion forces were improved between the blend thin films and the silicon-tips, but the surface became heterogeneous in term of chemical properties (i.e. due to hydrogen bonds) (Fig. 3f). Thus, the presence of well-defined micro-domains surfaces can be also associated with local variation of adhesive force (Fig. 3f).

3.2. In vitro biocompatibility analysis of scaffolds

The cytotoxicity of the two types of nanoliposomes/chitosan blend films was evaluated after 24 h of cell seeding by LDH assay, where chitosan alone was considered as control. There is no statistical significant cytotoxicity differences between nanoliposomes/chitosan blend films and pure chitosan (p = 0.2015). All the scaffolds showed a good biocompatibility for hMSCs.

It was shown before that over 2 mg mL−1 of nanoliposomes based on soya lecithin is toxic for mesenchymal stem cells.38 In that study, salmon nanoliposomes showed to elicit a better cell proliferation than soya nanoliposomes because of a high percentage of polyunsaturated fatty acids (PUFAs). The optimal concentrations of soya and salmon nanoliposomes are 10.3 μg mL−1 and 5.2 μg mL−1.38 In our study, the nanoliposomes concentrations inside chitosan films are 100, 200 and 400 folds superior to these optimal concentrations used. That means that adding appropriate concentration of nanoliposomes in chitosan-based biomaterial could favour cell adhesion and proliferation.

3.3. In vitro behaviour of hMSCs in close contact to scaffolds

3.3.1. Fluorescent microscopy. Actin microfilaments of the cytoskeleton were labelled with phalloidin and the DNA was stained with DAPI. hCSMs' morphology was visualized by fluorescence microscopy. Time-dependent spreading of the green fluorescent actin skeleton is depicted in Fig. 4. Cell nuclei are visible as blue dots. At day 14, hMSCs exhibited a lower cell spreading with a good proliferation (Fig. 4a). The cells seem to proliferate, aggregate and form clusters on the nanoliposomes/chitosan blend films showing that these matrices provide an adequate support for the growth and proliferation of the hMSCs, with a higher cytoskeleton staining for ns–cht 1 compared to nf–cht 1 (Fig. 4b and c).
image file: c6ra13568d-f4.tif
Fig. 4 Human mesenchymal stem cells (hMSCs) attachment and spreading on nanoliposomes functionalized chitosan films. Ns–cht and nf–cht labels the soya and salmon nanoliposomes/chitosan blend films, respectively. 1, 2, and 4 indicate that the concentrations of nanoliposomes are 1, 2, and 4 mg mL−1. Four representative images were selected: at day 14 for pure chitosan and ns–cht 1 films (a and b) and at days 14 and 21 for nf–cht 1 films (c and d). The cells were fixed and stained with phalloidin (actin filaments, green) and DAPI (nuclei, bleu) before visualization by fluorescent microscopy. Bars indicate 50 μm. (a) hMSCs exhibit little cytoskeleton staining, showing lower cell spreading and a good proliferation rate at day 14. (b) Cells seeded onto ns–cht 1 show an extensive cell spreading. (c) nf–cht 1 films exhibit cell confluence on the surfaces at day 14, with a lower cytoskeleton staining. (d) Cells tend to took off then nf–cht 1 films at day 21.
3.3.2. DNA quantification on the samples. The hMSCs expansion was monitored until 21 days by following DNA concentration for each condition (Fig. 5a). A weak DNA concentration at day 7 corresponds to a low cell density as cells begin to proliferate and start to colonize the surface of the different films. No DNA was detected at days 14 and 21 for ns–cht 4 because hMSCs took off the scaffold and died. At day 14, an increase of DNA concentration is observed for every condition other than ns–cht 4: hMSCs grow on the scaffolds and only nf–cht 1 reaches a higher value than chitosan. This DNA content increases progressively until day 21 for nf–cht 2 and 4, but more weakly for nf–cht 4. At day 21, DNA quantity remains stable for chitosan and ns–cht 2 as hMSCs reach confluence on the culture surface whereas ns–cht 1 presents a slight increase compared to day 14. nf–cht 1 shows a decrease probably due to over confluence triggering.
image file: c6ra13568d-f5.tif
Fig. 5 (1) DNA quantification of hMSCs colonizing chitosan and nanoliposomes/chitosan blend films during 21 days. There are no statistical significant differences between nanoliposomes/chitosan blend films and pure chitosan on day 7. * indicate statistical significant differences between nf–cht 1 and other films on 14th day (p < 0.01). ** indicate statistical significant differences between ns–cht 1 and ns–cht 2; and also nf–cht 1, nf–cht 2 and nf–cht 4 on day 21 (p < 0.01). (2) Evaluation of cell metabolic activity in function of nanoliposomes concentration in the scaffolds in culture medium until 21 days. Cell metabolic activity results on the different membrane were presented in fold versus plastic results. The results show that metabolic activity increases for all cells at day 7, then ad ecreased at day 14. This value re-increased at day 21 for ns–cht 1, ns–cht 2, nf–cht 1, and nf–cht 4; it kept stable for chitosan and nf–cht 2 films. ns–cht and nf–cht mean soya and salmon nanoliposomes/chitosan blend films, respectively. 1, 2, and 4 indicate that the concentrations of nanoliposomes are 1, 2, and 4 mg mL−1. Results represent mean ± S.D. of data obtained from at least three independent experiments. * indicate statistical significant differences between ns–cht 2 and chitosan, ns–cht 1, ns–cht 4, nf–cht on 7th day (p < 0.05). ** indicate statistical significant differences between ns–cht 1, nf–cht 1, nf–cht 2 and chitosan, ns–cht 2, nf–cht 4 on day 14 (p < 0.01). *** indicate statistical significant differences of ns–cht 1 and nf–cht 1 compared with chitosan, ns–cht 2, nf–cht 1, and nf–cht 4 on 21st day (p < 0.01). ND: not determined for ns–cht 4 films. (3) Metabolic activity normalized to the DNA content. Metabolic activity values were normalized according to DNA quantity for each scaffold. * indicate statistical significant differences between nf–cht 1 films and chitosan, ns–cht and other nf–cht films at day 7 (p < 0.001). Here, ns–cht and nf–cht mean soya and salmon nanoliposomes/chitosan blend films, respectively. 1, 2, and 4 indicate that the concentrations of nanoliposomes are 1, 2, and 4 mg mL−1. Results represent mean ± S.D. (n = 3; * p < 0.05; ** p < 0.01; *** p < 0.001).
3.3.3. hMSCs metabolic activity. The metabolic activity was based on the ability of the living cells to reduce tetrazolium salt of MTT into formazan crystals. All cells showed an important metabolic activity at day 7 compared to the following days. This activity is due to cell growth and also to the adaptation of the cells onto the different scaffolds, a process that stimulates their metabolism (Fig. 5b). No activity was detected at days 14 and 21 for ns–cht 4 because hMSCs took off the scaffold and died. A decrease of metabolic activity was observed at day 14 for all the scaffolds except ns–cht 4. Then, except for chitosan and nf–cht 2, this activity increased again at day 21, even reaching the same level as day 7. A ratio of metabolic activity and DNA content showed in Fig. 5c allows normalizing metabolic activity according to DNA quantity. As DNA content is a reflection of cell number, this ratio can be considered as normalized metabolic activity in function of cell number. The results suggest that the cells are strongly active during 7 days. Once the confluence becomes stable, the metabolic activity of cells returned to a normal average level (see day 14 and day 21 in Fig. 5c).

4. Cell matrix interactions

The interaction of cells and biomaterials is a complex dynamic process, and it depends on the cell type and the characteristics of biomaterials. The modification of the chitosan matrix by including nanoparticles not only improves the mechanical strength but also affected the cellular response.63

By comparing the surface characteristics of these films, we found that there is no significant different on Sk and Ek (profile symmetry and height balance, respectively), that means the shape of the surface asperities are comparable. Besides, Ra and Rq of ns–cht films are higher than the values of pure chitosan films and nf–cht films. By comparing the surface properties (mechanical properties and adhesive forces) of these films, we found that ns–cht is the only one heterogeneous. The polyunsaturated fatty acids (PUFAs), especially eicosapentaenoic acid (EPA, 20:5n-3) and docosahexaenoic acid (DHA, 22:6n-3) may improve the homogeneity of membranes. Oppositely the height proportion of saturated fatty acid can induce an aggregation of polar lipids at the base of asperities inducing a decrease of local mechanical and chemical properties. This surface architecture (topography and properties) may have an influence on cell behaviour.

Modifications of the surface chemistry and morphology change the surface hydrophilicity.64 Bio-environment/material interactions could be determined by surface proprieties. Cell metabolic activity and proliferation depend on both nanoliposomes concentration and lecithin composition. In a number of studies, cell adhesion appears to be maximized on surface with intermediate wettability (WCA 60–80°).65 Some reports have identified specific chemical groups on the polymer surface, such as –OH and –C[double bond, length as m-dash]O, as important factors in modulating the fate of surface-attached cells.65 The nanoliposomes increased the amount of ester groups in chitosan-based films; this could explain the increased cell adhesion of ns–cht 1 and nf–cht 1. Indeed, ns–cht films augment cell proliferation at a concentration of 1 mg mL−1 whereas salmon seems to have a higher impact at this concentration. These differences may be explained by the kind of fatty acids composition of each lecithin. Soya lecithin is composed by more unsaturated fatty acids, whereas salmon lecithin contains a large variety of fatty acids. That is why nf–cht films seem to have more significant influence on cell proliferation at lower concentration. Düzgüneş and Nir66 reported that different cells may have different ‘receptors’ to liposome which impact on their ability to endocytose fatty acids. The diversity of salmon lecithin fatty acids may provide better chance to get liposome–cell binding than soya lecithin, which induced a comparable activity with a lower concentration because of a higher level of internalization of fatty acids. It is clear that adding a certain amounts of nanoliposomes stimulates cell proliferation. However, if a high amount is used, the stimulatory effects on cell proliferation decreased (>2 mg mL−1).

The charge density of the polymer surface is another argument for cell adhesion and proliferation. In the study of Schipper et al., the toxicity of chitosan appears to be related to the positive charge density.67 Adding negatively nanoliposomes reduced charge density caused less cell toxicity.

Many commonly used natural polymers exhibit complex compositions. Thus there is no way to predict the extent of attachment, spreading, or growth of cultured cells on such systems. To obtain information on interactions between cells and natural polymers high-throughput techniques may be employed. General predictive correlations may be also emerge, as more complete characterization of polymer systems, including chemical composition of material, surface physico-chemical properties, equilibrium water content, and nanoscale topography, are collected. We believe that this work can contribute to this effort, in particular on the impact of combining liposomes into natural-based macromolecular systems.

5. Conclusions

In this work, we developed and characterized chitosan films functionalized with nanoliposomes which were based on soya and salmon lecithin. Cytotoxic assays showed that none of the films induced any cytotoxic effect.

The scaffolds nf–cht 1 supported the highest cell proliferation of hMSCs among all formulations. Such supports showed a stable and favorable contact angle during 21 days in PBS (63° ± 2°), a best swelling ratio after 24 h in PBS (171%), and higher values of both stiffness (1.3 GPa) and adhesive forces (16.4 nN). Thus, nf–cht 1 is the formulation with higher potential to be used in the development of chitosan-based biomaterials, in particular for tissue engineering applications.

References

  1. R. Langer, Pharm. Res., 1997, 14, 840–841 CrossRef CAS.
  2. N. Di Maggio, E. Piccinini, M. Jaworski, A. Trumpp, D. J. Wendt and I. Martin, Biomaterials, 2011, 32, 321–329 CrossRef CAS PubMed.
  3. S. Cosson, E. A. Otte, H. Hezaveh and J. J. Cooper-White, Tissue Eng. Regener. Med., 2015, 4, 156–164 CAS.
  4. C. Zhao, A. Tan, G. Pastorin and H. K. Ho, Biotechnol. Adv., 2013, 31, 654–668 CrossRef CAS PubMed.
  5. J. F. Mano, G. A. Silva, H. S. Azevedo, P. B. Malafaya, R. A. Sousa, S. S. Silva, L. F. Boesel, J. M. Oliveira, T. C. Santos, A. P. Marques, N. M. Neves and R. L. Reis, J. R. Soc., Interface, 2007, 4, 999–1030 CrossRef CAS PubMed.
  6. L. Chen, C. Zhu, D. Fan, B. Liu, X. Ma and Z. Duan, et al., J. Biomed. Mater. Res., Part A, 2011, 99, 395 CrossRef PubMed.
  7. Q. Z. Chen, S. E. Harding, N. N. Ali, A. R. Lyon and A. R. Boccaccini, Mater. Sci. Eng., R, 2008, S9, 1–37 CrossRef.
  8. H. Jawad, N. N. Ali, A. R. Lyon, Q. Z. Chen, S. E. Harding and A. R. Boccaccini, Tissue Eng. Regener. Med., 2007, 1, 327–342 CrossRef CAS PubMed.
  9. J. Zhang, Current Treatment Options in Cardiovascular Medicine, 2015, 17, 37 CrossRef PubMed.
  10. T. Tchemtchoua, G. Atanasova, A. Aqil, P. Filée, N. Garbacki, O. Vanhooteghem, C. Deroanne, A. Noël, C. Jérome, B. Nusgens, Y. Poumay and A. Colige, Biomacromolecules, 2011, 12, 3194–3204 CrossRef PubMed.
  11. K. Chaudhury, V. Kumar, J. Kandasamy and S. R. Choudhury, Int. J. Nanomed., 2014, 9, 4153–4167 CrossRef PubMed.
  12. B. C. Tai, C. Du, S. Gao, A. C. Wan and J. Y. Ying, Biomaterials, 2010, 31, 48–57 CrossRef CAS PubMed.
  13. F. Chen, M. Tian, D. Zhang, J. Wang, Q. Wang and X. Yu, et al., Mater. Sci. Eng., C, 2012, 32, 310 CrossRef CAS.
  14. S. Hajji, I. Younes, O. Ghorbel-Bellaaj, R. Hajji, M. Rinaudo, M. Nasri and K. Jellouli, Int. J. Biol. Macromol., 2014, 65, 298–306 CrossRef CAS PubMed.
  15. N. M. Alves and J. F. Mano, Int. J. Biol. Macromol., 2008, 43, 401–414 CrossRef CAS PubMed.
  16. T. L. Yang, Int. J. Mol. Sci., 2011, 12, 1936 CrossRef CAS PubMed.
  17. Y. I. Kim, S. J. Seo, H. S. Moon, M. K. Yoo, I. Y. Park and B. C. Kim, et al., Biotechnol. Adv., 2008, 26, 1 CrossRef PubMed.
  18. J.-Y. Je and S.-K. Kim, in Chitosan as Potential Marine Nutraceutical, Adv. Food Nutr. Res., ed. Se-Kwon Kim, Academic Press, 2012, pp. 121–135 Search PubMed.
  19. W.-F. Lai and M. C.-M. Lin, J. Controlled Release, 2009, 134, 158 CrossRef CAS PubMed.
  20. S. K. Nandi, B. Kundu and D. Basu, Mater. Sci. Eng., C, 2013, 33, 1267 CrossRef CAS PubMed.
  21. M. Ishihara, M. Fujita, K. Obara, H. Hattori, S. Nakamura and M. Nambu, et al., Curr. Drug Delivery, 2006, 3, 351 CrossRef CAS.
  22. J.-Y. Lee, S.-H. Nam, S.-Y. Im, Y.-J. Park, Y.-M. Lee and Y.-J. Seol, et al., Proc. Tenth Int. Symp. Recent Adv. Drug Deliv. Syst, 2002, vol. 78, p. 187 Search PubMed.
  23. K. Masuoka, M. Ishihara, T. Asazuma, H. Hattori, T. Matsui and B. Takase, et al., Biomaterials, 2005, 26, 3277 CrossRef CAS PubMed.
  24. R. A. A. Muzzarelli, F. Greco, A. Busilacchi, V. Sollazzo and A. Gigante, Carbohydr. Polym., 2012, 89, 723 CrossRef CAS PubMed.
  25. T.-L. Yang and T.-H. Young, J. Cell. Mol. Med., 2009, 13, 2853 CrossRef CAS PubMed.
  26. S. A. DeLong, A. S. Gobin and J. L. West, Proc. Twelfth Int. Symp. Recent Adv. Drug Deliv. Syst, 2005, vol. 109, p. 139 Search PubMed.
  27. C. A. Custódio, C. M. Alves, R. L. Reis and J. F. Mano, J. Tissue Eng. Regener. Med., 2010, 4, 316–323 CrossRef PubMed.
  28. S. S. Silva, S. M. Luna, M. E. Gomes, J. Benesch, I. Pashkuleva, J. F. Mano and R. L. Reis, Macromol. Biosci., 2008, 8, 568–576 CrossRef CAS PubMed.
  29. N. Monteiro, M. Martins, A. Martins, N. A. Fonseca, J. N. Moreira and R. L. Reis, Acta Biomater., 2015, 18, 196–205 CrossRef CAS PubMed.
  30. A. D. Bangham, M. M. Standish and J. C. Watkins, J. Mol. Biol., 1965, 13, 238 CrossRef CAS PubMed.
  31. H. Gao, Q. Zhang, Z. Yu and Q. He, Curr. Pharm. Biotechnol., 2014, 15, 210–219 CAS.
  32. K.-I. Joo, L. Xiao, S. Liu, Y. Liu, C.-L. Lee and P. S. Conti, et al., Biomaterials, 2013, 34, 3098 CrossRef CAS PubMed.
  33. Y. Liu, J. Fang, Y.-J. Kim, M. K. Wong and P. Wang, Mol. Pharm., 2014, 11, 1651 CrossRef CAS PubMed.
  34. K. Bowey, J.-F. Tanguay and M. Tabrizian, Eur. J. Pharm. Biopharm., 2014, 86, 369 CrossRef CAS PubMed.
  35. A. Abreu, E. Castanheira, M.-J. Queiroz, P. Ferreira, L. Vale-Silva and E. Pinto, Nanoscale Res. Lett., 2011, 6, 482 CrossRef PubMed.
  36. T. A. P. F. Doll, S. Raman, R. Dey and P. Burkhard, J. R. Soc., Interface, 2013, 10, 20120740 CrossRef PubMed.
  37. M. R. Mozafari, C. R. Reed and C. Rostron, Int. J. Pharm. Pharm. Sci., 2007, 62, 205 CAS.
  38. E. Arab Tehrany, C. J. F. Kahn, C. Baravian, B. Maherani, N. Belhaj and X. Wang, et al., Colloids Surf., B, 2012, 95, 75 CrossRef CAS PubMed.
  39. H. Y. Zhang, E. Arab Tehrany, C. J. F. Kahn, M. Ponçot, M. Linder and F. Cleymand, Carbohydr. Polym., 2012, 88, 618 CrossRef CAS.
  40. C. L. Kline, S. S. Shanmugavelandy, M. Kester and R. B. Irby, Cancer Biol. Ther., 2009, 8, 1831 CrossRef CAS PubMed.
  41. B. Rai, J. L. Lin, Z. X. H. Lim, R. E. Guldberg, D. W. Hutmacher and S. M. Cool, Biomaterials, 2010, 31, 7960 CrossRef CAS PubMed.
  42. R. El Omar, J. Beroud, J. F. Stoltz, P. Menu, E. Velot and V. Decot, Tissue Eng., Part B, 2014, 20, 523 CrossRef PubMed.
  43. S. C. C. C. Miranda, G. A. B. Silva, R. C. R. Hell, M. D. Martins, J. B. Alves and A. M. Goes, Arch. Oral Biol., 2011, 56, 1 CrossRef CAS PubMed.
  44. W.-B. Tsai, Y.-R. Chen, W.-T. Li, J.-Y. Lai and H.-L. Liu, Carbohydr. Polym., 2012, 89, 379 CrossRef CAS PubMed.
  45. M. S. Kim, S. J. Park, B. K. Gu and C.-H. Kim, Carbohydr. Polym., 2012, 87, 2683 CrossRef CAS.
  46. Z. Gao, L. Zhang, J. Hu and Y. Sun, Biol. Med., 2013, 9, 174–184 CAS.
  47. Y.-C. Huang and T.-J. Liu, Acta Biomater., 2012, 8, 1048 CrossRef CAS PubMed.
  48. W.-B. Tsai, Y.-R. Chen and H.-L. Liu, J. Taiwan Inst. Chem. Eng., 2013, 44, 1 CrossRef CAS.
  49. H. Rammal, J. Beroud, M. Gentils, P. Labrude, P. Menu and H. Kerdjoudj, et al., Bio-Med. Mater. Eng., 2013, 23, 299 CAS.
  50. C. A. Custódio, M. T. Cerqueira, A. P. Marques, R. L. Reis and J. F. Mano, Biomaterials, 2015, 43, 23–31 CrossRef PubMed.
  51. M. Linder, E. Matouba, J. Fanni and M. Parmentier, Eur. J. Lipid Sci. Technol., 2002, 104, 455 CrossRef CAS.
  52. D. K. Owens and R. C. Wendt, J. Appl. Polym. Sci., 1969, 13, 1741 CrossRef CAS.
  53. O. Sahin, Rev. Sci. Instrum., 2007, 78, 103707 CrossRef PubMed.
  54. B. V. Derjaguin, V. M. Müller and Y. P. Toporov, J. Colloid Interface Sci., 1975, 53, 314–326 CrossRef CAS.
  55. P. E. Poloni, S. Etienne, E. Velot, P. Netter and A. Bianchi, PPAR Res., 2010, 635912,  DOI:10.1155/2010/635912 , Epub 2010 Oct A.
  56. Y.-R. Choi, J.-S. Kwon, D.-H. Song, E. H. Choi, Y.-K. Lee and K.-N. Kim, et al., Proc. 4th Int. Conf. Microelectron. Plasma Technol. ICMAP 2012 Jeju Korea, 2012, vol. 547, p. 235 Search PubMed.
  57. J. L. E. Ivirico, M. Salmerón-Sánchez, J. L. G. Ribelles, M. M. Pradas, J. M. Soria and M. E. Gomes, et al., J. Biomed. Mater. Res., Part B, 2009, 91, 277 CrossRef PubMed.
  58. W. Song, D. D. Veiga, C. A. Custódio and J. F. Mano, Adv. Mater., 2009, 21, 1830–1834 CrossRef CAS.
  59. H. Zhu, J. Ji, M. A. Barbosa and J. Shen, J. Biomed. Mater. Res., Part B, 2004, 71, 159 CrossRef PubMed.
  60. J. Coates, Encycl. Anal. Chem., 2000, p. 10815 Search PubMed.
  61. G. V. Lubarsky, M. R. Davidson and R. H. Bradley, Surf. Sci., 2004, 558, 135–144 CrossRef CAS.
  62. F. M. Fowkes, J. Phys. Chem., 1964, 68, 3515–3520 CrossRef CAS.
  63. J. Mota, N. Yu, S. G. Caridade, G. M. Luz, M. E. Gomes, R. L. Reis, J. A. Jansen, X. F. Walboomers and J. F. Mano, Acta Biomater., 2012, 8, 4173 CrossRef CAS PubMed.
  64. S. M. Luna, S. S. Silva, M. E. Gomes, J. F. Mano and R. L. Reis, J. Biomater. Appl., 2011, 26, 101 CrossRef CAS PubMed.
  65. W. M. Saltzman and T. R. Kyriakides, Princ. Tissue Eng., 2014, 3, 385 Search PubMed.
  66. N. Düzgüneş and S. Nir, Pharmacokinetics, 1999, 40, 3 Search PubMed.
  67. N. M. Schipper, K. Vårum and P. Artursson, Pharm. Res., 1996, 13, 1686 CrossRef CAS.

Footnote

Electronic supplementary information (ESI) available. See DOI: 10.1039/c6ra13568d

This journal is © The Royal Society of Chemistry 2016