Simultaneous and rapid dye removal in the presence of ultrasound waves and a nano structured material: experimental design methodology, equilibrium and kinetics

Ebrahim Sharifpoura, Hedayat Haddadiab, Mehrorang Ghaedi*c, Arash Asfaramc and Shaobin Wangd
aDepartment of Chemistry, Faculty of Sciences, Shahrekord University, P.O. Box 115, Shahrekord, Iran
bNanotechnology Research Center, Shahrekord University, 8818634141, Shahrekord, Iran
cChemistry Department, Yasouj University, Yasouj 75918-74831, Iran. E-mail: m_ghaedi@mail.yu.ac.ir; m_ghaedi@yahoo.com; Fax: +98 741 2223048; Tel: +98 741 2223048
dDepartment of Chemical Engineering, Curtin University, G.P.O. Box U1987, Perth, Western Australia 6845, Australia

Received 22nd May 2016 , Accepted 7th July 2016

First published on 7th July 2016


Abstract

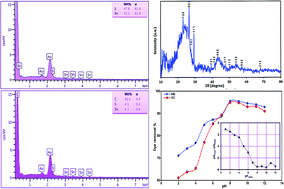
Tin sulfide nanoparticles loaded on activated carbon (SnS-AC) were prepared and characterized by FE-SEM, XRD, FT-IR and EDX. Central composite design (CCD) by response surface methodology (RSM) was employed to investigate the influences of process parameters like adsorbent mass, ultrasound time, initial safranin O (SO) and methylene blue (MB) concentrations at pH of 8.0 on the simultaneous adsorption of the two dyes on the SnS-AC. Analysis of variance (ANOVA) and t-test statistics were used to check the significance of the independent variables and their interactions on the adsorption efficiency. The predicted values were in good agreement with the experimental data MB (R2 = 0.994) and SO (R2 = 0.984), revealing the suitability of the constructed equations and CCD success in optimizing the adsorption process. Experimental results demonstrate high applicability and efficiency of dye removal by SnS-AC with more than 95% over a very short time (12 mg L−1 of each dye, 0.025 g of adsorbent at pH of 8.0). The adsorption for single and binary solutions of SO and MB followed the Freundlich model and the maximum adsorption capacities for MB and SO were estimated to be 71.1 and 67.3 mg g−1, respectively.


1. Introduction

Leather, textile, paper and pulp industries discharge various dyeing wastewater into rivers and lands. The dyes in water due to their high visibility are undesirable1 and are associated with varying damage effects to humans and animals,2 which take place via direct contact (eye burns), inhalation (rapid or difficult breathing) or indigestion (nausea, vomiting, mental confusion and others).3 Safranin-O (SO, Fig. S1) as one of most traditional synthetic dyes is used in flavoring and coloring candies and cookies,4 dyeing tannin, cotton, bast fibers, wool, silk, leather and paper.5 SO causes injuries to people like irritation to the mouth, throat, tongue, lips and pain in the stomach, which may lead to nausea, vomiting and diarrhea.6 Methylene blue (MB, Fig. S1) is generally used for temporarily coloring hair, dyeing cottons and wools, coating for paper stock and as an analytical reagent.7–9 Different biological and physical/chemical methods like anaerobic/aerobic treatment, coagulation/flocculation, oxidation/ozonation, membrane separation and sorption are good approaches for water cleaning, while adsorption process is a successful candidate for dye removal from wastewater.

Activated carbon (AC) as an adsorbent has advantages such as low cost and non-toxic nature, but sometimes it shows a low adsorption capacity.10 Due to the presence of porous carbon backbone and various reactive functional groups, it is a good candidate to be impregnated and loaded with diverse nano-scaled materials.11 This modification can lead to enhancement in adsorption capacity by increasing reactive center and surface area.12 Some of the AC functional groups, –OH, –COOH, –C[double bond, length as m-dash]O and amide, are facile for loading nanoparticle on the surface, which synergistically improve their adsorption capacity of large various species.13–15

Nanomaterials have been extensively studied in diverse areas for their potential applications because of specific physical and chemical properties.16,17 Recently, nano-structure based adsorbents have attracted great interest for removing environmental pollutants (e.g. small molecules, heavy metal ions, radionuclides, and organic chemicals),18 due to their large specific surface area, hollow and layered structures.19 Meanwhile statistical design techniques in adsorption process is effective for efficiency improvement by reducing time and overall costs via optimization of experiments.14,20,21

The objectives of this study were to synthesize and characterize of tin sulfide nanoparticles loaded on active carbon (SnS-AC) as well as investigate its application for simultaneous removal of cationic dyes from aqueous solution, via optimization using a central composite design (CCD). The Langmuir and Freundlich adsorption isotherms were used to model the adsorption equilibrium. Several kinetic models such as the pseudo first-order, pseudo second-order, intraparticle diffusion and Elovich equations were applied to investigate the dye uptake mechanisms.

2. Materials and methods

2.1. Chemicals and reagents

All chemicals including NaOH, HCl and other reagents were purchased from Merck, Germany. Safranin-O (SO) and methylene blue (MB) were purchased from Sigma Aldrich and used as received. A stock solution of each dye was prepared by dissolving pure powder solid in distilled water (100 mg L−1).

2.2. Preparation of adsorbent

A thioacetamide (CH3CSNH2) solution (10 mL, 0.1 mol L−1) was added into a solution of tin(II) acetate (Sn(CH3COO)2) and trisodium citrate (Na3C6H5O7) at pH 6.0 with vigorously stirring and then the mixed solution was diluted to 50 mL. Heating this mixture at 40 °C leads to the slow formation and growth of citrate-stabilized SnS nanoparticles (milky white precipitate). After 6 h the color of the reaction solution became milky white mixed with light yellow. Then the mixture was separated by a centrifuge and the solid was washed several times with ultra-pure water and ethanol to remove the impurities and tri-sodium citrate. Later, 500 mL of the dispersed SnS nanoparticles suspension (0.5 g L−1) was mixed with 10 g activated carbon under magnetic stirring for 12 h, leading to SnS deposition on the activated carbon surface. The carbon-supported SnS nanoparticles were then dried at 110 °C in an oven for 10 h. A mortar was used to homogeneously ground the carbon-supported SnS nanoparticle powders (SnS-AC).

2.3. Apparatus and instruments

The absorbance of dye solution was measured at the optimum wavelength (λmax) of 662 and 518 nm for MB and SO, respectively, using a UV-Vis spectrophotometer (Perkin Elmer Lambda 25). The spectra of Fourier transform infrared spectroscopy (FTIR) of the adsorbent were obtained using a spectrometer (FTIR 68, JASCO, Japan) in the range of 4000–400 cm−1. An X-ray diffractometer (XRD, Philips PW 1800, Nederland) using Cu Kα radiation (40 kV, 40 mA) was used for identification of the structural phase. The surface structures of the adsorbent were obtained using a field emission scanning electron microscope (FE-SEM, Hitachi S-4160, Japan). Chemical composition of the adsorbent was performed by Oxford INCA II energy dispersive X-ray field emission scanning electron microscopy (FE-SEM-EDS). An ultrasound bath system with a working frequency of 40 kHz and 130 W power (Tecno-GAZ SPA Ultra Sonic System) was used to assist the adsorption of dyes from water onto SnS-AC. A Metrohm 686 pH meter (Switzerland) with a glass combination electrode was used throughout this study.

2.4. Ultrasonic-assisted adsorption procedure

The stock solutions (100 mg L−1) of SO and MB were diluted to obtain standard solutions in a range of 4 to 20 mg L−1. SnS-AC at 0.003–0.0271 g and 50 mL binary-component solution were shaken and mixed completely by sonication over 0.5 to 6.5 min with a water bath to control temperature at 25 °C. The liquid and solid phases were separated by centrifuging at 3500 rpm for 3 min, while dye concentration was determined spectrophotometrically at 518 and 662 nm for SO and MB, respectively. The calibration graph of absorbance versus concentration obeyed a linear Lambert–Beer relationship. Removal efficiency expressed as percent adsorption of dyes was determined using the following equation:22
 
image file: c6ra13286c-t1.tif(1)
where C0 and Ce are the initial and final concentrations of dye (mg L−1), respectively.

The extent of adsorption at equilibrium (qe, mg g−1) was calculated from the initial and equilibrium dye concentrations in solution based on the mass balance equation as,19

 
image file: c6ra13286c-t2.tif(2)
where V is the volume (mL) of solution and W is the amount (g) of adsorbent. The adsorption isotherm was evaluated using dye concentrations viz. 12 mg L−1 in single and binary systems at temperature of 25 °C and the optimum solution pH = 8.0.

The kinetics of dye adsorption was studied at temperature of 25 °C for a fixed dye concentration (12 mg L−1) at solution pH of 8.0. The extent of dye adsorbed (qt) at each preselected time interval (t) was evaluated together with that at equilibrium (qe).

2.5. Experimental design

Optimum conditions corresponding to efficient adsorption of SO and MB onto SnS-AC were determined by means of central composite design (CCD) under response surface methodology (RSM) to evaluate the relationship between cluster of controlled experimental factors and respective responses according to one or more selected criteria. In this work, the optimization studies were carried out by studying the effects of four variables including adsorbent mass, sonication time, MB and SO concentrations which were coded according to eqn (3):10
 
image file: c6ra13286c-t3.tif(3)
where X is the coded variables, x is the actual variables. The behavior of the system is explained by the empirical second-order polynomial model. The Design-Expert 7.0.0 (Stat-Ease, Inc., Minneapolis, MN, USA) software was used for regression and graphical analysis of the obtained data. A design of 31 experiments was achieved for the four factors i.e. sixteen factorial points, eight axial (star) points and seven replicates at central points. The optimum values of the selected variables were obtained by solving the regression equation at desired values of the process responses. Each of the parameters was coded at five levels: −α, −1, 0, +1 and +α, while their interval and level in coded values corresponding to RSM and final responses assigned to each point for both dyes are given in Table 1.
Table 1 The central composite experimental design and the response for the yield of dye adsorption
Factors Unit Levels
α Low (−1) Central (0) High (+1) +α
a Experimental values of response.b Predicted values of response by RSM proposed model.
A: adsorbent mass g 0.003 0.009 0.015 0.021 0.0027
B: ultrasound time min 0.5 2.0 3.5 5 6.5
C: MB concentration mg L−1 4 8 12 16 20
D: SO concentration mg L−1 4 8 12 16 20

Run Factors R% MB R% SO
A B C D Observeda Predictedb Observeda Predictedb
1 0.009 2 8 8 90.0 88.5 61.9 60.6
2 0.021 2 8 8 98.0 98.3 90.2 92.1
3 0.009 5 8 8 91.8 92.2 62.9 65.0
4 0.021 5 8 8 98.0 98.4 94.7 95.0
5 0.009 2 16 8 52.4 52.1 58.0 62.0
6 0.021 2 16 8 80.0 79.2 93.6 89.6
7 0.009 5 16 8 65.4 65.2 68.1 68.6
8 0.021 5 16 8 90.1 88.9 94.6 95.0
9 0.009 2 8 16 84.6 85.2 34.3 36.2
10 0.021 2 8 16 97.0 97.4 66.2 63.6
11 0.009 5 8 16 88.3 89.3 44.1 46.1
12 0.021 5 8 16 98.3 98.0 73.9 72.0
13 0.009 2 16 16 57.7 57.4 42.7 40.3
14 0.021 2 16 16 88.0 87.0 64.0 63.9
15 0.009 5 16 16 71.9 70.9 52.2 52.4
16 0.021 5 16 16 95.3 97.0 75.2 74.4
17 0.003 3.5 12 12 61.1 61.6 49.7 46.2
18 0.027 3.5 12 12 97.4 97.5 96.1 99.7
19 0.015 0.5 12 12 79.6 80.8 50.2 51.6
20 0.015 6.5 12 12 95.1 94.5 67.8 66.5
21 0.015 3.5 4 12 98.4 97.6 72.1 70.9
22 0.015 3.5 20 12 58.8 60.2 73.5 74.7
23 0.015 3.5 12 4 86.3 87.7 88.5 86.7
24 0.015 3.5 12 20 93.2 92.5 40.2 42.0
25 0.015 3.5 12 12 94.4 91.5 72.1 70.4
26 0.015 3.5 12 12 89.7 91.5 68.2 70.4
27 0.015 3.5 12 12 91.0 91.5 72.9 70.4
28 0.015 3.5 12 12 91.9 91.5 69.9 70.4
29 0.015 3.5 12 12 90.7 91.5 67.8 70.4
30 0.015 3.5 12 12 92.1 91.5 72.6 70.4
31 0.015 3.5 12 12 90.5 91.5 69.6 70.4


3. Results and discussion

3.1. Characterization of the adsorbent

The FE-SEM micrograph of SnS-AC (Fig. 1a) shows aggregation of SnS nanoparticles due to their extremely small dimensions and high surface energy, while energy-dispersive X-ray spectroscopy (EDX) from different sample spots (Fig. 1b and c) confirm the presence of C, Sn and S in elemental composition of the SnS-AC. Fig. 2a shows XRD pattern of SnS-AC. A prominent peak was observed at 2θ = 29.95°, which corresponds to the (1 1 1) reflection plane of SnS and the other peaks at 2θ = 22.46°, 24.93°, 27.47°, 28.33°, 39.00°, 43.12°, 44.56°, 48.82°, 50.27°, 54.96° and 68.38° are corresponding to the (1 2 0), (1 2 0), (0 2 1), (1 0 1), (1 3 1), (1 4 2), (0 0 2), (2 1 1), (1 1 2), (1 2 2) and (2 1 2) reflection planes of SnS, respectively. The patterns suggest SnS (JCPDS: 39-0354) has the herzenbergite orthorhombic structure (lattice parameters, a = 4.3137 Å, b = 11.2583 Å and c = 3.9958 Å), where the Sn and S are tightly bonded in a layer. This implies that the particles are polycrystalline SnS with a strong (1 1 1) reflection plane. The preferred orientation of the particles is due to the growth process controlled by nucleation. The particle size from the XRD pattern was found around 48 nm. In the XRD spectrum, no characteristic peaks were observed for other impurities such as SnS2, Sn2S3, and Sn3S4, implying the formation of single-phase mono sulphide. Fig. 2b shows FTIR spectrum of SnS-AC with strong and sharp bands at 615, 1000–1200 and 2354 cm−1, which are attributed to the characteristic peaks of SnS.23,24 Also, a doublet band was observed at 1047 and 1087 cm−1, which is due to SO3 stretching. Another broad band appears at 3250–3500 cm−1, ascribing to OH stretching vibration. The FTIR and XRD confirm the presence of SnS nanoparticles.
image file: c6ra13286c-f1.tif
Fig. 1 (a) SEM image and (b and c) EDX images of the SnS-AC.

image file: c6ra13286c-f2.tif
Fig. 2 (a) XRD spectra, (b) FT-IR spectra of the SnS-AC and (c) the effect of solution pH on dye adsorption onto adsorbent (C0 = 8 mg L−1, adsorbent mass = 0.021 g, sonication time = 4 min and T = 25 °C).

3.2. Effect of solution pH

Solution pH is one of the important parameters controlling dye adsorption. Its effect on SO and MB adsorption onto SnS-AC in binary systems at a pH range of 2.0–12.0 is shown in Fig. 2c. Increasing pH from 2.0 to 12.0 leads to enhanced dye removal from 60 to 95%, which is related to the fact that cationic dyes take a positive charge in water. Thus, in acidic solutions (lower pH), the positively charged surface of a sorbent tends to hinder the adsorption of cationic dyes, while pH rising causes dye adsorption due to an enhanced electrostatic force25 of the adsorbent with negative charge at pH > pHZPC. The maximum adsorption of SO and MB takes place at around pH 8.0, which was selected for all further adsorption experiments.

3.3. Statistical analysis

The experiments were conducted according to the design matrix and the corresponding results are listed in Table 1. The quadratic equations for prediction of the optimum point were obtained according to the CCD and input variables as follows:
 
YR% MB = 98.7 + 1842.0A + 1.8B − 3.3C − 1.2D − 97.3AB + 181.0AC + 25.3AD + 0.4BC + 0.02BD + 0.2CD − 82750.0A2 − 0.4B2 − 0.2C2 − 0.02D2 (4)
 
YR% SO = 41.4 + 2844A + 8.2B − 0.9C − 1.2D − 41.4AB − 40.1AC − 42.0AD + 0.1BC + 0.2BD + 0.04CD + 1717A2 − 1.3B2 + 0.04C2 − 0.1D2 (5)
where Y is the dye adsorption efficiency (R% of SO and MB), A, B, C and D are representing adsorbent mass, ultrasound time, initial SO and MB concentrations, respectively. The analyses of variance (ANOVA) (Table S1) suggest that the model equation derived by RSM could be used to describe the dye removal by SnS-AC adsorbent. It is well-known that a corresponding variable is more significant if its absolute p-value is smaller than 0.05. The calculated F-values corresponding to MB and SO adsorption response models are 185.9 and 70.2, respectively, exceeding the tabulated F-value (F0.05(14, 16) = 2.37) at the 5% level and justify significant differences.26 The lack-of-fit p values of 0.62 for MB and 0.15 for SO, respectively, suggest the applicability and efficiency of the models for good representation of experimental data at various conditions.27 A high R-Squared (R2) value (close to 1) ensures a satisfactory adjustment of the quadratic model and the experimental data.28 As presented in Table S1, the models present high R2 values of 99.4 and 98.4% for MB and SO removal, respectively, indicating good agreement between the experimental and predicted results. Also, the pred-R2 values of 97.6 and 92.2% for MB and SO, respectively, have reasonable and good agreement with the adj-R2 values of 98.8 and 97.0% for MB and SO, respectively. The model's adequate precision (signal to noise ratio) was 25.43, indicating adequate signal and also demonstrating the usability of models to navigate the design space. Fig. 3a–d shows that the predicted values were close to the experimental results of MB and SO adsorption. Fig. 3e and f shows that the residuals were close to the straight line and scattered randomly around with no particular pattern and abnormal adsorption behavior.25 The ratios of signal to noise are greater than 4 at 46.61 and 31.87 for MB and SO, respectively, further confirming that these models can be used to navigate the design space.

image file: c6ra13286c-f3.tif
Fig. 3 (a and b) Predicted vs. experimental, (c and d) residuals vs. run number and (e and f) normal probability plot of residuals dyes removal efficiency.

3.4. Effect of variables as response surface and counter plots

The relationship between independent and dependent variables is illustrated in three-dimensional representations of the response surfaces. The higher values of MB removal efficiencies were obtained by the increases in agitation time and SnS-AC mass (Fig. 4a). The maximum dye removal was found at 4 min sonication.
image file: c6ra13286c-f4.tif
Fig. 4 The response surface plots (a) showing simultaneous influence of adsorbent mass and ultrasound time on MB adsorption (b) showing the interaction between adsorbent mass and SO concentration on SO adsorption and (c) showing the interaction between ultrasound time and SO concentration.

The increased initial dye concentrations also lead to enhancement of adsorption rate and strong dye removal percentage (Fig. 4b). Meanwhile, a larger sonication time enhanced adsorbent dispersion into solution via ultrasonic power and improved adsorption efficiency (Fig. 4c).

3.5. Optimizations using the desirability function

The maximum adsorption efficiencies of MB and SO dyes on SnS-AC and the corresponding optimal experimental conditions were determined using the desirability function by the Design expert software (Fig. 5) and confirmed by further experiments. The optimum conditions were found to be pH 6.0, 3.5 min sonication, 0.025 g SnS-AC, and 12 mg L−1 of MB and SO, giving the maximum MB and SO removal efficiencies of 98.2 and 95.6%, respectively. The predicted optimum conditions were checked experimentally by running six experiments under the same conditions at 25 °C, revealing that MB and SO adsorption efficiencies were 97.6 ± 0.3% and 94.2 ± 0.7%, respectively. The high agreement between replicated results with predicted values strongly supports high reliability and efficiency of the central composite design for the evaluation and optimization of the adsorption variables on removal efficiency of MB and SO.
image file: c6ra13286c-f5.tif
Fig. 5 Desirability ramp for numerical optimization of four independent variables, adsorbent mass, ultrasound time, MB concentration and initial SO concentration.

3.6. Kinetic modelling of dye adsorption

The pseudo first-order (eqn (6)), second-order kinetic (eqn (7)), Elovich (eqn (8)) and intraparticle diffusion (eqn (9)) models were used to describe the adsorption kinetics of dyes onto SnS-AC (Table 2).29–32
 
image file: c6ra13286c-t4.tif(6)
 
image file: c6ra13286c-t5.tif(7)
where qe and qt represent the adsorption capacities (mg g−1) of SnS-AC at equilibrium and at a particular time t (min), respectively. k1 and k2 are the first-order and second-order kinetic rate constants.
Table 2 Obtained kinetic model parameters for the adsorption of dyes onto SnS-AC (C0 = 12 mg L−1, adsorbent mass = 0.025 g, pH = 6.0, sonication time = 0.5–7.0 min and T = 25 °C)
Model Parameters 0.025 g adsorbent
Single component Multi-component
MB SO MB SO
Pseudo first kinetic K1 0.37 0.74 1.26 0.84
qe(calc) 4.31 1.06 41.5 13.7
R2 0.724 0.619 0.959 0.950
Pseudo second kinetic K2 0.22 0.36 0.072 0.27
qe(calc) 24.3 23.9 25.4 23.5
R2 0.999 0.999 0.999 0.999
Intraparticle diffusion Kdif (mg g−1 min−1/2) 2.37 2.87 5.28 3.26
C (mg g−1) 17.9 16.6 10.3 15.0
R2 0.868 0.794 0.867 0.831
Elovich β (g mg−1) 0.521 0.422 0.235 0.375
α (mg g−1 min−1) 65.6 70.4 85.2 71.1
R2 0.968 0.925 0.962 0.948
Experimental data qe(exp) (mg g−1) 23.8 23.6 23.5 23.1


The R2 of the first and second order kinetic models were compared to check the suitable model for dye adsorption onto SnS-AC. The deviation of equilibrium adsorption capacity (qe) obtained from the models and the experimental values was also calculated.

 
image file: c6ra13286c-t6.tif(8)
α is the initial adsorption rate and β is related to the extent of surface coverage and the activation energy for chemisorptions.
 
qt = Kdift1/2 + C (9)
where Kdif is the intraparticle diffusion rate constant, and C is a constant about the thickness of the boundary layer. According to the model, if the regression of qt vs. t1/2 is linear and passes through the origin, then intraparticle diffusion is the sole rate-limiting step and the adsorption process is controlled by intraparticle diffusion.

Based on the correlation coefficients, the adsorption of SO and MB is best described by the pseudo-second order equation (Table 2).

As shown in Table 2, the k2 values calculated for single system are comparatively higher than those for binary system, suggesting a lower affinity for adsorbent exchange sites. The R2 value (Table 2) for this model was far from the unity, which shows that the intraparticle diffusion model is not applicable.

3.7. Equilibrium isotherms for dye adsorption

The experimental data were fitted to the Langmuir and Freundlich models. In the Langmuir sorption model, sorption of sorbate takes places at specific homogeneous sites within the adsorbent and valid for monolayer sorption onto adsorbents.33 The expression of the Langmuir model is given by the following equation:34
 
image file: c6ra13286c-t7.tif(10)
where Ce is the equilibrium dye concentration in the solution (mg L−1), kL is the Langmuir sorption constant (L mg−1), and Qm is the theoretical maximum sorption capacity (mg g−1). The values of the constants of Langmuir model along with the regression coefficient (R2) are presented in Table 3.
Table 3 Parameters of investigated adsorption models for adsorption of dyes from aqueous solution onto SnS-AC (C0 = 5–30 mg L−1, adsorbent mass = 0.025 g, pH = 6.0, sonication time = 3.5 min and T = 25 °C)
Isotherm Parameters Single component Multi-component
MB SO MB SO
Langmuir Qm (mg g−1) 71.0 67.3 53.9 40.3
Ka (L mg−1) 70.3 1.65 3.06 5.97
R2 0.964 0.949 0.985 0.988
Freundlich 1/n 0.473 0.488 0.276 0.198
KF (L mg−1) 10.7 1.46 4.65 4.37
R2 0.998 0.995 0.998 0.998


The Freundlich equation can be described by assuming a heterogeneous surface with adsorption on each class of sites. Freundlich proposed the equation as:35

 
image file: c6ra13286c-t8.tif(11)
where KF is a constant indicative of the relative adsorption capacity of the adsorbent (mg g−1) and the constant, 1/n indicates the intensity of the adsorption.

The validity of the isotherm models was tested by comparing the experimental and calculated data. Based on correlation coefficients (R2) (Table 3), it is noted that the Freundlich equation gives the best fit. The values of 1/n between 0.1 < 1/n < 1.0 represent good adsorption of dyes onto SnS-AC.36 The ultimate adsorption capacity of the adsorbent can be calculated by substituting the required equilibrium concentration in the Freundlich equation.

3.8. Comparison of SnS-AC with other adsorbents

The monolayer adsorption capacity (Qmax) and contact time of various other adsorbents reported in literature are shown in Table 4. It is obvious that the SnS-AC synthesized in this work exhibits a much higher Qmax and lower contact time, which suggests that the as-synthesized nanoparticles can be considered as a promising adsorbent for the removal of MB and SO dyes from wastewater.
Table 4 Comparison of maximum equilibrium sorption capacity of dyes on different adsorbents
Adsorbent Dye Adsorption capacity (Qmax (mg g−1)) Contact time (min) Ref.
MWCNTs filled with Fe2O3 particles MB 42.9 60 37
Ag nanoparticles loaded on activated carbon MB 71.4 15 38
NiS nanoparticles loaded on activated carbon MB 52.0 5.5 39
CuO nanoparticles loaded on activated carbon MB 10.5 15 40
Graphene nanosheet/magnetite (Fe3O4) composite MB 43.8 20 9
MgO decked multi layered graphene SO 137.6 120 41
Mesoporous MCM-41 SO 68.8 120 42
NiS-nanoparticles loaded on activated carbon SO 53.2 5.5 39
Activated carbon SO 19.0 3.0 43
ZnO-nanorods loaded on activated carbon SO 55.2 3.0 43
Activated carbon MB 33.6   This work
SO 29.7 3.5
SnS-AC MB 71.0
SO 67.2  


4. Conclusions

This study shows RSM and central composite design were successfully employed for experimental design. Satisfactory empirical models were obtained to correlate MB and SO removal percentages to their initial concentration, adsorbent mass and ultrasound time. The process optimization for maximum adsorption of the dyes identified the process conditions (pH 8.0, 0.025 g SnS-AC, and 12 mg L−1 of each dye). Moreover, the kinetic studies showed the best fit with pseudo-second order rate equation. Besides, the adsorption equilibrium showed the best fitting with the Freundlich isotherm equation.

Acknowledgements

The authors thank the Research Council of Shahrekord University and the University of Yasouj, Iran for all supports provided.

References

  1. D. P. Dutta, A. Singh, A. Ballal and A. K. Tyagi, Eur. J. Inorg. Chem., 2014, 2014, 5724–5732 CrossRef CAS.
  2. M. D. Pavlović, A. V. Buntić, K. R. Mihajlovski, S. S. Šiler-Marinković, D. G. Antonović, Ž. Radovanović and S. I. Dimitrijević-Branković, J. Taiwan Inst. Chem. Eng., 2014, 45, 1691–1699 CrossRef.
  3. G. Z. Kyzas, M. Kostoglou, A. A. Vassiliou and N. K. Lazaridis, Chem. Eng. J., 2011, 168, 577–585 CrossRef CAS.
  4. K. O. Adebowale, B. I. Olu-Owolabi and E. C. Chigbundu, J. Encapsulation Adsorpt. Sci., 2014, 4, 89–95 CrossRef.
  5. M. Ghaedi, S. Khodadoust, H. Sadeghi, M. A. Khodadoust, R. Armand and A. Fatehi, Spectrochim. Acta, Part A, 2015, 136, 1069–1075 CrossRef CAS PubMed.
  6. M. K. Sahu, U. K. Sahu and R. K. Patel, RSC Adv., 2015, 5, 42294–42304 RSC.
  7. J. Qi, X. Li, H. Zheng, P. Li and H. Wang, J. Hazard. Mater., 2015, 293, 105–111 CrossRef CAS PubMed.
  8. M. Ghaedi, H. Mazaheri, S. Khodadoust, S. Hajati and M. K. Purkait, Spectrochim. Acta, Part A, 2015, 135, 479–490 CrossRef CAS PubMed.
  9. L. Ai, C. Zhang and Z. Chen, J. Hazard. Mater., 2011, 192, 1515–1524 CrossRef CAS PubMed.
  10. A. Asfaram, M. Ghaedi, M. H. A. Azqhandi, A. Goudarzi and M. Dastkhoon, RSC Adv., 2016, 6, 40502–40516 RSC.
  11. A. Asfaram, M. Ghaedi, S. Hajati and A. Goudarzi, Ultrason. Sonochem., 2016, 32, 418–431 CrossRef CAS PubMed.
  12. A. Asfaram, M. Ghaedi, F. Yousefi and M. Dastkhoon, Ultrason. Sonochem., 2016, 33, 77–89 CrossRef CAS PubMed.
  13. M. Ghaedi, Z. Rozkhoosh, A. Asfaram, B. Mirtamizdoust, Z. Mahmoudi and A. A. Bazrafshan, Spectrochim. Acta, Part A, 2015, 138, 176–186 CrossRef CAS PubMed.
  14. A. R. Bagheri, M. Ghaedi, S. Hajati, A. M. Ghaedi, A. Goudarzi and A. Asfaram, RSC Adv., 2015, 5, 59335–59343 RSC.
  15. A. Asfaram, M. Ghaedi, S. Hajati, A. Goudarzi and A. A. Bazrafshan, Spectrochim. Acta, Part A, 2015, 145, 203–212 CrossRef CAS PubMed.
  16. S. Katebi, A. Esmaeili and K. Ghaedi, J. Magn. Magn. Mater., 2016, 402, 184–189 CrossRef CAS.
  17. I. H. Chowdhury, A. H. Chowdhury, P. Bose, S. Mandal and M. K. Naskar, RSC Adv., 2016, 6, 6038–6047 RSC.
  18. A. Tadjarodi, M. Imani and M. Salehi, RSC Adv., 2015, 5, 56145–56156 RSC.
  19. M. Ghaedi, H. Z. Khafri, A. Asfaram and A. Goudarzi, Spectrochim. Acta, Part A, 2016, 152, 233–240 CrossRef CAS PubMed.
  20. M. Dastkhoon, M. Ghaedi, A. Asfaram, A. Goudarzi, S. M. Langroodi, I. Tyagi, S. Agarwal and V. K. Gupta, Sep. Purif. Technol., 2015, 156, 780–788 CrossRef CAS.
  21. A. Asfaram, M. Ghaedi, S. Agarwal, I. Tyagi and V. Kumar Gupta, RSC Adv., 2015, 5, 18438–18450 RSC.
  22. A. Asfaram, M. Ghaedi, S. Hajati and A. Goudarzi, RSC Adv., 2015, 5, 72300–72320 RSC.
  23. R. Mariappan, T. Mahalingam and V. Ponnuswamy, Optik, 2011, 122, 2216–2219 CrossRef CAS.
  24. L. Khel, S. Khan and M. Zaman, J. Chem. Soc. Pak., 2005, 27, 24–28 CAS.
  25. A. Asfaram, M. Ghaedi, A. Goudarzi and M. Rajabi, Dalton Trans., 2015, 44, 14707–14723 RSC.
  26. M. Jamshidi, M. Ghaedi, K. Dashtian, A. M. Ghaedi, S. Hajati, A. Goudarzi and E. Alipanahpour, Spectrochim. Acta, Part A, 2016, 153, 257–267 CrossRef CAS PubMed.
  27. E. A. Dil, M. Ghaedi, A. Ghaedi, A. Asfaram, M. Jamshidi and M. K. Purkait, J. Taiwan Inst. Chem. Eng., 2016, 59, 210–220 CrossRef CAS.
  28. A. Asfaram, M. Ghaedi, S. Hajati, M. Rezaeinejad, A. Goudarzi and M. K. Purkait, J. Taiwan Inst. Chem. Eng., 2015, 53, 80–91 CrossRef CAS.
  29. C. K. Lim, H. H. Bay, C. H. Neoh, A. Aris, Z. Abdul Majid and Z. Ibrahim, Environ. Sci. Pollut. Res. Int., 2013, 20, 7243–7255 CrossRef CAS PubMed.
  30. B. Royer, N. F. Cardoso, E. C. Lima, J. C. Vaghetti, N. M. Simon, T. Calvete and R. C. Veses, J. Hazard. Mater., 2009, 164, 1213–1222 CrossRef CAS PubMed.
  31. W. J. Weber and J. C. Morris, J. Sanit. Eng. Div., Am. Soc. Civ. Eng., 1963, 89, 53–61 Search PubMed.
  32. S. Senthilkumaar, P. R. Varadarajan, K. Porkodi and C. V. Subbhuraam, J. Colloid Interface Sci., 2005, 284, 78–82 CrossRef CAS PubMed.
  33. M. Ghaedi and S. N. Kokhdan, Spectrochim. Acta, Part A, 2015, 136, 141–148 CrossRef CAS PubMed.
  34. M. Ghaedi, M. Pakniat, Z. Mahmoudi, S. Hajati, R. Sahraei and A. Daneshfar, Spectrochim. Acta, Part A, 2014, 123, 402–409 CrossRef CAS PubMed.
  35. P. Das, P. Banerjee and S. Mondal, Environ. Sci. Pollut. Res. Int., 2015, 22, 1318–1328 CrossRef CAS PubMed.
  36. F. N. Azad, M. Ghaedi, A. Asfaram, A. Jamshidi, G. Hassani, A. Goudarzi, M. H. A. Azqhandi and A. Ghaedi, RSC Adv., 2016, 6, 19768–19779 RSC.
  37. S. Qu, F. Huang, S. Yu, G. Chen and J. Kong, J. Hazard. Mater., 2008, 160, 643–647 CrossRef CAS PubMed.
  38. M. Ghaedi, S. Heidarpour, S. Nasiri Kokhdan, R. Sahraie, A. Daneshfar and B. Brazesh, Powder Technol., 2012, 228, 18–25 CrossRef CAS.
  39. M. Ghaedi, M. Pakniat, Z. Mahmoudi, S. Hajati, R. Sahraei and A. Daneshfar, Spectrochim. Acta, Part A, 2014, 123, 402–409 CrossRef CAS PubMed.
  40. M. Ghaedi, A. Ghaedi, M. Hossainpour, A. Ansari, M. Habibi and A. Asghari, J. Ind. Eng. Chem., 2014, 20, 1641–1649 CrossRef CAS.
  41. N. K. Rotte, S. Yerramala, J. Boniface and V. V. Srikanth, Chem. Eng. J., 2014, 258, 412–419 CrossRef CAS.
  42. S. Kaur, S. Rani, R. Mahajan, M. Asif and V. K. Gupta, J. Ind. Eng. Chem., 2015, 22, 19–27 CrossRef CAS.
  43. F. Nasiri Azad, M. Ghaedi, K. Dashtian, S. Hajati, A. Goudarzi and M. Jamshidi, New J. Chem., 2015, 39, 7998–8005 RSC.

Footnote

Electronic supplementary information (ESI) available. See DOI: 10.1039/c6ra13286c

This journal is © The Royal Society of Chemistry 2016