DOI:
10.1039/C6RA13163H
(Paper)
RSC Adv., 2016,
6, 66048-66055
Deep insights into the growth pattern of palladium nanocubes with controllable sizes†
Received
20th May 2016
, Accepted 23rd June 2016
First published on 27th June 2016
Abstract
Although shape and size controllable palladium nanocrystals have attracted enormous attention, the growth behavior of Pd nanocubes is not thoroughly understood. In this work, the growth pattern of size controllable Pd nanocubes is studied systematically under a variety of reaction conditions. During the growth process of the Pd nanocubes, various structures including concave cubes, triangular bipyramids, pentagonal bipyramids (decahedrons) and pentagonal rods can be generated due to the disparate behavior of the fresh Pd atoms. Different-sized nanocubes are prepared controllably by changing the dosage of KBr, which provides capping capacities toward the {100} facets that the cubes are enclosed with. Both ascorbic acid (AA) and KBr influence the reducing rate of the Pd precursors and the growth kinetics of the nanocrystals, and furthermore control the morphologies of the products. This detailed research supplements the understanding of crystal growth, and provides insight toward the comprehension of atom movements at the nanoscale.
Introduction
Shape and size controllable palladium nanocrystals (NCs) have shown great advantages in catalysis due to their specific facets,1–5 and consequently have been widely investigated.6–11 Nanoscale palladium can appear with morphologies such as cubes, octahedra, decahedra, icosahedra, rhombic dodecahedra, as well as pentagonal rods and nanoplates.12–21 Meanwhile, Pd nanocubes enclosed with {100} facets play a fundamental role in the formation of Pd-based core–shell architectures.22–25 Although there have been some reports describing the growth behavior of Pd nanocrystals,6,26–29 few concern the detailed growth pattern of Pd nanocubes.
Generally, the formation process of metal nanocrystals can be described with LaMer's model,26,30 which divides the whole process into three main periods, namely generation of atoms, self-nucleation and growth. It is not easy to observe the generation of atoms and self-nucleation period due to their extremely fast reaction rates,26 while the growth period, a relatively slow process, can provide great quantities of information. For example, facet development during the evolvement of platinum nanocubes has been discussed with density functional theory (DFT) calculations and in situ transmission electron microscopy (TEM) observations,31 while the oxidative etching phenomenon occurring throughout the formation of Pd cubes has been studied by decomposing the cubes with Br− and H2O.32
Pd nanocubes can be prepared by two main approaches, namely a seed-mediated33 or one-pot12,13 synthesis method. There has been some research on the preparation of Pd nanocubes with bromide species.4,17 However, the relationships between the dosage of KBr, a capping agent towards the Pd {100} facet, and the size of the Pd nanocubes are not presented in detail. Deep insights into the growth pattern of size controllable Pd nanocubes with KBr are demanded. In this work, we focus on the detailed results obtained during the preparation of size-controllable palladium nanocubes. In combination with DFT calculations, deep insight is used to clarify the growth mechanism, in which Pd nanocubes are synthesized in an aqueous system under different conditions of reaction time, and dosages of reducing and capping agents.
Experimental section
Materials
Potassium tetrachloropalladate (K2PdCl4, 99.95% metals basis), potassium tetrabromopalladate (K2PdBr4, Pd ≥20.5%), ascorbic acid (AA, 99.99% metals basis), potassium bromide (KBr, 99.95% metals basis), polyvinylpyrrolidone (PVP, MW = 58![[thin space (1/6-em)]](https://www.rsc.org/images/entities/char_2009.gif) 000) potassium chloride (KCl, GR, 99.8%) and potassium iodide (KI, ultra-pure, ≥99.5%) were purchased from Aladdin Industrial Co., Shanghai, China. Acetone was obtained from Sinopharm Chemical Reagent Co., Ltd., China. All of these reagents were employed without further purification. Ultrapure water with a resistivity above 1.82 × 10⁵ Ω m at 25 °C was produced from a Millipore Q3 system.
000) potassium chloride (KCl, GR, 99.8%) and potassium iodide (KI, ultra-pure, ≥99.5%) were purchased from Aladdin Industrial Co., Shanghai, China. Acetone was obtained from Sinopharm Chemical Reagent Co., Ltd., China. All of these reagents were employed without further purification. Ultrapure water with a resistivity above 1.82 × 10⁵ Ω m at 25 °C was produced from a Millipore Q3 system.
Preparation of Pd nanocrystals
Herein, PVP, AA, and KBr were applied as a stabilizer, reducing agent and capping agent, respectively. In a typical synthesis procedure, 278 mg of PVP and 163 mg of K2PdCl4 together with 1.5 g of KBr were dissolved in 15 mL of H2O, and pre-heated in a 100 mL flask at 85 °C for 5 minutes before adding 5 mL of aqueous solution containing 150 mg of AA. Under this circumstance, the concentrations for PVP (calculated by the monomer), K2PdCl4, KBr, and AA are 125, 25, 630, and 42.6 mmol L−1, respectively. Afterwards, the reaction solution was kept stirred for 3 h, and then cooled down to room temperature. The products were collected by diluting the resultant solution with acetone and centrifuging (5000 rpm, 10 min). The black precipitation was washed 5 times with water and acetone to remove excess PVP. Finally, the products were stored in a glass vessel with 10 mL of H2O.
Characterization of Pd nanocubes
All of the samples were analyzed with TEM. During the sampling procedure, 200 μL of particle aqueous suspension was mixed with 1 mL of ethanol to form a mixture with good volatility. A drop of the mixture was placed onto a copper grid coated with an ultra-thin carbon film under atmosphere. Then the grid was dried under vacuum at 50 °C overnight. All of the TEM images were obtained using an HT7700 (Hitachi, Japan) microscope with an acceleration voltage of 100 kV, and the high resolution TEM (HRTEM) images were obtained using a JEM 2100F (JOEL, Japan) microscope at 200 kV.
Results and discussion
Shape identification
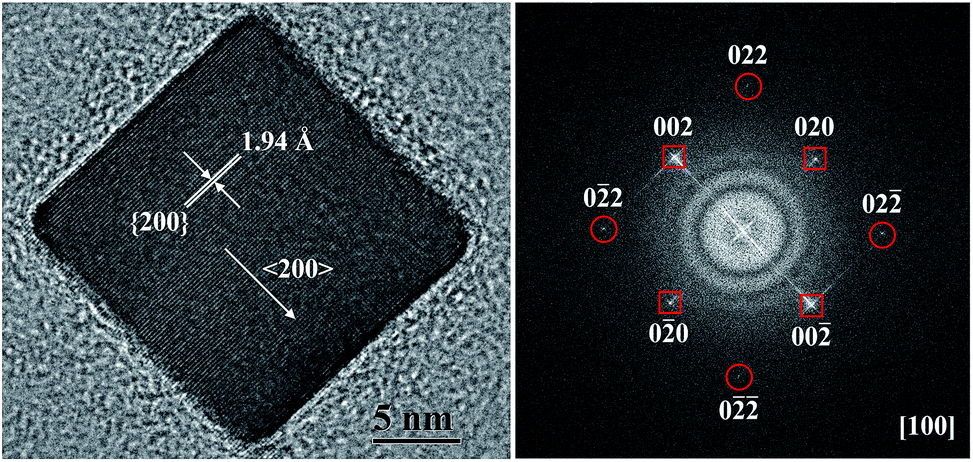
Generally, two types of crystals can be generated, namely single and twinned crystals. To distinguish them, HRTEM analysis was employed and the results are exhibited in Fig. 1 and S1 of the ESI.† Five different-shaped crystals, cube (concave cube included), decahedron, triangular bipyramid, pentagonal rod and icosahedron, can be observed.
 |
| | Fig. 1 HRTEM image of one Pd nanocube enclosed by {100} facets and the corresponding fast Fourier transform (FFT) pattern. | |
Generation process
The growth behavior of the Pd nanocubes against reaction time was studied using the typical synthesis procedure. The moment the AA solution was added into the reaction system, a timer was started. At each reaction stage, 1 mL of reaction liquid was pipetted out and diluted with acetone to stop the growth process at different reaction stages. We obtained reaction samples at 1, 2, 5, 10, 15, 20, 30, 45, 60, 90, 120 and 150 min and the results are presented in Fig. 2. According to the TEM images of these particles, the nucleation process could be seen within the beginning 5 min, and the crystals began to grow from then on. As shown in Fig. 2(c–l), small spherical particles generated during the early growth stages gradually evolved into cubes with the deposition of fresh Pd atoms onto the particle surface, and consequently the crystal size increased. Particularly, as is demonstrated in Scheme 1, the generated seeds would grow into primary cubes (or slightly truncated cubes) with three different kinds of exposed facets, namely {100} (capped with Br−), {110} and {111} (atoms in green represent the {100} facets, while pink the {110} and yellow the {111} facets). Afterwards, fresh Pd atoms tended to deposit onto the {111} facets (or corners) where the surface energy was low26 and atomic density was high, and progressively the atoms spread all over the cube surfaces. Accordingly, we could name the nanocubes as anisotropic growth products. After reacting for 90 min, the size of the cubes was stabilized at around 18 nm, indicating the accomplishment of crystal growth. Thus, the growth course was basically completed within 90 min under typical synthesis conditions, and was kept for another 1.5 h to carry out the progress entirely. Additionally, we performed the reaction for 10 h, but no apparent changes occurred (Fig. S2†).
 |
| | Fig. 2 TEM images of the Pd NCs obtained at different reaction stages, from (a) to (l): 1, 2, 5, 10, 15, 20, 30, 45, 60, 90, 120 and 150 min, respectively (twinned crystals at early growth stages being pointed out with arrows). Scale bar: (a–d) 50 nm, (e–l) 100 nm. | |
 |
| | Scheme 1 Schematic illustration of the atom movements during the growth process. | |
Dosage of KBr
Within the shape-controlled growth process of metal nanomaterials, capping agents, such as PVP,34 citrate ions,18 metal ions33 and halide ions,13 are usually required to manipulate the movements of fresh atoms. As a capping agent, KBr acts as a soft template leading the Pd atoms to arrange orderly along the {100} direction during the epitaxial growth of the Pd nanocubes.35 Hence, the influence on the Pd appearance of different amounts of KBr was studied. We conducted the experiments with 0, 188, 375, 750 and 1500 mg of KBr (the corresponding concentrations of KBr are 0, 78.8, 158, 315 and 630 mmol L−1), and the other conditions were kept the same as those in the typical synthesis procedure conditions. It could be clearly observed that the crystal size increased as the portion of KBr increased, and in the meantime, the particles gradually evolved into cubes (Fig. 3). While KBr was replaced by KI or KCl with the same concentration under the typical synthesis procedure, the cubes were no longer the major product (Fig. S3†). Hence, we can confirm that KBr contributes greatly to the formation of the nanocubes.
 |
| | Fig. 3 (a–e) TEM images of the Pd NCs obtained with different dosages of KBr under the typical synthesis procedure conditions, the concentrations of KBr from (a) to (e): 0, 78.8, 158, 315, and 630 mmol L−1, respectively. Scale bar: 100 nm. (f) Percentage of cubes with other shapes and energy-dispersive X-ray spectroscopy (EDS) analysis of samples in (e). Signals of C and Cu are caused by the copper grid. | |
We measured the detailed data of those crystals in Fig. 3, including the average crystal width/length and size, and calculated the average aspect ratio (avg. L/W) (Fig. S4†). Relating the average crystal width to the KBr dosage, we found a linear correlation (Fig. 4). Indeed, [PdBr4]2− is more stable than [PdCl4]2−,36,37 and thus tetrachloropalladate ions in water in the presence of Br− will change into the form of [PdCl4−n−mBrn(H2O)m]m−2 (eqn (1)). Afterwards, the hydrous precursor is gradually reduced into atoms by AA (eqn (2)).
| | |
[PdCl4]2− + nBr− + mH2O ⇌ [PdCl4−n−mBrn(H2O)m]m−2 + (n + m)Cl−
| (1) |
| | |
[PdCl4−n−mBrn(H2O)m]m−2 + AA → Pd0
| (2) |
 |
| | Fig. 4 The relationship between the size of the nanocrystals and concentration of KBr, error bars showing the size distribution of the as-synthesized NCs (■, size of the nanocrystals, NC size; ○, average aspect ratio, avg. L/W). | |
Furthermore, different aqueous solutions with K2PdCl4 and KBr in contrast to those with K2PdBr4 were prepared and analyzed by UV-Vis (UV-2450, Shimadzu, Japan). As is shown in Fig. 5a, the violet dashed line is the signal of pure K2PdBr4 solution and the solid lines represent the data of the solutions consisting of the Pd precursor and different amounts of KBr. Obviously, Br− coordinates to tetrapalladate. Characteristic absorption peaks of [PdBr4]2− at 225 and 268 nm appear after the introduction of KBr and are enhanced as the KBr dosage increases (Fig. 5b). The absorbance value is relevant to the interaction strength between the Pd ion and ligand, which represents the stability of the coordination compounds and the resistance ability toward the reductant. A higher concentration of Br− in the reaction system causes a greater absorbance value, and leads to a relatively slower reducing rate and larger crystals.
 |
| | Fig. 5 (a) The UV-Vis spectra of aqueous solutions with 0.25 mmol L−1 K2PdCl4 and 0, 0.788, 1.58, 3.15, or 6.30 mmol L−1 KBr (solid lines) or 0.25 mmol L−1 K2PdBr4 (dashed line). Inset: magnified spectra in the red square. (b) The relationship between the UV-Vis absorbance values at the characteristic absorption peaks and the KBr dosage. | |
However, when the concentration of Br− in the aqueous system was too low, it was still not easy to obtain well-defined cubes because of the insufficient capping capacity. In the absence of KBr, it was not easy to gain well-defined cubes (Fig. S3c†) when the same concentration of K2PdBr4, instead of K2PdCl4, was adopted under the typical synthesis procedure conditions. More Br− was essential to smooth the surface and build up the clear structure. Under this circumstance, structures containing both {111} and {100} facets would be generated, for example, spheres and truncated cubes. On the other hand, a high concentration of Br− would lead to the formation of twinned structures, such as decahedra and pentagonal rods. While the concentration of KBr was 630 mmol L−1, some twinned structures appeared. At this point, the shape selection of the cubes was over 95% (Fig. 3e). Afterwards, we attempted to increase the dosage of KBr up to 3 g, but the resulting nanocrystals consisted of half cubes with an average width of 17.6 nm and half twinned crystals (Fig. S5†). The slightly attenuated cubic size might be owing to the strong coordinating ability of KBr towards the Pd ions, which greatly slowed down the generation rate of fresh Pd atoms. Thus it influenced the self-nucleation period, leading to the formation of many twinned crystal seeds with {111} facets. During the growth period, fresh Pd atoms tended to deposit onto the {111} facets where the electron density was higher (Scheme S1†). Consequently, single crystal seeds could not obtain enough atoms to form cubes as large as 18 nm. It could be concluded that within the KBr dosage range from 0 to 630 mmol L−1, we could simply control the addition amount of KBr to manipulate the cubic dimensions.
Dosage of AA
The reducing ability of a reaction system is the key to controlling the growth pathway of crystals, influencing reaction kinetics, and furthermore determining product morphologies. As a reductant, AA possesses an extraordinary reducing power that can easily reduce some platinum group metal ions into bulk. The reduction ability of AA toward the Pd precursor (taking the [PdCl4]2− form for instance) can be approximately calculated through an electrochemical series. Under the typical synthesis procedure conditions, the reduction potential of AA can be given as 0.306 V (eqn (3)),38 while the conditional reduction potential for [PdCl4]2−/Pd is 0.534 V (eqn (4)),| | |
[AAO]− + 2H+ + 2e ⇌ [AAR]− E′AA = 0.306 V
| (3) |
| | |
PdCl42− + 2e ⇌ Pd + 4Cl− E′Pd = 0.534 V
| (4) |
where [AAO]− means AA in the oxidative form, and [AAR]− stands for its reductive form (detailed calculation in ESI†). According to eqn (S1),† while increasing the initial concentration of AA, E′AA will be enhanced, indicating a boost of the reducing ability. The whole reaction process can be simplified as follows.| | |
[PdCl4]2− + [AAR]− ⇌ Pd + 4Cl− + [AAO]− + 2H+ E′ = 0.228 V
| (5) |
Apparently, this reaction is quite complex and its reaction rate is kinetically positively related to the dosage of AA.
Hence, we performed the typical synthesis procedure with different concentrations of AA: 21.3, 42.6, 85.2, 170 and 341 mol L−1. As is clearly displayed in Fig. 6, the crystals are enlarged when the AA dosage is increased, but change into slightly irregular hexahedra with some defects or dislocations (Fig. 6e). According to the change tendency between the NC size and AA dosage (Fig. 6f), there is a critical point where the crystals will not further expand even though the concentration of AA in the reaction system increased. Before reaching the critical point, an adequate Br− amount supplies enough capping capacity for the dimensional growth of the cubes, where the determination factor of the cubic size is the dosage of AA. While the reducing ability in the reaction system is superfluous, great quantities of Pd atoms can be generated within a short time, leading to the formation of slightly irregular cubes with a large size distribution. These crystals possess acute corners and curving surfaces, which are commonly called concave cubes.39 Excess KBr should even decrease the cubic dimension, which, together with the influence of AA, strongly proves that the size limitation of the nanocubes prepared under the typical synthesis procedure conditions is approximately 20 nm.
 |
| | Fig. 6 (a–e) TEM images of the Pd NCs achieved sequentially with 21.3, 42.6, 85.2, 170 and 341 mol L−1 AA, respectively, under the typical synthesis procedure conditions. Some typical concave cubes in sample (e) are pointed out with arrows. Scale bar: 100 nm. (f) The relationship between NC size and AA dosage. | |
Growth behavior
As was stated, KBr has an outstanding capping ability toward the {100} facet. According to primary DFT calculations (details in the ESI†), the electron density maps of three basic Pd facets exhibit three different types of electron-deficient regions (Scheme S1†). Typically, the {100} facets possess octahedral cavities where the electron density is low. Br− tends to adsorb onto the octahedral cavities (Scheme S2†) because of the attractive force of the holes. Coincidentally, the size of Br− is 196 pm,40 which is close to the distance of the Pd (200) faces (about 195 pm). Thus, we can draw a diagram describing the adsorption behavior of Br− on the Pd {100} facets (Scheme 2). Hence, the adsorption amount of Br− on the Pd nanocubes that every octahedral cavity is ideally capped with can be calculated with eqn (6) (details in the ESI†),| |
 | (6) |
where χ is the mole fraction of Br− in the Pd cube, a is the lattice constant of Pd and n is the edge length of the nanocube. Obviously, smaller cubes require more Br− to form the {100} facets. Indeed, the demand of Br− to build the cubes is far more than that just to cap the surfaces. Most Br− ions are engaged in the process of slowing down the reduction rate of the Pd precursors (eqn (1) and (2)). Based on all of the evidence above, we can conclude the possible growth pattern of the Pd nanocubes (Scheme 3). After the periods of generation of atoms and self-nucleation, the primary cubes are generated and capped with Br− on the {100} facets. Sequentially, fresh Pd atoms adsorb onto the surface of the Br− layer and gradually transpose onto the Pd bulk. Eventually, the cubes grow into well-defined crystals.
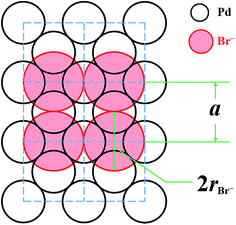 |
| | Scheme 2 Schematic diagram of bromide ions covering the Pd {100} facet. The dashed line means the unit cell of Pd. | |
 |
| | Scheme 3 Possible growth pathway of the fresh Pd atoms onto the Br-capped Pd {100} facet. | |
To thoroughly study the evolution process during the formation of nanocubes, a series of comparative experiments was performed. Representatively, 0.125 mmol of K2PdCl4, 0.625 mmol of PVP and a certain amount of KBr were added into a reaction vessel, dissolved with water (<5 mL) and preheated at 85 °C. Afterwards, a portion of AA solution was pipetted into the reaction system. Finally, a 5 mL aqueous reaction system was formed and heated for 3 h. The concentrations for K2PdCl4 and PVP were the same as those in the typical synthesis procedure. The concentrations of KBr and AA are listed in Table S1,† and the relevant TEM images are presented in Fig. S6.† With the increase of the amount of KBr in the reaction system, the morphologies of the nanostructures are progressively regulated. However, when the KBr dosage increases over a certain amount, great quantities of twinned crystals turn up and the cubes gradually disappear. With the participation of KBr, when the AA concentration in the reaction system escalates, the cubes will be enlarged before the twinned crystals come out.
The phenomena above can be explained by the deposition and diffusion behavior of the newly formed Pd atoms.41 Typically in our reaction system, the deposition rate is mainly influenced by the generation rate of the fresh Pd atoms, and the diffusion rate is mainly controlled by the transposition ability of the fresh Pd atoms which is thermo-dependent. AA as well as KBr possesses abilities to determine the growth results. Thermodynamically, structures enclosed with the {100} facets are not thermostable enough, and the cubes will evolve into crystals surrounded by {111} facets under high temperature conditions.12 During the synthesis procedure, when the dosage of AA is low, namely the diffusion rate of the Pd atoms over the seed surface is overwhelming the deposition rate, the insufficient amount of fresh Pd atoms restricts the crystals to relatively small sizes with truncated corners. While the concentration of AA in the reaction system is enhanced to the point where the atomic diffusion rate is substantially equal to the deposition rate, the generation rate of the Pd atoms analogously increases, inducing the formation of complete cubes. However, an overdose of AA should accelerate the generation speed of the Pd atoms excessively, in other words, the diffusion rate is too slow to smooth the crystal surfaces, causing defects or dislocations, and leading to the appearance of concave cubes and eventually twinned structures including decahedra and icosahedra. On the other hand, Br− coordinates with Pd2+ forming hydrous compounds, indirectly influencing the reducing rate. When more Br− participates in the reaction, the reduction rate of the Pd precursor is slower. However, an overdose of Br− limits the growth of the cubes and encourages the formation of the {111} facets due to the extremely slow generation rate of the fresh Pd atoms. Consequently, a large quantity of Br− protects the twinned structures and promotes the growth of pentagonal rods by capping the side facets. Hence, the appearance of twinned structures is mainly owing to the overdose of AA and KBr.
Eventually, we summarize the growth pattern of the Pd nanocubes in Scheme 4. After converting the Pd precursor into seeds, PVP stabilized nanostructures transform into cubes, concave cubes, triangular bipyramids, decahedra, pentagonal rods and other twinned crystals enclosed with {111} facets.
 |
| | Scheme 4 Schematic illustration of the growth of the Pd nanocubes with probable resultant morphologies. | |
Conclusion
Size-controllable nanocubes have been prepared with a typical synthesis procedure, where K2PdCl4, PVP, AA, and KBr act as a precursor, stabilizer, reductant and capping agent, respectively. We have obtained nanocubes sized from 6 to 18 nm facilely by adjusting the dosage of KBr. This work gives a deep insight into the growth period of the Pd nanocubes. Whether for AA or KBr, the influence toward cubic sizes and morphologies is indeed contributed through manipulating the formation rate of the fresh Pd atoms. The detailed growth pathway of the Pd nanocubes can help to understand the nature of shape selection under different situations. It also provides a promising way toward the generation of twinned crystals, including triangular bipyramids, decahedra and pentagonal rods.
Conflict of interest
The authors declare no competing financial interest.
Acknowledgements
This work was supported by the National Natural Science Foundation of China (No. 21273201, J1210042).
References
- Q. Zhang, J. Xu, D. Yan, S. Li, J. Lu, X. Cao and B. Wang, Catal. Sci. Technol., 2013, 3, 2016–2024 CAS.
- Y. Han, Z. He, S. Wang, W. Li and J. Zhang, Catal. Sci. Technol., 2015, 5, 2630–2639 CAS.
- X. Zhang, H. Yin, J. Wang, L. Chang, Y. Gao, W. Liu and Z. Tang, Nanoscale, 2013, 5, 8392–8397 RSC.
- S. Sreedhala, V. Sudheeshkumar and C. Vinod, Nanoscale, 2014, 6, 7496–7502 RSC.
- M. Crespo-Quesada, A. Yarulin, M. Jin, Y. Xia and L. Kiwi-Minsker, J. Am. Chem. Soc., 2011, 133, 12787–12794 CrossRef CAS PubMed.
- G. Berhault, M. Bausach, L. Bisson, L. Becerra, C. Thomazeau and D. Uzio, J. Phys. Chem. C, 2007, 111, 5915–5925 CAS.
- L. Polavarapu, S. Mourdikoudis, I. Pastoriza-Santos and J. Perez-Juste, CrystEngComm, 2015, 17, 3727–3762 RSC.
- M. Moreno, F. J. Ibanez, J. B. Jasinski and F. P. Zamborini, J. Am. Chem. Soc., 2011, 133, 4389–4397 CrossRef CAS PubMed.
- C. F. Barnard, Organometallics, 2008, 27, 5402–5422 CrossRef CAS.
- J. E. Choe, M. S. Ahmed and S. Jeon, J. Power Sources, 2015, 281, 211–218 CrossRef CAS.
- A. A. Ensafi, M. Jafari-Asl, B. Rezaei, M. M. Abarghoui and H. Farrokhpour, J. Power Sources, 2015, 282, 452–461 CrossRef CAS.
- B. Lim, H. Kobayashi, P. H. C. Camargo, L. F. Allard, J. Y. Liu and Y. N. Xia, Nano Res., 2010, 3, 180–188 CrossRef CAS.
- M. Jin, H. Liu, H. Zhang, Z. Xie, J. Liu and Y. Xia, Nano Res., 2011, 4, 83–91 CrossRef CAS.
- X. Xia, S.-I. Choi, J. A. Herron, N. Lu, J. Scaranto, H.-C. Peng, J. Wang, M. Mavrikakis, M. J. Kim and Y. Xia, J. Am. Chem. Soc., 2013, 135, 15706–15709 CrossRef CAS PubMed.
- Y. Xiong, I. Washio, J. Chen, H. Cai, Z.-Y. Li and Y. Xia, Langmuir, 2006, 22, 8563–8570 CrossRef CAS PubMed.
- Y.-H. Chen, H.-H. Hung and M. H. Huang, J. Am. Chem. Soc., 2009, 131, 9114–9121 CrossRef CAS PubMed.
- W. Niu, L. Zhang and G. Xu, ACS Nano, 2010, 4, 1987–1996 CrossRef CAS PubMed.
- Y. Xiong, J. M. McLellan, Y. Yin and Y. Xia, Angew. Chem., Int. Ed., 2007, 46, 790–794 CrossRef CAS PubMed.
- M. Liu, Y. Zheng, L. Zhang, L. Guo and Y. Xia, J. Am. Chem. Soc., 2013, 135, 11752–11755 CrossRef CAS PubMed.
- Y. Wang, H.-C. Peng, J. Liu, C. Z. Huang and Y. Xia, Nano Lett., 2015, 15, 1445–1450 CrossRef CAS PubMed.
- B. Lim, Y. Xiong and Y. Xia, Angew. Chem., Int. Ed., 2007, 46, 9279–9282 CrossRef CAS PubMed.
- J. W. Hong, S. W. Kang, B.-S. Choi, D. Kim, S. B. Lee and S. W. Han, ACS Nano, 2012, 6, 2410–2419 CrossRef CAS PubMed.
- H. Zhang, W. Li, M. Jin, J. Zeng, T. Yu, D. Yang and Y. Xia, Nano Lett., 2011, 11, 898–903 CrossRef CAS PubMed.
- C. Zhu, J. Zeng, J. Tao, M. C. Johnson, I. Schmidt-Krey, L. Blubaugh, Y. Zhu, Z. Gu and Y. Xia, J. Am. Chem. Soc., 2012, 134, 15822–15831 CrossRef CAS PubMed.
- B. T. Sneed, C.-H. Kuo, C. N. Brodsky and C.-K. Tsung, J. Am. Chem. Soc., 2012, 134, 18417–18426 CrossRef CAS PubMed.
- Y. Xia, Y. Xiong, B. Lim and S. E. Skrabalak, Angew. Chem., Int. Ed., 2009, 48, 60–103 CrossRef CAS PubMed.
- H. Zhang, M. Jin, Y. Xiong, B. Lim and Y. Xia, Acc. Chem. Res., 2013, 46, 1783–1794 CrossRef CAS PubMed.
- B. Lim, M. Jiang, J. Tao, P. H. C. Camargo, Y. Zhu and Y. Xia, Adv. Funct. Mater., 2009, 19, 189–200 CrossRef CAS.
- Z. Shao, W. Zhu, H. Wang, Q. Yang, S. Yang, X. Liu and G. Wang, J. Phys. Chem. C, 2013, 117, 14289–14294 CAS.
- V. K. Lamer and R. H. Dinegar, J. Am. Chem. Soc., 1950, 72, 4847–4854 CrossRef CAS.
- H.-G. Liao, D. Zherebetskyy, H. Xin, C. Czarnik, P. Ercius, H. Elmlund, M. Pan, L.-W. Wang and H. Zheng, Science, 2014, 345, 916–919 CrossRef CAS PubMed.
- Y. Jiang, G. Zhu, F. Lin, H. Zhang, C. Jin, J. Yuan, D. Yang and Z. Zhang, Nano Lett., 2014, 14, 3761–3765 CrossRef CAS PubMed.
- N. K. Geitner, A. Doepke, M. A. Fickenscher, J. M. Yarrison-Rice, W. R. Heineman, H. E. Jackson and L. M. Smith, Nanotechnology, 2011, 22, 275607 CrossRef CAS PubMed.
- X. Qi, T. Balankura, Y. Zhou and K. A. Fichthorn, Nano Lett., 2015, 15, 7711–7717 CrossRef CAS PubMed.
- H.-C. Peng, S. Xie, J. Park, X. Xia and Y. Xia, J. Am. Chem. Soc., 2013, 135, 3780–3783 CrossRef CAS PubMed.
- L. Elding, Inorg. Chim. Acta, 1972, 6, 683–688 CrossRef CAS.
- L. Elding, Inorg. Chim. Acta, 1972, 6, 647–651 CrossRef CAS.
- H. Borsook and G. Keighley, Proc. Natl. Acad. Sci. U. S. A., 1933, 19, 875–878 CrossRef CAS.
- M. Jin, H. Zhang, Z. Xie and Y. Xia, Angew. Chem., Int. Ed., 2011, 50, 7850–7854 CrossRef CAS PubMed.
- R. Shannon, Acta Crystallogr., Sect. A: Cryst. Phys., Diffr., Theor. Gen. Crystallogr., 1976, 32, 751–767 CrossRef.
- X. Xia, S. Xie, M. Liu, H.-C. Peng, N. Lu, J. Wang, M. J. Kim and Y. Xia, Proc. Natl. Acad. Sci. U. S. A., 2013, 110, 6669–6673 CrossRef CAS PubMed.
Footnote |
| † Electronic supplementary information (ESI) available: Calculation of electrochemical details for a typical synthesis procedure, DFT calculation details, HRTEM images of different shapes, TEM images of Pd nanocubes and relative data. See DOI: 10.1039/c6ra13163h |
|
| This journal is © The Royal Society of Chemistry 2016 |
Click here to see how this site uses Cookies. View our privacy policy here.