 Open Access Article
Creative Commons Attribution 3.0 Unported Licence
Synthesis and microstructural properties of the scaffold based on a 3-(trimethoxysilyl)propyl methacrylate–POSS hybrid towards potential tissue engineering applications†
Ł.
John
*a,
M.
Janeta
a,
M.
Rajczakowska
b,
J.
Ejfler
a,
D.
Łydżba
b and
S.
Szafert
a
aFaculty of Chemistry, University of Wrocław, F. Joliot-Curie 14, 50-383 Wrocław, Poland. E-mail: lukasz.john@chem.uni.wroc.pl
bFaculty of Civil Engineering, Wrocław University of Science and Technology, Wybrzeże Wyspiańskiego 27, 50-370 Wrocław, Poland
First published on 4th July 2016
Abstract
The aim of this work was to develop an efficient approach to prepare a macroporous scaffold for sophisticated bone replacement, avoiding a long-lasting and complex methodology. Such a scaffold based on the 3-(trimethoxysilyl)propyl methacrylate–POSS hybrid was synthesized via the reaction of 3-(trimethoxysilyl)propyl methacrylate and the trifluoromethanesulfonate–POSS salt. The results show that the chemical composition, structural dimensions, topography, and microstructural properties of the scaffold fulfill the potential requirements for hard-tissue engineering. The microstructural properties were evaluated with the use of X-ray microcomputed tomography (micro-CT) and nanoindentation tests. The former makes it possible to estimate the geometrical measures of the microstructure (porosity, thickness distribution, etc.), whereas the latter makes it possible to estimate the mechanical properties of the constituents of the material (hardness, stiffness modulus, creep, etc.). The aforementioned laboratory testing methods are modern techniques, currently being developed for materials science, making it possible to determine the microstructural/measures of the analyzed system.
Introduction
Since 1936, when poly(methyl methacrylate) was developed,1 extensive studies have led to the preparation of its various derivatives, including poly(3-(trimethoxysilyl)propyl methacrylate) (pTMSPMA), poly(2-hydroxyethyl methacrylate) (pHEMA), etc., and to the discovery of many useful commercial applications of these polymers, such as energy storage, high-performance engineering plastics, functional coatings, and biomaterials.2 Such polymers and their composites have a long-established role in medicine as restorative agents in the fabrication of dental composites, contact lenses, drug release systems, artificial skin, bone cements, and other tissue engineering scaffolds.3–9 Besides the many advantages of these type of polymer materials, there are also noticeable usage drawbacks, which inter alia include high viscosity, large polymerization shrinkage, and poor mechanical properties. From this point of view, considerable attention has been directed to materials that will bypass such disadvantages. Here, copolymers based on polyhedral oligomeric silsesquioxanes (POSS) occupy a special position. POSS is a silicon compound whose repeating unit has the formula [RSiO3/2]n (where R = H, Cl, or a wide variety of organic groups; n = 6–18).10 The term polyhedral derives from the precise geometry of the POSS cage, which strongly resembles a polyhedron. The attractiveness of such copolymers strictly derives from their properties, including the potential ability to reduce both the viscosity and the shrinkage of resulting copolymers and also improve their thermal and mechanical properties.1 Moreover, thanks to their nano-sized architecture, such systems offer an opportunity to modify their side chains through the addition of multiple organic groups tethered to their vertices. Furthermore, due to their nanometer size, these particles can be incorporated into polymeric materials with a unique capability to reinforce polymers. POSS can be incorporated into polymer matrices via physical blending or chemical cross-linking. The possibility of chemically grafting POSS to various polymers makes it possible to establish POSS/polymer interactions.11 Finally, they provide a multitude of possibilities for the synthesis of hyperbranched dendrimer systems and not only.Methacrylate–POSS is one of the first examples of hybrid copolymers12,13 that have been synthesized by various methods.14–16 For instance, methyl methacrylate (MMA)/1-propylmethacrylate-polyhedral oligomeric silsesquioxane copolymers synthesized via atom transfer radical polymerization (ATRP) with CuBr as a catalyst have been reported.17 Raus et al. have studied the homopolymerization by ATRP of a commercial mono-substituted methacrylate-functionalized POSS (iBuPOSSMA) monomer to high molecular weights.18 Also Laine et al. have reported on thermally curable and photocurable cage-like silsesquioxane hybrids possessing R side chains not fully substituted by methacrylate units. In that work, the authors postulated that the studied methacrylate-functionalized cubes were highly reactive viscous liquids that could be readily polymerized either photochemically or thermally to produce solid hybrid polymers containing up to 65% silica.19 Poly(methyl methacrylate)/POSS hybrid networks can also be obtained by the photoinitiated polymerization of methyl methacrylate with diethanolamino-functionalized polyhedral oligomeric silsesquioxanes.20 In turn, Matějka et al. have studied the effect of various POSS, possessing numbers of side chains, on thermomechanical properties of epoxy–POSS nanocomposites.21
The above-mentioned polymer–POSS composites constitute representative examples of synthetic strategies that have been developed to create such hybrids.22 In this paper, we continue our studies in the field of functionalized POSS.23–25 The aim of this work was to develop a simple and fast method to prepare an interconnected porous scaffold for potential usage in bone tissue engineering, avoiding time consuming and complex methodologies. The most direct approach to achieve this goal was the reaction between 3-(trimethoxysilyl)propyl methacrylate (TMSPMA) and a trifluoromethanesulfonate–POSS salt ([OAS-POSS-NH3]CF3SO3). The resulting organic–inorganic hybrid can be thermally cured under mild conditions. The obtained hybrid was used to form a three-dimensional macroporous scaffold (pTMSPMA–POSS) that fulfills the chemical and mechanical requirements for potential bone replacement. Broad microstructural analyses of the resulting pTMSPMA–POSS were performed with comparison to the properties of a polymer based on pTMSPMA. We believe that our studies represent notable evidence of the potential utility of the obtained scaffold as a sophisticated substitute in hard-tissue engineering.
Experimental
1. General procedures and chemicals
3-(Trimethoxysilyl)propyl methacrylate (98%, Aldrich), (3-aminopropyl)triethoxysilane (99%, Fluorochem), trifluoromethanesulfonic acid (99.9%, Apollo Scientific), acetic acid (1.0 M, Avantor), white granulated sugar (Diamant, Pfeifer & Langen Marketing, Poland), photoinitiator: 2-hydroxy-2-methylpropiophenone (97%, Aldrich), and (NH4)2CO3 (cz.d.a Avantor) were of reagent-grade quality and were used without further purification. Amberlite IRA-400 ion-exchange resin (40.0 g) was prepared by washing with water (4 × 200 mL), next with 1 M NaOH (3 × 200 mL), again with water (6 × 200 mL), and at the end with MeOH (elution solvent, 6 × 200 mL). The resin was suspended in MeOH (200 mL) and chilled (−18 °C, 5 h) before use. Chromium(III) acetylacetonate was prepared following the described procedure.26 The synthesis of TMSPMA–POSS was carried out under nitrogen gas flow, in a Schlenk line. The glassware was pre-dried before use at 120 °C. The empty syringes were purged with nitrogen gas before being used for injection of the solvents and reagents. The progress of the reaction was monitored by thin layer chromatography (TLC). TLC was performed on Merck silica gel 60 F254 plates. Chromatograms were visualized using UV light (254 nm). For detection of unreacted amine, the chromatograms were first dipped in a 5% (w/v) solution of ninhydrin in 95% aqueous ethanol and then charred on a hot plate. Preparative separations were performed on a Sepacore® chromatography system (Büchi Labortechnik) consisting of two C-605 pump modules, a C-620 control unit, a C-640 UV-VIS detector, and a C-660 fraction collector. The system was controlled by the SepacoreControl 1.3 software. Flash chromatography separations were performed on pre-packed modified silica gel C18 (40–63 μm) polypropylene cartridges (21.0 × 129 mm, Büchi) at a flow rate of 25 mL min−1. Samples were dissolved in methanol and injected through a six-way valve with a 20 mL loop.2. Syntheses
3. Preparation of porous scaffolds using sugar template, and monoliths
Appropriate sugar templates were prepared from commercially available granulated sugar mixed with ammonium carbonate (ca. 2 wt%), moistened with an evaporated copolymer solution, and closely packed in cubic plastic molds. The sugar was left in the molds at 70 °C for three days. The sugar template was then washed out using warm distilled water (40–50 °C) until the filtrate had no traces of sugar. The presence of sugar was examined using the Molisch (α-naphthol) test. The chemical basis of this reaction is the production of furfural derivatives on heating carbohydrates with naphthols to give colored compounds. A reddish violet appears in the presence of very small amounts of carbohydrates. In the standard Molisch test procedure, 0.5 mL of the filtrate was mixed with 5 mL of cold 75% H2SO4. Three drops of a 3% α-naphthol solution in ethanol were added to the acid mixture. A yellow color was produced by the addition of naphthol. After that, the mixture was warmed up in a water bath at 80 °C. Depending on the amount of carbohydrates, a red to blue-violet color appeared throughout the whole mixture. In the absence of carbohydrates, the examined solution remained yellow. After polymerization gelation, the porogen was removed until the platform was flexible enough to be squeezed comfortably like sponge. When the porogen was completely removed, samples were collected in a furnace and warmed at 100 °C for 1 hour to form hard materials.Monoliths were formed in the same conditions as mentioned above but without using granulated sugar as templates. Here, the resulting sols were transformed to small plastic plugs with a proper cylindrical recess.
4. Methods
5. Micro-structural analyses
X-ray micro-computed tomography is a technique making it possible to produce images of the internal structure of materials. X-ray micro-CT is used e.g. in soil research,27 food characterization,28 rock and concrete investigation,29 and, more often, in medical sciences.30–32 During the test, the X-ray beam is transmitted through the sample while it rotates on the stage within the preset value of the unit angle. The images are recorded on the scintillator that transforms energy from incoming particles into light. The intensity I of the transmitted X-ray beam, according to Beer's law, meets that relationship:
| I(x) = I0e−μx, | (1) |
| μ = ∑fiμiρi, | (2) |
The application of X-ray micro-CT to the analysis of material microstructure requires the adjustment of settings such as the unit angle, filter use, voltage, X-ray source power, etc. In addition, the mathematical reconstruction process is necessary to obtain cross-sections of the sample.33
Nanoindentation is a test method for the determination of the mechanical properties of the material in the nanoscale and the microscale. It was developed by Doerner and Nix34 and later by Oliver and Pharr.35,36
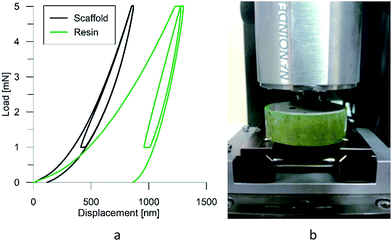
It makes it possible to determine the hardness of the material investigated and its elastic modulus from depth sensing indentation (DSI) load–displacement data. The method was successfully applied to the characterization of the mechanical properties of the materials, e.g. the determination of human bone mechanical properties in the microscale and the nanoscale.37–39 The principle of the nanoindentation method is based on pressing a hard diamond tip with a known geometry (in this case, a Berkovich triangular pyramid) into the sample (Fig. 1b). The load is increased until the preset value, depending on the type of material, etc. As a result of the test, load-versus-displacement curves are obtained as presented in Fig. 1a. Based on the aforementioned curve the following parameters are acquired: maximum loading, Pmax; maximum displacement, hmax; permanent penetration depth, hf; and elastic unloading stiffness, S = dP/dh. Young's modulus can be estimated from the following equation:
 | (3) |
 | (4) |
Results and discussion
1. Synthesis and characterization of 3-(trimethoxysilyl)propyl methacrylate–POSS hybrid
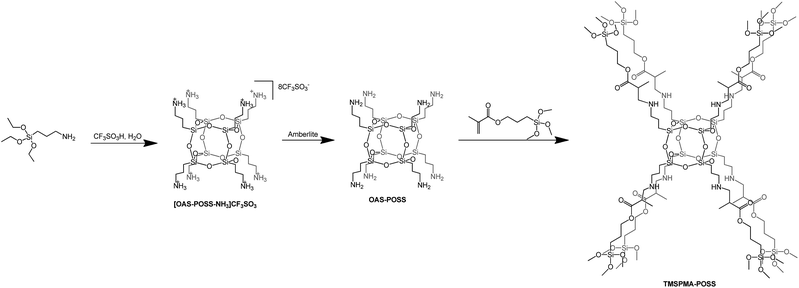
In the first approach, we prepared a trifluoromethanesulfonate–POSS salt [OAS-POSS-NH3]CF3SO3 that was used for further synthesis of an octafunctionalized POSS derivative based on 3-(trimethoxysilyl)propyl methacrylate. [OAS-POSS-NH3]CF3SO3 was obtained in hydrolytic condensation using (3-aminopropyl)triethoxysilane (APTES) and 1.5 equivalents of trifluoromethanesulfonic acid (CF3SO3H) (Scheme 1).Such a starting ionic compound was selected as the most promising material for subsequent synthetic investigations. It does not form a hygroscopic material, which appeared to be more difficult to handle in further manipulations. Moreover, its attractiveness derives from the fact that this compound can be utilized to obtain cube-like aminopropylsilsesquioxane (OAS-POSS). It should be noted that it is much better to generate molecular OAS-POSS in an immediate transformation starting from crystalline, air-stable salt directly before the synthesis of the target product. Another drawback of using OAS-POSS instead of [OAS-POSS-NH3]CF3SO3 is that the aminopropyl derivative constantly evolves in solution.23 The structure of the ionic salt was unambiguously confirmed with multinuclear (1H, 13C, 29Si) NMR spectroscopy and high-resolution mass spectrometry HR-MS (see Experimental section and ESI†).
[OAS-POSS-NH3]CF3SO3 was used for the preparation of an organic–inorganic hybrid compound. To modify the ionic POSS salt, we used 3-(methoxysilyl)propyl methacrylate. This reaction demonstrated that [OAS-POSS-NH3]CF3SO3 constitutes an ideal platform for the controlled synthesis of well-defined cage-like homo-octasilsesquioxanes functionalized by TMSPMA (Scheme 1). 3-(Trimethoxysilyl)propyl methacrylate is already used in various medical applications, e.g. as a dental restorative material.40
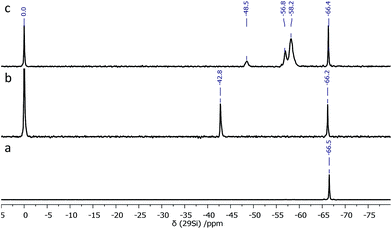
During synthesis, an excess of TMSPMA was used in order to achieve the full octafunctionalization of the silicon cage (T8). After the reaction, the unreacted monomer was simply removed by evaporation. The 29Si NMR spectrum of the resulting TMSPMA–POSS exhibited two symmetrical peaks at δ = −66.2 ppm as expected for the cubic siloxane Si8O12 structure, and at δ = −42.8 ppm, attributed to methoxysilyl –Si(OCH3)3 moieties (Fig. 2).
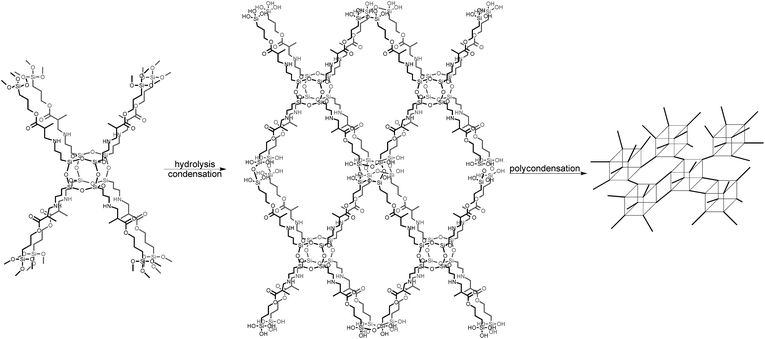
Si(OCH3)3 fragments allow further condensation and polycondensation reactions, which bind together hybrid units after thermal curing (Scheme 2). The presence of other Si signals that would be assigned to other POSS cages, such as T10 or T12, was excluded, which strongly indicates that only one type of silicon atom is engaged in the formation of the polyhedral structure of the TMSPMA–POSS hybrid and is strictly comprised of three siloxane –Si–O–Si– units. Moreover, no silanol –Si–OH groups (before hydrolysis) were observed that would confirm the formation of an open cage-like structure. In this respect, also the mass spectrum {HRMS (ESI+, TOF/CHCl3): m/z (%): 1433.5789 [M + 2H]2+ (calcd 1433.5792)} confirmed the presence of a closed frame structure of eight silicon atoms. The inherence of organic side chains was examined by 1H and 13C NMR spectroscopy (see Experimental section).
In the next step, TMSPMA–POSS was hydrolyzed, which was possible thanks to the presence of methoxysilyl groups; the presence of Si–OH groups was confirmed by a signal located at δ = 13.61 ppm in the proton NMR spectrum. Furthermore, in the 29Si NMR, the chemical shift at δ = −42.8 ppm deriving from –Si(OCH3)3 moieties disappeared and three new signals appeared, located at δ = −48.5, −56.8, and −58.2 ppm, which can be attributed to –Si(OH)3, –Si(O)(OH)2, and –Si(O)2(OH), respectively. The siloxane-cage Si-atom signal is located at δ = −66.4 ppm and is slightly shifted compared to the Si chemical shift of the OAS-POSS substrate (−66.5 ppm). In this manner, after the hydrolysis and condensation reactions, this material formed a transparent sol (Scheme 2).
2. Three-dimensional macroporous scaffold preparation
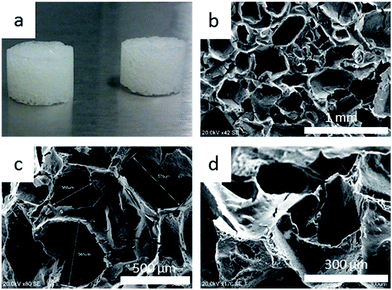
In the next stage of our studies, resulting TMSPMA–POSS was used for the formation of a three-dimensional macroporous scaffold (Fig. 3); such a structure was formed using sugar templates (see Experimental section; paragraph 3).41,42 To that aim, the obtained sol was transferred to plastic molds filled with granulated sugar, which was doped with ca. 2 wt% ammonium carbonate. After the saturation of granulated sugar by an “oily” composite, the material was first gelled at 40 °C and then aged for three days. After a flexible gel appeared, the sugar template was removed using de-ionized water at 60 °C and by gentle squeezing. The presence of sugar in the scaffold was examined by the Molisch test (see Experimental section; paragraph 3). Then, TMSPMA–POSS was thermally condensed to produce a clear, hard, and reproducible hybrid scaffold (Fig. 3a). In further studies, the properties of the material based on condensed TMSPMA–POSS was compared to a pure pTMSPMA polymer for both scaffolds and monoliths. Sugar constitutes an easily-leachable porogen and enables the formation of macropores with a broad range of sizes (150–600 μm) that guarantee the formation of a tissue platform ideal for natural cell/tissue ingrowth, mass transport, and osteoinductive agent attachment.43 Also, the roughness of the scaffold's surface is an important factor that affects cell adhesion abilities, including proliferation.40 For instance, Ericson et al. studied the bonding strength between an implant and natural bone and clearly proved that this phenomenon is greater for rough materials due to the favorable cell adhesion.44Fig. 3 shows the SEM images (b–d) of the resulting thermally cured TMSPMA–POSS scaffold. It can be seen that its structure is macroporous and possesses interconnected channels. Pore sizes are in the range 150–600 μm, whereas their thickness is about 6–8 μm. The roughness of the surface was achieved by the presence of (NH4)2CO3 in the porogen, which spontaneously liberated ammonia and carbon dioxide during thermal decomposition at ca. 60 °C, additionally serving as an agent that opened non-interconnected macropores.41
3. Thermal properties
Thermogravimetric TG-DTA studies show that the pTMSPMA polymer is stable up to 249 °C, and the highest rate of decomposition is reached at 420 °C. In turn, pTMSPMA–POSS has T5% at 274 °C, and its stability is notably higher. On the TG curve, there are two distinct weight losses observed at 365 and 656 °C, respectively. The DSC curves do not suggest any phase transitions (see ESI†).4. Structural properties
| Material parameter | Function |
|---|---|
| Surface area/volume ratio (SAVS) | Important with respect to the ability of cells to attach to scaffold pore walls |
| Pore size | Related to cell adhesion as well as cell migration |
| Pore interconnectivity | Allowing the cell movement through the scaffold |
| Porosity and pore arrangement | Permeability of the material |
| Scaffold anisotropy | Affects the migration, shape, and alignment of cells; a significant parameter describing permeability; necessary in the case of anisotropic tissue |
On the other hand, the mechanical parameters, e.g. the compression strength or Young's modulus, of the scaffold should correspond to the parameters of the tissue as the loading scheme that is subjected to a critical design factor. The parameters of various types of human tissues, e.g. trabecular bone, cortical bone, and soft tissue, differ significantly. Therefore, it is important to evaluate the mechanical properties of the scaffolds under study to compare them to the parameters of human tissues.
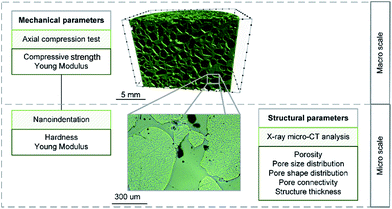
The tests were performed at the macro and the micro scales. Macro scale investigations consisted in the axial compression test. Here, the bulk and foam-like samples were considered. At the micro scale, both mechanical and structural parameters were evaluated with the use of nanoindentation and X-ray microtomography, respectively. The graphical scheme of the experiments performed on the materials is presented in Fig. 4.
The analysis of the structural properties was performed with the use of X-ray micro-CT. Cylindrical specimens from each type of scaffold material with a 10 mm diameter were investigated. A Skyscan 1172 Micro-CT Scanner was used. In the current study, both pTMSPMA and pTMSPMA–POSS samples were rotated from 0 to 360°, and the unit rotation angle was 0.1°. The three-dimensional structure of the samples was obtained after a reconstruction procedure performed by NRecon software based on the Feldkamp algorithm. The size of each pixel was 4 μm. The obtained images were 8 bit bitmaps with the gray scale values of 0 and 255 corresponding to black and white color, respectively.
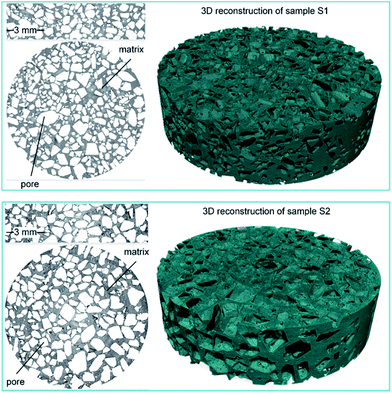
The images were subjected to image processing techniques. Firstly, a median filter was applied, followed by the binarization procedure with the use of the Otsu method.47 As a result, the set of segmented binary images was obtained, which enabled the analysis of the structural parameters. The micro-CT image processing and the analysis scheme are presented in Fig. 5.
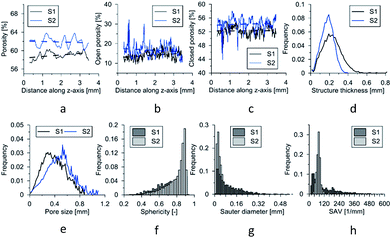
The results of the experiment are shown in Fig. 6. The porosity (total, open, and closed) as function of the height of the sample is displayed in Fig. 6a–c. It is visible that pTMSPMA–POSS has a higher porosity value than pTMSPMA. There are no visible trends; each material has a constant porosity along its height. In addition, the pore size and structure thickness (strut size) distribution was estimated. The calculation of size distribution involves two stages. First, a “skeletonization” is performed to identify the medial axis of all structures. It is followed by a “sphere-fitting” measurement for all the voxels lying along this axis. Local thickness for a point in a solid is defined as the diameter of the largest sphere which fulfills two conditions: the sphere encloses the point (but the point is not necessarily the center of the sphere), and the sphere is entirely bounded within the solid surfaces. The mean pore size for pTMSPMA is 390 μm, whereas for pTMSPMA–POSS it is bigger, approximately 480 μm. The structure thickness distributions show that pTMSPMA–POSS has lower standard deviation, and the mean strut size is around 180 μm.
In terms of pore shapes both samples are alike with the sphericity around 0.8, which indicates a shape close to spherical. The next analyzed parameter was the Sauter diameter, defined as the diameter of a sphere that has the same volume/surface area ratio as the particle of interest, which can be calculated according to the following formula:48
 | (5) |
| Sample | Structural parameters | ||||||
|---|---|---|---|---|---|---|---|
| Porosity [%] | Open porosity [%] | Closed porosity [%] | Mean pore size [mm] | Mean strut diameter [mm] | Mean sphericity | SAV [mm−1] | |
| pTMSPMA | 50.34 | 49.57 | 1.52 | 0.39 | 0.23 | 0.76 | 75.6 |
| pTMSPMA–POSS | 57.68 | 57.38 | 0.70 | 0.48 | 0.18 | 0.80 | 122.2 |
5. Mechanical properties
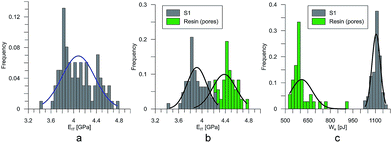
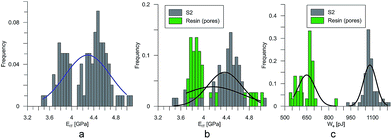
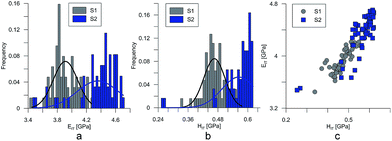
At the micro scale, the mechanical parameters of the scaffolds were evaluated by means of the nanoindentation technique. The Anton Paar TTX-NHT nanoindenter was applied in this study. Both samples were tested with a force of 5 mN, with a loading scheme consisting of two cycles. The nanoindentation tests were performed on a square grid every 20 μm consisting of 100 measurements, both in the scaffold skeleton and in pores, filled with epoxy resin during sample preparation. The results obtained from the test are presented in Fig. 8a and 9a for samples pTMSPMA and pTMSPMA–POSS, respectively. In order to perform a deconvolution process, i.e. to separate the properties of the materials under study from those of the epoxy resin, the histograms of the elastic work were analyzed. It was noticed that the materials exhibited a completely different load–displacement relation (Fig. 1a black line) than the epoxy resin (Fig. 1a green line), indicating that the deformation process was characterized by a small part of the energy dissipation. Based on that observation, the values of Young's modulus and hardness were segmented. The histograms applied in the procedure mentioned above are shown in Fig. 8 and 9 for samples pTMSPMA and pTMSPMA–POSS, respectively. The histograms of the hardness and Young's modulus are presented in Fig. 10a and b. It is visible that the distributions for pTMSPMA and pTMSPMA–POSS differ significantly. In addition, the Young's modulus versus hardness diagram is shown in Fig. 10c.The mean values of Young's modulus and hardness together with the standard deviations are listed in Table 3pTMSPMA–POSS has higher Young's modulus and hardness than pTMSPMA. In addition, the maps of the mechanical parameters of the investigated area are presented in Fig. 11.
| Sample | Mechanical parameters | |
|---|---|---|
| Young's modulus [GPa] | Hardness [GPa] | |
| pTMSPMA | 3.91 ± 0.34 | 0.46 ± 0.08 |
| pTMSPMA–POSS | 4.36 ± 0.57 | 0.57 ± 0.13 |
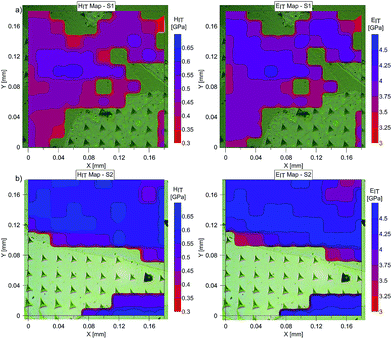 | ||
| Fig. 11 Maps of Young's modulus, EIT, and hardness, HIT, for (a) pTMSPMA (S1) and (b) pTMSPMA–POSS (S2). | ||
The macro mechanical response of the material was tested on two types of cylindrical specimens, namely scaffold-like and monolith ones, with diameters of 12 and 8 mm, respectively. Here, the uniaxial compression test was performed and the maximum loading force was acquired, for each test. The loading rate was constant. The results of the experiment are listed in Table 4.
| Sample | Scaffolds | Monoliths |
|---|---|---|
| pTMSPMA | 0.82 ± 0.22 | 1.2 ± 0.16 |
| pTMSPMA–POSS | 0.21 ± 0.03 | 1.8 ± 0.05 |
Young's modulus evaluated with the use of the nanoindentation technique is the mechanical property of the skeleton of the composite. The overall effective Young's modulus is the mechanical parameter of the composite. In general, it is a function of Young's modulus of the skeleton and the geometry of the microstructure. Applying the well-known micromechanics relations,49i.e. the Hashin–Shtrikman upper bound, the maximum value of the overall Young's modulus of the scaffold under investigation can be estimated.
Based on the performed calculation, the overall Young's modulus for pTMSPMA was estimated to be lower than 1.3 GPa, whereas for pTMSPMA–POSS it was estimated to be lower than 1.16 GPa. The complexity of the microstructure of the materials under study indicates that the overall Young's modulus of the composites is within the range of several hundred MPa. It is necessary, however, to verify this parameter by means of laboratory mechanical tests at the macro scale. The estimated values of Young's modulus in the scaffolds under study are a sign of a very good material with respect to mechanical parameters, compared to other types of tissue engineering materials. The mechanical parameters, namely Young's modulus and compressive strength, of human tissue and hard-tissue engineering materials, found in the literature, are listed in Table 5.
| Type of tissue | Young's modulus [GPa] | Compressive strength [MPa] |
|---|---|---|
| Cortical bone50 | 7–30 | 100–230 |
| Cancellous bone50 | 0.05–0.5 | 2–12 |
| Cartilage50 | 0.2–0.3 | 0.01–3 |
| Collagen tendon50 | 1.5 | 0.14 |
| Amorphous CaP (PLGA)51 | 0.065 | — |
| HA (PLLA)51 | 0.01–0.014 | 0.39 |
| HA (PLGA)51 | 0.002–0.0075 | 0.07–0.22 |
| Bioglass (PLGA)51 | 0.051 | 0.42 |
| Gelatin scaffolds50 | 0.028 | 4.3 |
| Composite scaffolds based on gelatin and partially hydrolyzed alpha-tricalcium phosphate50 | 0.0025–0.0045 | 0.21–0.36 |
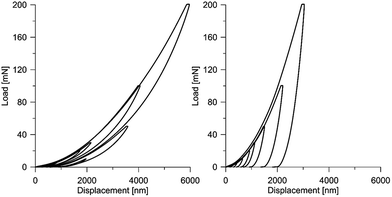
It should be emphasized that the deformational characteristics of the material observed in the nanoindentation tests indicate reversible/elastic deformation, i.e. the deformation process is characterized by a small part of energy dissipation. At the same time, the aforementioned characteristic are in a relatively wide range of load and displacement. This phenomenon is visible in Fig. 12 and 13, where the designed scaffold is compared with the tooth enamel tissue.
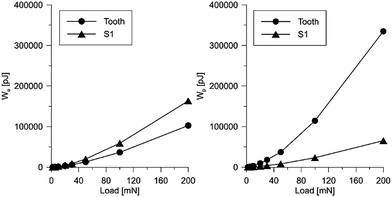 | ||
| Fig. 13 Influence of the applied load on the value of elastic energy (left) and plastic energy (right) for the scaffold and the tooth tissue. | ||
Conclusions
Research concerning the development of novel biomaterials that mimic nature and may serve as the potential platform for hard-tissue regeneration is currently one of the most promising directions in modern implantology. In this work, we presented our brand new results regarding the elaboration of an efficient synthetic strategy to prepare macroporous scaffolds for potential usage in bone tissue engineering. The resulting organic–inorganic hybrid is based on 3-(trimethoxysilyl)propyl methacrylate and octafunctionalized cage-like polyhedral oligomeric silsesquioxane. It should be noted that in vitro studies carried out on POSS constitute a strong evidence for their low cytotoxicity.52 In this manner, we obtained a material that fulfills the requirements for medical materials including chemical composition (safety components that are already used in medicine), porous structure (allows mass transport, cell migration, and proliferation), topography (affects adhesion abilities), and mechanical properties. A special characteristic of the investigated material is its surprisingly high elasticity, connected with the fact that the mechanical deformation process is, mainly, a reversible one. Only a small portion of the external mechanical work is dissipated by the irreversible (plastic) processes. The comparison of the elastic modulus of the developed scaffolds with other materials presented in the literature indicates its high usefulness for hard-tissue engineering. However, for the full examination of the resulting material towards its utilization as a scaffold for potential applications in medicine, the performance of biological studies is necessary. Investigations along these lines are currently underway.Acknowledgements
This work was supported by the National Science Centre, Poland (Grant No. 2013/09/D/ST8/03955).References
- H. Ulrich, Introduction to Industrial Polymers, Hanser Publishers, Munich, New York, 2nd edn, 1993 Search PubMed.
- P. F. Holmes, M. Bohrer and J. Kohn, Prog. Polym. Sci., 2008, 33, 787–796 CrossRef CAS PubMed.
- S. Lin-Gibson, F. A. Landis and P. L. Drzal, Biomaterials, 2006, 27, 1711–1717 CrossRef CAS PubMed.
- C.-D. Young, J.-R. Wu and T.-L. Tsou, Biomaterials, 1998, 19, 1745–1752 CrossRef CAS PubMed.
- J. M. Teijón, R. M. Trigo, O. García and M. D. Blanco, Biomaterials, 1997, 18, 383–388 CrossRef.
- M. Gökce, R. F. Akata and M. Kiremitçi-Gümüşderelioǧlu, Biomaterials, 1996, 17, 941–949 CrossRef.
- H. Zhu, Q. Geng, W. Chen, Y. Zhu, J. Chen and J. Du, J. Mater. Chem. B, 2013, 1, 5496–5504 RSC.
- G. F. Chimonides, J. M. Behrendt, E. Chundoo, C. Bland, A. V. Hine, A. Devitt, D. A. Nagel and A. J. Sutherland, J. Mater. Chem. B, 2014, 2, 7307–7315 RSC.
- Y. Tian, A. Glogowska, W. Zhong, T. Klonisch and M. Xing, J. Mater. Chem. B, 2013, 1, 5264–5272 RSC.
- R. H. Baney, M. Itoh, A. Sakakibara and T. Suzuki, Chem. Rev., 1995, 95, 1409–1430 CrossRef CAS.
- E. Ayandele, B. Sarkar and P. Alexandridis, Nanomaterials, 2012, 2, 445–475 CrossRef CAS.
- J. D. Lichtenhan, Y. A. Otonari and M. J. Carr, Macromolecules, 1995, 28, 8435–8437 CrossRef CAS.
- T. S. Haddad, E. Choe and J. D. Lichtenhan, in Symposium V – Better Ceramics Through Chemistry VII, 1996, vol. 435, p. 25 Search PubMed.
- E. T. Kopesky, T. S. Haddad, R. E. Cohen and G. H. McKinley, Macromolecules, 2004, 37, 8992–9004 CrossRef CAS.
- J. Pyun and K. Matyjaszewski, Macromolecules, 2000, 33, 217–220 CrossRef CAS.
- J. Pyun and K. Matyjaszewski, Chem. Mater., 2001, 13, 3436–3448 CrossRef CAS.
- H. Zhang, H. Lee, Y. Shin, D. Lee and S. K. Noh, Chin. J. Polym. Sci., 2008, 26, 533–537 CrossRef.
- V. Raus, E. Čadová, L. Starovoytova and M. Janata, Macromolecules, 2014, 47, 7311–7320 CrossRef CAS.
- A. Sellinger and R. M. Laine, Macromolecules, 1996, 29, 2327–2330 CrossRef CAS.
- R. Gorkem Sencevik and M. Atilla Tasdelen, Polym. Compos., 2014, 35, 1614–1620 CrossRef CAS.
- L. Matějka, P. Murias and J. Pleštil, Eur. Polym. J., 2012, 48, 260–274 CrossRef.
- J. J. Schwab and J. D. Lichtenhan, Appl. Organomet. Chem., 1998, 12, 707–713 CrossRef CAS.
- M. Janeta, Ł. John, J. Ejfler and S. Szafert, Chem.–Eur. J., 2014, 20, 15966–15974 CrossRef CAS PubMed.
- M. Janeta, Ł. John, J. Ejfler and S. Szafert, RSC Adv., 2015, 5, 72340–72351 RSC.
- M. Janeta, Ł. John, J. Ejfler, T. Lis and S. Szafert, Dalton Trans., 2016 10.1039/c6dt02134d.
- W. C. Fernelius, J. E. Blanch, B. E. Bryant, K. Terada, R. S. Drago and J. K. Stille, in Inorganic Syntheses, ed. T. Moeller, John Wiley & Sons, Inc., Hoboken, NJ, USA, 1957, vol. 5, pp. 130–131 Search PubMed.
- L. J. Munkholm, R. J. Heck and B. Deen, Geoderma, 2012, 181–182, 22–29 CrossRef.
- A. A. Adedeji and M. O. Ngadi, Int. J. Food Eng., 2009, 5, 1452–1466 Search PubMed.
- V. Cnudde, A. Cwirzen, B. Masschaele and P. J. S. Jacobs, Eng. Geol., 2009, 103, 76–83 CrossRef.
- A. de Crespigny, H. Bou-Reslan, M. C. Nishimura, H. Phillips, R. A. D. Carano and H. E. D'Arceuil, J. Neurosci. Methods, 2008, 171, 207–213 CrossRef PubMed.
- A. C. Jones, C. H. Arns, A. P. Sheppard, D. W. Hutmacher, B. K. Milthorpe and M. A. Knackstedt, Biomaterials, 2007, 28, 2491–2504 CrossRef CAS PubMed.
- H. S. Tuan and D. W. Hutmacher, Comput. Aided Des., 2005, 37, 1151–1161 CrossRef.
- M. Rajczakowska, D. Stefaniuk and D. Łydżba, Studia Geotechnica et Mechanica, 2015, 37, 75–84 CrossRef.
- M. f. Doerner, D. s. Gardner and W. d. Nix, J. Mater. Res., 1986, 1, 845–851 CrossRef CAS.
- W. C. Oliver and G. M. Pharr, MRS Bull., 2010, 35, 897–907 CrossRef CAS.
- W. c. Oliver and G. m. Pharr, J. Mater. Res., 2004, 19, 3–20 CrossRef CAS.
- J.-Y. Rho, T. Y. Tsui and G. M. Pharr, Biomaterials, 1997, 18, 1325–1330 CrossRef CAS PubMed.
- J. Y. Rho, P. Zioupos, J. D. Currey and G. M. Pharr, J. Biomech., 2002, 35, 189–198 CrossRef CAS PubMed.
- Z. Fan, J. G. Swadener, J. Y. Rho, M. E. Roy and G. M. Pharr, J. Orthop. Res., 2002, 20, 806–810 CrossRef CAS PubMed.
- K. Hatano, H. Inoue, T. Kojo, T. Matsunaga, T. Tsujisawa, C. Uchiyama and Y. Uchida, Bone, 1999, 25, 439–445 CrossRef CAS PubMed.
- Ł. John, M. Bałtrukiewicz, P. Sobota, R. Brykner, Ł. Cwynar-Zając and P. Dzięgiel, Mater. Sci. Eng., C, 2012, 32, 1849–1858 CrossRef.
- Ł. John, M. Podgórska, J.-M. Nedelec, Ł. Cwynar-Zając and P. Dzięgiel, Mater. Sci. Eng., C, 2016, 68, 117–127 CrossRef PubMed.
- G. Wang, L. Zheng, H. Zhao, J. Miao, C. Sun, H. Liu, Z. Huang, X. Yu, J. Wang and X. Tao, ACS Appl. Mater. Interfaces, 2011, 3, 1692–1701 CAS.
- C. Larsson, P. Thomsen, J. Lausmaa, M. Rodahl, B. Kasemo and L. E. Ericson, Biomaterials, 1994, 15, 1062–1074 CrossRef CAS PubMed.
- J. Wieding, A. Wolf and R. Bader, J. Mech. Behav. Biomed. Mater., 2014, 37, 56–68 CrossRef CAS PubMed.
- J. C. Ashworth, M. Mehr, P. G. Buxton, S. M. Best and R. E. Cameron, Adv. Healthcare Mater., 2015, 4, 1317–1321 CrossRef CAS PubMed.
- N. Otsu, Automatica, 1975, 11, 23–27 Search PubMed.
- J. Sauter, Die Grössenbestimmung der im Gemischnebel von Verbrennungskraftmaschinen vorhandenen Brennstoffteilchen, VDI-Verlag, 1926 Search PubMed.
- S. Torquato, Random Heterogeneous Materials, Springer New York, New York, NY, 2002, vol. 16 Search PubMed.
- S.-H. Lee and H. Shin, Adv. Drug Delivery Rev., 2007, 59, 339–359 CrossRef CAS PubMed.
- K. Rezwan, Q. Z. Chen, J. J. Blaker and A. R. Boccaccini, Biomaterials, 2006, 27, 3413–3431 CrossRef CAS PubMed.
- A. Janaszewska, K. Gradzinska, M. Marcinkowska, B. Klajnert-Maculewicz and W. A. Stanczyk, Materials, 2015, 8, 6062–6070 CrossRef.
Footnote |
| † Electronic supplementary information (ESI) available: 1H, 13C NMR, FT-IR, HR-MS, TG-DTA, DSC and EDS spectra. See DOI: 10.1039/c6ra10364b |
| This journal is © The Royal Society of Chemistry 2016 |

