Dongzhen Chenab,
Zhongxiao Songa,
Feng Chenb,
Jian Huangb,
Jing Weic and
Yongxi Zhao*b
aState Key Laboratory for Mechanical Behavior of Materials, School of Materials Science and Engineering, Xi'an Jiaotong University, Xi'an, Shaanxi 710049, P. R. China
bKey Laboratory of Biomedical Information Engineering of Education Ministry, School of Life Science and Technology, Xi'an Jiaotong University, Xi'an, Shaanxi 710049, P. R. China. E-mail: yxzhao@mail.xjtu.edu.cn
cDepartment of Chemical Engineering, Monash University, Clayton, Victoria 3800, Australia
First published on 4th July 2016
The design and simple synthesis of plasmonic noble metal nanostructures with a highly tunable local surface plasmon resonance (LSPR) band and high density of “hot spots” is pivotal for multifarious wavelength matched, sensitive surface-enhanced Raman scattering (SERS) detection. Herein, inspired by the function of silver ions in nanorod aspect ratio control, a series of Au core@Au–Ag alloy spine nanostructures (Au@Au–Ag) with a controllable surface morphology and size were synthesized via a simple and cheap AgNO3-controlled chemistry and seed-mediated method. In addition, multifunctional L-DOPA was employed, which acts as a reducing agent and capping agent to reduce the Au/Ag ions, stabilize the nanostructures and direct a protuberant growth, so synthetic steps were simplified. Growth of anisotropic multiple sites form a high density of nano-spines, which form dense “hot spots” and a tunable LSPR band from visible to near-infrared wavelength. The correlations between the excitation laser wavelength and electromagnetic (EM) field distribution and enhancement in the Au@Au–Ag were further investigated. The strongest EM field was generated in the gap or tip area of the nanostructures and producing a compact nano-spine is necessary to generate a high density of “hot spots” and obtain a near-infrared signal. The calculated SERS-enhancement factor value of the Au@Au–Ag substrate is higher than 109. Finally, the highly controllable nanoantenna structures make the Au@Au–Ag be a multifarious wavelength compatible, sensitive SERS substrate for practical sensing applications. We further employ the surface-enhanced resonance Raman scattering detection of malachite green using Au@Au–Ag as a substrate under the interference of various ions and organics, which shows excellent anti-interference performance and reproducibility, the relative standard deviation is only 8.2%. Moreover, under the interference of various impurities in complex environmental water samples, the Au@Au–Ag substrate shows high sensitivity with a 100 pM limit of detection.
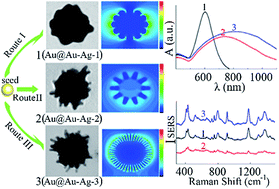
SERS has been used for various applications, such as analysis of protein,3 detection of metal ions,4 recognition of bioactive molecules,5 monitoring of chemical reactions6 and detection of DNA,7 which is an ultrasensitive detection method. Maximizing signal enhancement and generating uniform signal response are two core missions for the current SERS research.8 Generally, engineering of plentiful “hot spots” is applied to achieve Raman enhancement. Moreover, the wavelength of incident light should be in resonance with the LSPR band of the nanostructure to further achieve maximized enhancement.9,10 Consequently, a high controllability of structure and LSPR band plays a key role for effective plasmonic nanostructures employed for SERS, photothermal therapy and photodynamic therapy application etc.11
Relationships between structure and property of nanoparticles can be effectively controlled by shape anisotropy.12 Shape anisotropy possess the ability in tuning the optical properties of plasmonic nanostructures.13 Single-crystal gold nanorods are the most widely studied anisotropic nanoparticles, in which the longitudinal LSPR can be tuned by its aspect ratio. But, for individual nanorod it is no hybridization of plasmon modes14,15 and due to its anisotropic feature, nanorods show low plasmonic effect and low uniformity of SERS signal.8 In contrast to nanorod, branched plasmonic nanostructures featuring closely positioned branches have been used to generate significant local enhancement of the surrounding electromagnetic (EM) field, especially at the tips and gaps.8,16 More importantly, the LSPR band can be tuned effectively by controlling structural feature and density of surface. Our group have developed two kinds of hierarchical structures by depositing Ag nanoparticles (NPs) onto Ag dendrites/Si nanoneedles, in which Ag dendrites-based SERS substrates possess highly efficient SERS sensing effect.17,18 In our previous studies the size of Ag dendrites and the gap of Ag dendrites is in micrometer-scale, which is difficult to turn the structure in nanoscale. Nevertheless strongest EM field was observed in the nanoscale gap area,19 which incurs difficulty of our Ag dendrites to obtain higher enhancement factor. In addition, because the large vacant site of Ag dendrites, the laser spot has a larger chance shine in vacant site, leading to a poor uniformity. Hence, the precise design and synthesis of plasmonic nanostructures is pivotal to manipulate the LSPR characteristics and SERS performance of noble metallic materials.9
Solution-phase synthesis of metal nanostructures is an efficient method due to its good reproducibility and controllability.20 Solution-phase synthesis method is also possible to generate branched nanostructures with controllable morphology and “hot spots” in individual nanoparticles.21 In order to generate anisotropic branched nanostructures, seedless solution-phase synthesis protocol has been employed.22–25 In terms of seedless synthesis protocol, changing the initial concentrations of precursor may alter the driving force for the growth of nanocrystals. However, it is often difficult to tune the size or shape of nanocrystals via seedless solution synthesis.26 In comparison to seedless synthesis protocol, the seed-mediated synthesis can control of the size and shape of Au nanostructures more easily.27 Various branched Au nanostructures with tunable size and shape have been produced using seed-mediated synthesis method.8,28–34 Many branched plasmonic nanostructures have been reported, which possess excellent LSPR properties. For the present synthetic method, it need adding surfactant or stabilizer to mediate growth and stabilize the shape, such as CTAB solution, chitosan solution, polyethylene glycol tert-octylphenyl ether solution or polyethylene glycol solution, where multiple complicated steps were included. Moreover the plasmonic branched nanostructures with a highly tunable surface feature and size have not been well synthesized. Most of the reported branched nanostructures show broadly distributed arm lengths and low density of “hot spots”. It remains a great challenge to generate highly tunable morphology and number of branches on the surface, which is significant for controllability of LSPR band from visible to near-infrared range and generation of “hot spots”. The tunable LSPR band is very beneficial to metal–molecule system resonance with different wavelengths of incident laser and large number of sharp plasmonic nanobranches in single particle can generate the strong EM field. In spite of these interesting properties, there have not been enough experimental investigations for these properties. Reliable and simple synthetic protocols for a series of nanostructures have not been readily available for these investigations. Furthermore, it would be available to produce a series of branched plasmonic nanostructures with different branch morphology and size in a controllable process, due to their newly physical and chemical properties, such as their electron transfer or tunable and intense LSPR characteristics.
Herein, inspired by the function of sliver ions in nanorod aspect ratio control, a simple, cheap, and scalable AgNO3-controlled chemistry and seeded growth method was used to synthesize various Au core@Au–Ag alloy spine nanostructures (Au@Ag–Ag) with tunable LSPR band and dense “hot spots”. Moreover multifunctional L-DOPA was employed. L-DOPA act as a reducing agent and capping agents to reduce the Au/Ag ions, stabilize the nanostructures and direct a protuberant growth, which can simplify the synthetic steps. AgNO3 was introduced to control structural feature in the presence of single-crystal Au seeds. Silver monolayer can be formed on the more open surface of a growing Au nanoparticles via the process of underpotential deposition,35 leading to the formation of final Au–Ag alloy nanostructures. Such metal nanostructures show higher performance than pure Ag nanostructures or Au nanostructures.8 Moreover, the size of the Au@Au–Ag could be tuned easily by controlling the ratio of seeds. The shape, size, plasmonic coupling properties and SERS signals of Au@Au–Ag have also been investigated. A series of Au@Au–Ag with different morphologies and sizes cover large range of LSPR band. As the number and length of the nano-spines was increased, highly dense “hot spots” were formed and LSPR peaks shows red shift. The LSPR maximum of plasmonic structures can match well with a wide range of excitation wavelength, which is beneficial to metal-molecule system resonance with the incident detection laser.9,36 The Au@Au–Ag could generate strong local EM field enhancement and SERS signal in the gap or tip area. The tunable LSPR band, the strong EM fields, the near-infrared signal, and large SERS intensity depend on length and density of spines, which show that Au@Au–Ag are ideal SERS substrates for various molecules sensing.9 Finally, the prepared Au@Au–Ag featuring 640 nm LSPR maximum is employed for surface-enhanced resonance Raman scattering (SERRS) detection of malachite green (MG), which can cause carcinogenesis, mutagenesis, and chromosomal fractures.18 The prepared Au@Au–Ag exhibited excellent anti-interference performance, signal reproducibility and sensitivity in MG detection. The practicality and reliability of Au@Au–Ag for SERRS detection are also demonstrated via the successful analysis of MG in the complex environmental water samples.
Fig. 1d–f display the TEM images of Au@Au–Ag prepared by employing the typical procedure. The surface features can be easily controlled by varying the amount of AgNO3 solution added into the reaction system. It can be seen that the products display flower, thin spines, dense spines-like particles respectively. As shown in Fig. 1d (Au@Au–Ag-1) the nano-petals closely cover the surface of the gold core when the volume of AgNO3 is 2.4 μL. The average overall size was 100 nm and the average radius of nanopetals was 10 nm. At such low Ag+ concentrations, silver layer will be displaced and oxidized completely by gold ions,37 and L-DOPA play the major role in directing petals like shape. After the function of L-DOPA, amine and carboxylic acid functional groups can stabilize small Au nanoparticles formed in growth solution via strong coordination. Hydrogen bonds between the L-DOPA molecules can lead small Au nanoparticles aggregating with each other, then this “glue” effect will produce a petals like surface.38 When the volume of AgNO3 was increased from 2.4 to 24 μL, Ag underpotential deposition or the selective absorption on the side facet, which may inhibit the deposition of Au atom on those crystal face and relatively promotes the anisotropic growth.35,39 As shown in Fig. 1e, nano-spines protruding on the Au core surface were formed (Au@Au–Ag-2). The average overall size of resultant core-spines nanoparticles and the average length of nano-spines were 150 and 12 nm respectively. Hence Ag could be the dominance of the particle growth. As shown in Fig. 1f, as the volume of AgNO3 was increased from 24 to 96 μL, Au@Au–Ag-3 was formed which have more densely and longer anisotropic nano-spines, the average overall sizes of the Au@Au–Ag-3 and the length of their spines were linearly increased to 200 and 32.5 nm respectively. Some research have reported the increasement of Ag+ concentration can adjust the growth rates between Au{100} and Au{110} and lead to the increased aspect ratio of gold nanorods,35,37 which could explain the fact that the more densely and longer protruding nano-spines was formed when increase the volume of AgNO3 solution from 24 to 96 μL. Moreover, L-DOPA act as a reducing agent and capping agents can reduce the Au/Ag ions, stabilize the nanostructures. However, when the volume AgNO3 solution was further increased to 240 μL, nonuniform morphology (Au@Au–Ag-4) was obtained. As show in Fig. S2,† some size of Au@Au–Ag become larger approach to 300 nm and other smaller Au@Au–Ag approximating 100 nm and some spherical nanoparticles was formed. It was found the density and length of the nano-spines was increased when increase the volume of AgNO3 in a limited extent. AgNO3 assisted and L-DOPA mediated anisotropic multiple site growing of single crystal plasmonic nano-spines is a controllable and simple pathway to produce branched nanostructures with various surface features and size. Moreover, through varying the amount of Au seeds added into growth solution, the size of Au@Au–Ag can be tuned easily. As shown in Fig. S3,† a serious of Au@Au–Ag-3 with different size of 100, 120, 150 and 300 nm were synthesized.
Due to the high diffusion coefficient of Au atoms and their face-centered cubic nature, Au nanocrystals tend to show a shape of truncated octahedron, cube, octahedron, icosahedron, or decahedron.40 Within the thermodynamically controlled regime anisotropic overgrowth can't occur. Solution-phase formation of anisotropic highly branched nanocrystals is difficult. Typically, the Au@Au–Ag are a shape deviated from those thermodynamically favorable terms.29 Forming of Au@Au–Ag were caused likely through a kinetically controlled process dependent on the following conditions: (i) equal concentration of HAuCl4 and reductant L-DOPA (10 mM) involve relatively weak reducing rate and L-DOPA can stabilize the nanostructures and direct a protuberant growth. (ii) Introduction of Ag+ assisted growth solution, Ag underpotential deposition or selective absorption on the side facet prevents further Au atom deposition on those positions, leading to the anisotropic growth;35 (iii) the use of a lower reaction temperature (10 °C), because the higher temperature will accelerate the reaction speed and activate the Au atoms to more easy diffusion, and high diffusion of Au atoms will eliminate anisotropic growth of the tips.38,41,42 The Au@Au–Ag with a thermodynamically unfavorable morphology should derive from these reaction parameters, where the growth was forced into a kinetically steerable process.
After growth of Ag@Au alloy, TEM image of Au@Au–Ag shows a single core and spines nanostructures, plentiful anisotropic spines clearly display on the Au core (Fig. 2a). Fig. 2a shows a single particle of Au@Au–Ag-3 with the sizes of 100 nm, and the average size of spines are 5 nm in bottom radius, 3 nm in top radius and 20 nm in length. Fig. 2b–d show high resolution transmission electron microscopy images labeled by boxes in Fig. 2a, without any dislocations and crystal lattice change of periodic lattice fringes was found in the “spine” point (Fig. 2b–d), indicating a single-crystal structure.43 The lattice space is 0.23 nm in Fig. 2b and d and 0.2 nm in Fig. 2c, which could be indexed to the {111} and {100} planes of fcc Au. The composition of Au@Au–Ag was studied through energy dispersive spectrometer mapping. Fig. 2e shows line-scanning profiling analysis of Au and Ag, which nearly homogeneously distributed across the Au@Au–Ag along the direction marked by yellow line. As shown by elemental mapping of Au and Ag (Fig. 2f and g), both Au and Ag are fully overlapped. Line-scanning profiling analysis and elemental mapping reveal the Au–Ag alloy structures of spines.44 In comparable to pure Ag nanostructures or Au nanostructures, the Au–Ag alloy nanostructures possess better chemical stability and more excellent plasmonic property, which is advantageous in many plasmonic applications.8,45
The amplified EM field at interior gap or tip within a single nanoparticle is major source of optical signal amplification.19,46 In order to further demonstrate the relationships between EM field enhancement, structure feature and excitation laser wavelength, FDTD method was employed at 514, 633, and 785 nm excitation wavelengths to calculate the local EM field intensity and distribution with different surface morphologies. Three kinds of model nanostructures (Fig. S4†) have been designed depending on TEM image (Fig. 1), which have different surface topographies: (i) nano-petals like (Au@Au–Ag-1), (ii) thin nano-spines like (Au@Au–Ag-2), and (iii) dense nano-spines like (Au@Au–Ag-3). As shown in Fig. 3, the calculation results show that the stronger EM field is induced in the gap or tip of branches, which generate dense “hot spots”. While more delocalized EM field is noticed from the Au@Au–Ag. Importantly, when the density of surface is increased, as like Au@Au–Ag-1, Au@Au–Ag-2 and Au@Au–Ag-3, the absolute intensity of EM field become stronger as show in Fig. 3.
![]() | ||
Fig. 3 The FDTD calculation-based EM field enhancements and distributions of Au@Au–Ag-1, Au@Au–Ag-2, and Au@Au–Ag-3 at 514, 633 and 785 nm excitation wavelengths. |
Moreover, it is obvious the LSPR mode is red shifted as the density of nano-spines becomes more thickset.9 The overall trends of calculated EM field enhancements and distributions match well with the UV-vis spectra and SERS signals (Fig. 4a and b). Moreover, we also calculated EM field enhancement and distribution of Au@Au–Ag-3 with the size 100 nm (TEM show in Fig. S3a†). Importantly, as show in Fig. S5† the charge transfer mode of 100 nm Au@Au–Ag-3 was blue shifted compared with Au@Au–Ag-3 (200 nm). For Au@Au–Ag-3 (100 nm), the strongest local EM field was generated with 633 nm incident light, which matches well with the experimental result for the Au@Au–Ag-3 (100 nm) case (the black spectrum in Fig. S6†). Our calculations suggest that the closely positioned nanobranches are the key for obtaining dense “hot spots” and near-infrared signal. Surface density of nano-spines and size of particles govern the plasmon modes.
The LSPR features are strongly dependent on their shape and size of a nanocrystal. For Ag (or Au) nanocrystals, LSPR governs the optical property of individual nanoparticle.27 The optical properties of the Au@Au–Ag was characterized using UV-vis extinction spectra. The Au@Au–Ag showed explicit LSPR features, in spite of their structural complexity. Fig. 4a shows the UV-vis spectra of a series of Au@Au–Ag with different volume of AgNO3. Notably, the tip-localized mode relating to longitudinal resonance mode,29 the peak position could be continuously red-shifted from 600 to 840 nm as the volume of AgNO3 was increased from 2.4 to 96 μL. These results are coincident with the structural change displayed by TEM imaging (Fig. 1) and FDTD calculation results (Fig. 3). When volume of AgNO3 was increased to 96 μL, the increasement of length and density of spines cause red-shift of their LSPR peak. However, as the volume of AgNO3 was further increased to 240 μL, the LSPR band underwent a little blue shift in comparison to Au@Au–Ag-3, because of generating some smaller size as show in Fig. S2† and increasing in the mole fraction of Ag.45
The overall SERS activity may be affected by any variation in morphologies of the plasmonic nanostructures.47 To investigate how structural changing in the Au@Au–Ag affects SERS signal, the Raman measurements (excitation wavelength of 633 nm) on the Au@Au–Ag samples was carried out. Through dropping and evaporating 50 μL of Au@Au–Ag-1, Au@Au–Ag-2, Au@Au–Ag-3 and Au@Au–Ag-4 solution onto 0.7 cm × 0.7 cm silicon slice respectively, the particles may self-assemble and form SERS substrates. The preparation process of Au@Au–Ag-1, Au@Au–Ag-2, Au@Au–Ag-3 and Au@Au–Ag-4 are same excepting different AgNO3 amount, so the concentration of four kinds of particle solution is same. We can assume the main difference of Raman enhancement derive from plasmonic surface feature. Afterwards, dropping 25 μL CV solution with equal concentration onto Au@Au–Ag-1, Au@Au–Ag-2, Au@Au–Ag-3 and Au@Au–Ag-4 substrates respectively. Fig. 4b shows the measured SERS spectra of crystal violet (CV) molecules based on Au@Au–Ag-1, Au@Au–Ag-2, Au@Au–Ag-3 and Au@Au–Ag-4 substrates with varying plasmonic surface features. The characteristic peaks of CV at 1177 and 1371 cm−1 was well consistent with the reported spectra.18 From Fig. 4b, the Au@Au–Ag-3 shows much better SERS activity than other nanostructures (Au@Au–Ag-1, 2 and 4). As show in Fig. 1f, Au@Au–Ag-3 feature closely spaced branches leading to form strongest local amplified EM field at 633 nm excitation wavelengths, which is expected to be the most significant source of SERS signals enhancement.47 At the same time, the Au@Au–Ag-1 shows stronger SERS intensity than Au@Au–Ag-2, mainly because 633 nm laser wavelength is more close to the SPR of Au@Au–Ag-1, which could generate more stronger resonance with the incident laser.9,47 Raman signals from the produced substrates with different volume of AgNO3 were correlated with the FDTD calculation results (Fig. 3). Excepting contribution of roughened surface to Raman enhancement, the self-assemble of particles can generate “hotspots” in gaps, the calculated enhancement factor (EF) of Au@Au–Ag-1 substrate reaches up to 2.67 × 10⁹, which is better than other Au meatball-like or flower-like particle.48 In addition, Au@Au–Ag-4 substrate also displays excellent SERS activity, according to previous study, its inhomogeneous particles morphologies may lead to imperfect reproducibility in their applications.49 From our research, the self-assemble of sharp or dense spine nanostructures can acquire more dense “hot spots” and large SERS intensity.
In actual detection, all kinds of complex samples may be involved, such as whole milk, contaminated water, industrial wastes, and blood serum. Purification procedure is often time-consuming and complicated. Malachite green (MG) is a forbidden triphenylmethane dye in aquaculture. It often coexists with various impurities, such as ions, antibacterial agent and organic metabolites. For detection of MG in environmental water, additional purification procedure to remove the coexisting impurities was unnecessary. Hence the detection for MG in complex samples containing ions, antibacterial agent and organic metabolites possess important significance. Here, a devised SERS-based method was employed to detect MG molecules from an artificial complex samples under the interference of various ions, antibacterial agent and organic metabolites. The means of mixing the Au@Au–Ag suspension with target detection solution was used. Then dropping and evaporating the dispersion of Au@Au–Ag onto a glass slide, where the Au@Au–Ag may self-assemble and aggregate each other.
Due to the molecular resonance of MG generating a maximum absorption at the wavelength of 620 nm,48 which is very approximate that of the incident laser (633 nm). The Au@Au–Ag-3 with the size of 100 nm (Fig. S3a†) was selected as SERS substrate which has the LSPR maximum at 640 nm (the black spectrum in Fig. S6†) and possesses rich “hot spots”, the calculated result show in Fig. S5.† Then the MG in complex samples was detected employing incident laser with wavelength of 633 nm, the metal-molecule system is in resonance with wavelength of the incident light, a relatively large effect of SERRS could be generated.
In addition, according to previous research, MG is a kind of cationic triphenylmethane dye.50 Moreover the metal cations may absorb themselves onto the nanoparticals surface and produce a repulsive force. The MG adsorption could be hindered,50 which may affect the SERS signal of MG itself. Hence, the effect of various coexistent metal ions on SERS signal including Al3+, K+, Na+, Ba2+, Mg2+, Fe3+ and Ni2+ have been investigated. By the method of dropping and evaporating the suspension containing Au@Au–Ag, MG and interfering ion onto a glass slide, a serious of SERS spectra was studied. As shown in Fig. 5a, the most prominent peaks of MG appeared, such as 798, 913, and 1169 cm−1. At the same time, after addition of Al3+, K+, Na+, Ba2+, Mg2+, Fe3+ and Ni2+, reduction of SERS signal was found compared with the pure MG aqueous solution. As the Fig. 5a shows, the intensities adding Ni2+, and Fe3+ was higher than other ions, which phenomenon is consistent with our previous research.18 The metal ions-mediated enhancement mechanism may cause this phenomenon, which is being investigated by us. However, detection of MG was completed successfully under interference of various ions. The good anti-interference performance of Au@Au–Ag is verified in SERS detection.
In aquaculture, illicit drugs such as antibacterial agent and other organics are often present in pond water.18 Hence, the detection of MG in samples containing antibiotic and other organics is necessary. The experiments were conducted by mixing the Au@Au–Ag suspension with MG lake water solution containing glucan, ann benzylpenicillin sodium, gentamicin sulphate, sucrose and urea respectively (Fig. 5b). As shown in Fig. 5b, Raman signal of MG at 1169 cm−1 appeared obviously, although these organics feature different kinds of chemical structures and nearly no supererogatory peaks were observed in (i–vi) spectral line compared with pure MG aqueous solution in (vii) (without any impurity), which is beneficial for practical samples detection.
In all, the experimental results showed that none of Raman signal shifts was caused by these coexistent metal ions or biochemistry organics in solution. These results confirmed high accuracy and selectivity of our Au@Au–Ag substrate in complex samples.
The uniformity and reproducibility are important issues for SERS detection. Au@Au–Ag are a kind of uniform and controllable nanostructures. Raman signals with 20 spectra in different area were showed in Fig. 5c, the intensity of the 1069 cm−1 peak from those 20 SERS spectra were plotted as histogram in Fig. S7.† The relative standard deviation is only 8.2% (Fig. 5c), these results confirmed the Au@Au–Ag film is a uniform SERS substrate and showed good reproducibility at the ensemble measurement level. Fig. 5d shows two dimensional Raman mapping at the MG Raman peak of 1169 cm−1, the scanning area is 4 μm2 including at least 200 Au@Au–Ag particles, which is enough to obtain the real signal from the ensemble of Au@Au–Ag substrate. As shown in Fig. 5d, each pixel shows a uniform signal intensity. It is noteworthy that the detected zone presented here was stochastic. Moreover, the Au@Au–Ag particle size is around 100 nm, and the laser spot is approximately 1 μm, which can cover at least 50 Au@Au–Ag particles within this area, which makes it easy to obtain integral signal from ensemble nanoparticles and improve the uniformity.8 Hence, the assembly of Au@Au–Ag displays excellent uniformity for SERS measurements.
In order to further verify the practicability of the produced Au@Au–Ag substrate, the detection of MG in spiked complex pond water samples was investigated, and the results were showed in Fig. 6. The detections for MG were conducted by dropping and evaporating the dispersion of Au@Au–Ag with the pond water which spiked with various MG concentrations. The detection curves of MG in pond water was uniform with standard SERS spectra of MG, the detection curves are accurate at various MG concentrations and with the 100 pM limits of detection. These results confirmed highly reliable and sensitive MG detection in the practical application.
![]() | ||
Fig. 6 Detection of MG in spiked complex environmental water, (i) 1 × 10⁻⁶ M, (ii) 1 × 10⁻⁷ M, (iii) 1 × 10⁻⁸ M (iv) 1 × 10⁻⁹ M, (v) 1 × 10⁻¹⁰ M. |
Footnote |
† Electronic supplementary information (ESI) available. See DOI: 10.1039/c6ra13420c |
This journal is © The Royal Society of Chemistry 2016 |