DOI:
10.1039/C6RA12898J
(Paper)
RSC Adv., 2016,
6, 71052-71060
La and F co-doped Bi2MoO6 architectures with enhanced photocatalytic performance via synergistic effect
Received
18th May 2016
, Accepted 12th July 2016
First published on 13th July 2016
Abstract
Novel La and F co-doped Bi2MoO6 architectures were first successfully synthesized via a facile solvothermal process, and characterized using XRD, SEM, TEM/HR-TEM, XPS, EDS, UV-Vis DRS and PL spectra. The enhanced photocatalytic activities of La and F co-doped Bi2MoO6 architectures were evaluated by the photodegradation of rhodamine B (RhB) under visible-light irradiation. The results demonstrated that the F-1.0 at% La–Bi2MoO6 photocatalyst exhibits significantly enhanced photocatalytic activity, which is 6.54 times higher than that of pure Bi2MoO6. The cause can be attributed to the co-incorporation of La and F into Bi2MoO6 broadening the absorption in the visible-light region and thereby leading to the formation of new energy levels on top of the valence band of F–La–Bi2MoO6, and on the other hand, the synergistic effect of F and La, in which F doping led to the increase of absorptivity of F–Bi2MoO6 and acted as an n-type impurity to supply a hole carrier. The doped La3+ ions act in a key role to capture and transfer/release the photogenerated electrons for conversion from O2 to ·O2− to delay the recombination of the photogenerated electrons and holes, greatly suppressing the recombination of photogenerated electron–hole pairs and thus significantly improving photocatalytic activity in RhB photodegradation. The radical capture experiment confirmed that h+ and ·O2− were the main active species and were responsible for RhB photodegradation. Moreover, on the basis of the PL spectra, active species trapping detection and photocurrent response experiments, the mechanism of the enhanced photocatalytic activity for F–La–Bi2MoO6 was proposed.
1 Introduction
During the past few decades, with the increase in environmental crises and energy shortages, the study of environmental purification- and energy conversion-based efficient photocatalysts and solar cells have attracted considerable attention. Titanium dioxide (TiO2) has been widely investigated due to its high activity, long-term stability, low price and availability.1–3 Unfortunately, TiO2-based photocatalysts possess a wide band gap of 3.2 eV and can be activated under UV light, which only accounts for 4% of solar energy, thus greatly limiting their practical applications.4,5 From the viewpoint of solar energy utilization, it is very urgent to develop efficient visible-light-active photocatalysts for broadening the visible-light-responsive range of TiO2-based photocatalysts,6,7 and to exploit new photocatalysts, such as a promising Bi2MoO6-based photocatalytic system.8
Bi2MoO6 consists of [Bi2O2]2+ layers sandwiched between [MoO4]2− slabs, is a layered Aurivillius related oxide,9,10 and is a semiconductor with a smaller band gap (2.5–2.8 eV), capable of capturing visible light and exhibiting photocatalytic activity for water splitting and degradation of organic pollutants.8,11–13 However, owing to the rapid recombination of Bi2MoO6-based photocatalysts as photogenerated carriers, its practical application is greatly limited.14,15 Therefore, to overcome these drawbacks of Bi2MoO6, various strategies have been explored to improve the photocatalytic efficiency of Bi2MoO6, such as noble metal deposition modification,16 heterostructure construction,17,18 ion doping,19,20etc. Among these strategies, element doping has proven to be a commonly facile and efficient route to broaden the visible responsive region and repress the recombination of electron–hole pairs.21 For instance, Alemi and co-workers successfully synthesized Ln(Gd3+, Ho3+ and Yb3+)-doped Bi2MoO6 with an Aurivillius layered structure and indicated a high optical response to visible light.22 Especially, fluorination is an effective method to repress the recombination of charge carriers,23 which has been observed in many fluorinated semiconductors such as F-doped TiO2 (F/TiO2),24–26 F/Bi2O3,27 F/BiPO4,28 and F/Bi2WO6.29 To further achieve optimal photocatalytic activities, people have turned to co-doping two elements into a photocatalyst in order to utilize the synergistic effect for enhancing their photocatalytic performance.21 Recently, F/Ca, Si/Fe, La/F and N/La co-doped-TiO2 photocatalysts with significantly improved photocatalytic activity were reported,7,30–33 and Ce and F co-doped-Bi2WO6 with enhanced photocatalytic activity has been successfully synthesized.21 Nevertheless, on the basis of the synergistic effect of F and La two-element co-dopants, investigations focused on the co-doping of nonmetal and metal elements into Bi2MoO6-based photocatalysts for improving photocatalytic performance are neglected.
In this study, an F/La-co-doped Bi2MoO6 photocatalyst has been successfully prepared via a facile one-step alcohol-thermal method for the first time. Rhodamine B was selected to evaluate the photocatalytic visible-light-responsive activity of the F and La co-doped Bi2MoO6. The mechanism for the enhancement of the photocatalytic activity of the F–La–Bi2MoO6 architectures was also discussed according to the results from the photoluminescence (PL) spectra, active species trapping detection and photocurrent response experiments.
2 Experimental
2.1 Synthesis of F–La–Bi2MoO6
All chemical reagents were analytical grade and used without further purification. For F/La-co-doped Bi2MoO6, a typical synthesis procedure is as follows: Bi(NO3)3·5H2O (1.3 mmol) was dissolved in 13 mL of ethylene glycol. Then, powdered Na2MoO4·2H2O (0.65 mmol) was added to the above solution and stirred at room temperature for 20 min to obtain solution A. Concurrently, La(NO3)3·6H2O (0.013 mmol) and NaF (0.65 mmol) were stirred in 32.5 mL of ethanol at room temperature for 20 min to obtain a clear solution B (theoretical molar ratio: F/Mo = 1). Afterwards, solution B was slowly added dropwise into solution A under stirring to form a homogeneous solution. After being stirred for 30 min, the resulting solution was transferred into a 65 mL Teflon-lined stainless steel autoclave and kept at 160 °C for 12 h. Subsequently, the autoclave was naturally cooled down to room temperature. The obtained samples were separated centrifugally, washed with ethanol and deionized water several times, and finally dried at 80 °C for 12 h in air. For the synthesis of F–Bi2MoO6 and La–Bi2MoO6, a similar process was used.
2.2 Characterization
X-ray diffraction (XRD) analysis was performed on a Shimadzu XRD-7000 X-ray diffractometer using Cu-Kα radiation (λ = 0.15418 nm) at a scanning rate of 2° per minute in the 2θ range of 20–80°. The accelerating voltage and the applied current were 40 kV and 30 mA, respectively. X-ray photoelectron spectroscopy (XPS) images were recorded on a PHI-5400 X-ray photoelectron spectrometer. The field emission scanning electron microscopy (FE-SEM) images were taken on a JSM-6700F scanning electron microscope. (High-resolution) transmission electron microscopy ((HR)TEM) images and selected area electron diffraction (SAED) patterns were recorded on a JEM-2100 electron microscope at an accelerating voltage of 200 kV. Nitrogen physisorption was carried out on a Micrometrics ASAP2010 volumetric adsorption apparatus at 77.4 K [am(N2, 77 K) = 0.162 nm2] and the Brunauer–Emmett–Teller (BET) specific surface area (SBET) was obtained from the adsorption data at relative pressure P/P0 ranging from 0.05 to 0.2. The UV-Vis diffuse reflectance (UV-Vis-DRS) spectra of the samples were obtained using a Shimadzu UV-2550 UV-Vis spectrophotometer. BaSO4 was used as a reflectance standard. Photoluminescence (PL) spectra were measured using a F-4500 spectrophotometer (Hitachi, Japan) at an excitation at 400 nm. Time-resolved fluorescence decay spectra (TR-PL) were recorded on a FLS920 fluorescence spectrometer (Edinburgh Analytical Instruments, UK) using the time-correlated single photon counting method, excited with a picosecond diode laser (EPL-375) at 377.8 nm, and monitored at 460 nm.
2.3 Photocurrent–time measurement
Photocurrent measurements were performed on a CHI 660D electrochemical workstation (Shanghai Chenhua, China) using a standard three-electrode configuration with a working electrode, a platinum wire as a counter electrode, and a saturated calomel electrode (SCE) in saturated KCl as a reference electrode. The typical working electrode was prepared as follows: 10 mg of ground sample was dispersed ultrasonically in 2 mL of distilled water to make a slurry. The slurry was then dispersed onto an ITO glass electrode and the electrode was dried at 60 °C for 6 h. The photocurrent measurement was carried out at the open circuit potential. The light source employed was a 400 W halogen lamp. Prior to and during the measurements, Na2SO4 (0.5 M) aqueous solution was used as the electrolyte.
2.4 Photocatalytic activity
The evaluation of the photocatalytic performance of samples for photocatalytic decolorization of an RhB aqueous solution was performed as follows: a 400 W halogen lamp was used as the visible-light source with a cutoff filter to cut off the light below 420 nm. The suspensions containing 200 mg of photocatalyst and 200 mL of a fresh aqueous solution of RhB (10 mg L−1) were continuously stirred in the dark for 1 h to establish an adsorption/desorption equilibrium for the RhB solution. After this period of time, the light source was turned on. During the reaction, 5 mL of solution samples were taken at given time intervals and the photocatalysts were separated through centrifugation. The supernatant solution was decanted and the absorbance of RhB was determined through its maximum absorption band using a Shimadzu 2550 UV-visible spectrophotometer and the absorption peak at 553 nm was monitored. The photocatalytic degradation efficiency for RhB was obtained according to the concentration of the solution.
3 Results and discussion
3.1 Crystalline phase analysis using XRD and chemical state analysis using XPS
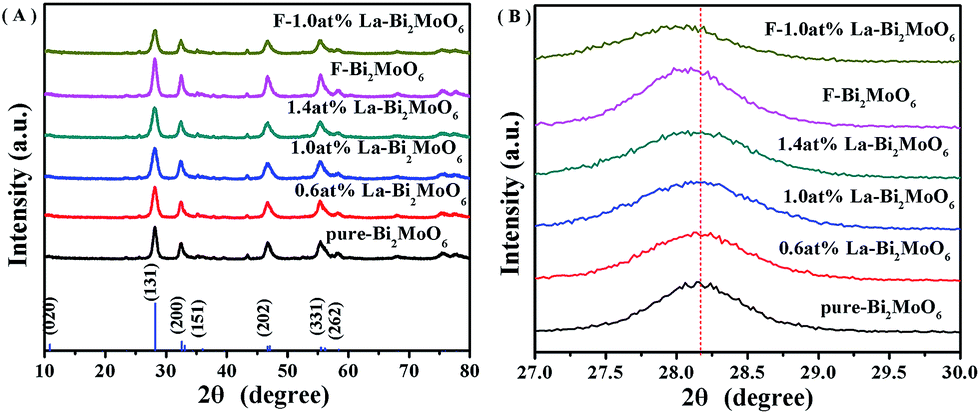
The XRD patterns of pure-Bi2MoO6, F-doped and La-doped Bi2MoO6 shown in Fig. 1 clearly display characteristic diffraction peaks of Bi2MoO6 (JCPDS card no. 76-2388). And the doping of La and F did not influence the crystal phase of the Bi2MoO6 photocatalysts. With increasing the La3+ concentration (from 0.6 to 1.4 at%) the intensity of the diffraction peaks shown in Fig. 1A slightly decreased. As La3+ (104 pm) and Bi3+ (103 pm) have a closed ionic radius, no obvious shifts of the diffraction peak positions for the La-doped Bi2MoO6 samples are observed. However, a slight shift to a lower 2θ value for the peak (131) occurred for samples of F and F–La doped Bi2MoO6 as shown in Fig. 1B. According to the Bragg equation, the unit cell parameters of pure Bi2MoO6 and F-1.0 at% La–Bi2MoO6 are calculated, showing a = 5.5027 Å, b = 16.2538 Å, and c = 5.4900 Å for pure Bi2MoO6, and a = 5.5087 Å, b = 16.2749 Å, and c = 5.4901 Å for F-1.0 at% La–Bi2MoO6. A slight enlargement in the unit cell parameters for F–La–Bi2MoO6 confirms that F and La atoms have been integrated into the Bi2MoO6 structure to respectively substitute partial O and Bi atom positions in [MoO6]6− and [Bi2O2]2+ units (further discussion in the XPS section).21,29
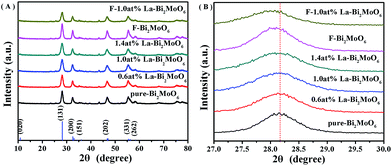 |
| | Fig. 1 (A) XRD patterns of pure Bi2MoO6 and La and F-doped Bi2MoO6; (B) XRD patterns of samples in the 2θ range of 27–30°. | |
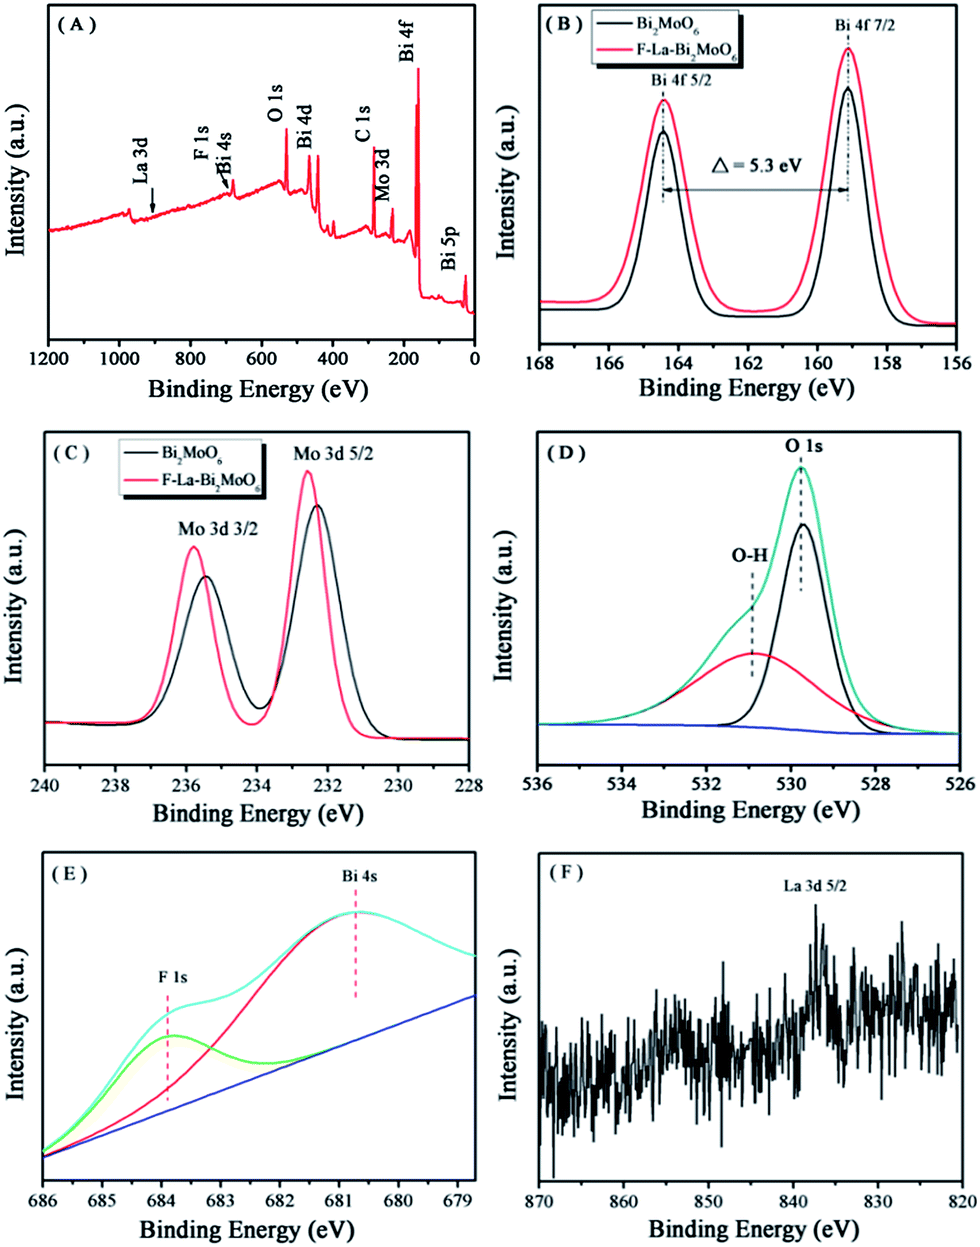
XPS spectra were presented to determine the oxidation state and elemental composition of the samples. Fig. 2A shows the typical survey XPS spectrum of the F-1.0 at% La–Bi2MoO6 sample. As can be seen, the sample contains Bi, Mo, O, La and F elements, which is consistent with the chemical composition of the photocatalysts that we expected to obtain. The C element should be attributed to the adventitious hydrocarbon from the XPS instrument itself.34 The high resolution spectra of Bi 4f, Mo 3d, O 1s, F 1s and La 3d are displayed in Fig. 2B–F. As viewed in Fig. 2B, pure Bi2MoO6 and F-1.0 at% La–Bi2MoO6 exhibit similar characteristic binding energies located at 158.8 and 164.2 eV corresponding to Bi 4f7/2 and Bi 4f5/2,35 indicating that the coordination environment of Bi was not influenced by F substitution.21,36Fig. 2C shows two bands at 232.2 and 235.3 eV, which are ascribed to Mo 3d5/2 and Mo 3d3/2, respectively.37 Compared to Bi2MoO6, the binding energies of the Mo 3d5/2 and Mo 3d3/2 peaks increased by about 0.3 eV. This is caused by the change in the chemical environment of the Mo center in the [MoO6] octahedron unit in which some of the O atoms are substituted by F atoms.21 In addition, compared to pure Bi2MoO6, the unit cell parameter along the b-axis in F-1.0 at% La–Bi2MoO6 was obviously enlarged. Therefore, F atoms only replaced some of the O atoms in the [MoO6] octahedron in Bi2MoO6. The O 1s peaks for F–La–Bi2MoO6 (Fig. 2D) can be fitted into two kinds of chemical states: peaks at 530.9 and 529.9 eV are assigned to hydroxyl groups and lattice oxygen, respectively.38 In addition, as shown in Fig. 2E, a shoulder peak located at 684.0 eV in the XPS spectrum of F-1.0 at% La–Bi2MoO6 should correspond to the fluorine ions in the interstitial crystal lattice.25,39 The XPS spectrum of the La 3d of F–La–Bi2MoO6 is depicted in Fig. 2F. The characteristic peak of the La 3d region is situated at 834.8 eV, which corresponds to the La3+ state,40 and the weak intensity was observed due to the low loading of La. All the results indicated that F and La were successfully co-doped into the crystal lattice of Bi2MoO6 to form F–La–Bi2MoO6.
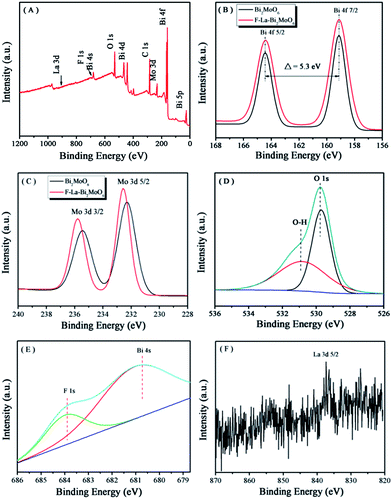 |
| | Fig. 2 XPS spectra of the F-1.0 at% La–Bi2MoO6 sample: (A) survey spectrum, (B) Bi 4f, (C) Mo 3d, (D) O 1s, (E) F 1s and (F) La 3d. | |
3.2 SEM/TEM observation and EDX analysis
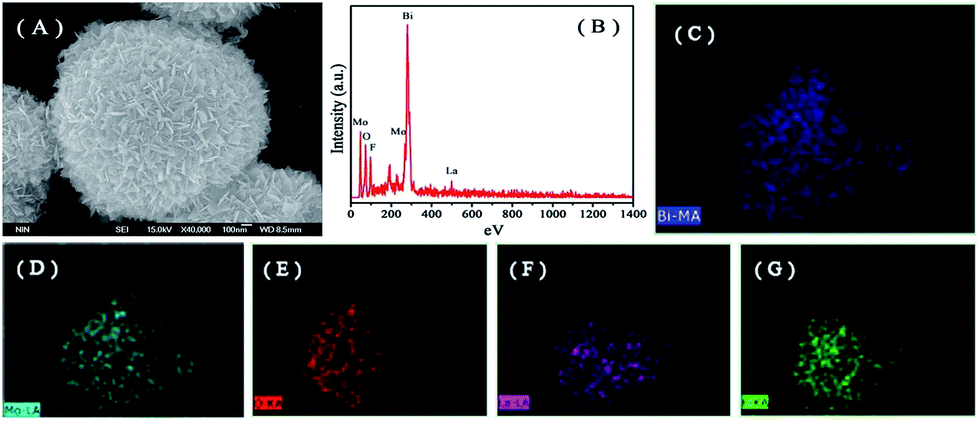
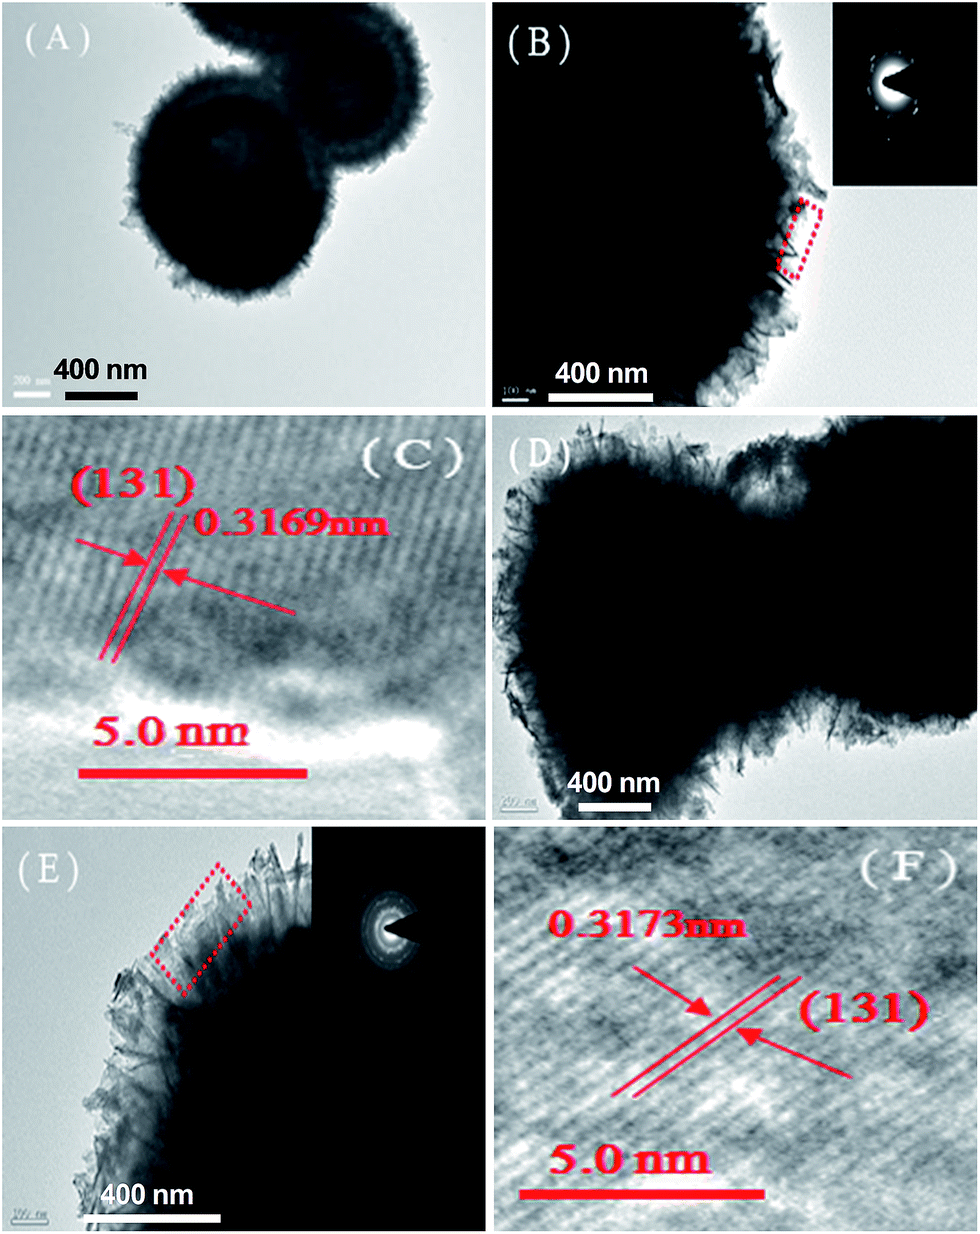
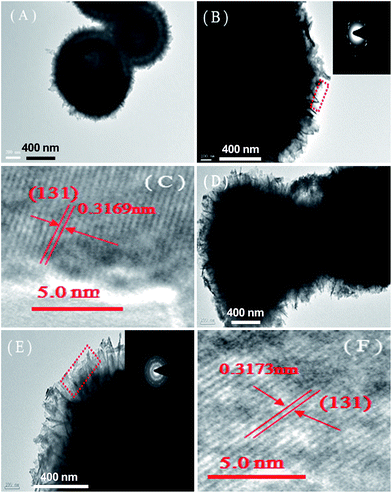
The representative FE-SEM images of the as-prepared samples are shown in Fig. 3. All pure Bi2MoO6, La–Bi2MoO6, F–Bi2MoO6 and F/La–Bi2MoO6 samples exhibited partially hollow or solid three-dimensional (3D) spherical architectures with average diameters of 1–2 μm (Fig. 3A–F), regardless of the doping of F and La. The microspheres were composed of a large amount of nanoplates with thicknesses of 20–50 nm. It is difficult to find differences in their morphology from the FE-SEM images before and after F, La or F/La doping, indirectly implying that F and La atoms probably inserted into the crystal lattice of Bi2MoO6 to substitute O atoms or Bi atoms in the Bi2MoO6. To further identify the presence of La and F in the Bi2MoO6 microspheres, the composition and elemental distribution of a sample of F-1.0 at% La–Bi2MoO6 were monitored using energy dispersive X-ray (EDX) microanalysis as shown in Fig. 4B. The result reveals that Bi, Mo, La, O and F elements were found and the corresponding elemental mapping images of a single sphere shown in Fig. 4C–G clearly exhibit the distribution of individual elements Bi, Mo, O, La and F in the F-1.0 at% La–Bi2MoO6 sample, revealing that La and F are uniformly distributed in the F-1.0 at% La–Bi2MoO6. Moreover, the content of La in the samples was analyzed using EDX spectra and is listed in Table 1. As viewed in Table 1, the La content from the experimental results is highly consistent with the theoretical content, further confirming that F and La atoms successfully partially substituted the crystal lattice O and Bi, respectively, in the Bi2MoO6. Furthermore, for the pure Bi2MoO6 and La, F-co-doped Bi2MoO6, the (HR)TEM images shown in Fig. 5 exhibit that all microspheres are composed of loose nanoplates with a thickness of 10–20 nm (Fig. 5(A, B, D and E)). The corresponding selected area electron diffraction (SAED) patterns (inserts in Fig. 5B and E) clearly reveal the polycrystalline nature of the pure Bi2MoO6 and F/La-co-doped Bi2MoO6 with the same symmetry. The representative HRTEM images (Fig. 5C and F) clearly show that the interplanar spacing of (131) of F/La-co-doped Bi2MoO6 has a slight change compared to that of pure Bi2MoO6, due to the F and La doping. In addition, the specific surface areas of the as-prepared samples are listed in Table 1. For the F and La-doped Bi2MoO6 samples, the surface areas only slightly increased with increasing La doping content, implying that F and La can inhibit Bi2MoO6 nanoplates from interconnecting with each other.
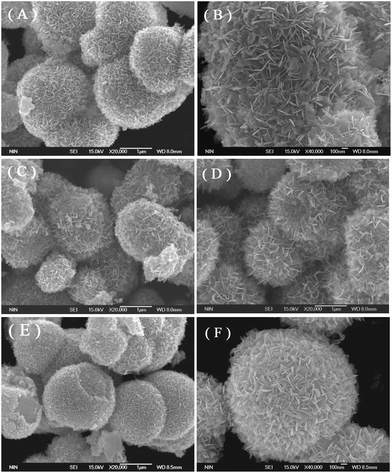 |
| | Fig. 3 FE-SEM images of as-prepared samples: (A and B) pure Bi2MoO6, (C) 1.0 at% La–Bi2MoO6, (D) F–Bi2MoO6, and (E and F) F-1.0 at% La–Bi2MoO6. | |
 |
| | Fig. 4 SEM image, EDX spectra and the elemental mapping images of F-1.0 at% La–Bi2MoO6. (A) SEM image of an individual Bi2MoO6 microsphere, (B) EDX spectrum of sample F-1.0 at% La–Bi2MoO6 and the element mapping of (C) Bi, (D) Mo, (E) O, (F) La and (G) F elements. | |
Table 1 BET specific surface area and La element content in samples by EDX microanalysis compared to the original chemical used
| Samples |
La element content (at%) |
S
BET (m2 g−1) |
| Theoretical |
Experimental |
| Pure-Bi2MoO6 |
— |
— |
51.26 |
| 0.6 at% La–Bi2MoO6 |
0.6% |
0.58% |
52.53 |
| 1.0 at% La–Bi2MoO6 |
1.0% |
0.99% |
52.89 |
| 1.4 at% La–Bi2MoO6 |
1.4% |
1.37% |
53.55 |
| F-1.0 at% La–Bi2MoO6 |
1.0% |
0.98% |
53.68 |
 |
| | Fig. 5 (HR)TEM images of samples: (A–C) pure Bi2MoO6; (D–F) F-1.0 at% La–Bi2MoO6. The inserts in (B) and (E) are SAED patterns for the pure Bi2MoO6 and F-1.0 at% La–Bi2MoO6, respectively. | |
3.3 Optical properties and photocatalytic activity of Bi2MoO6-based materials
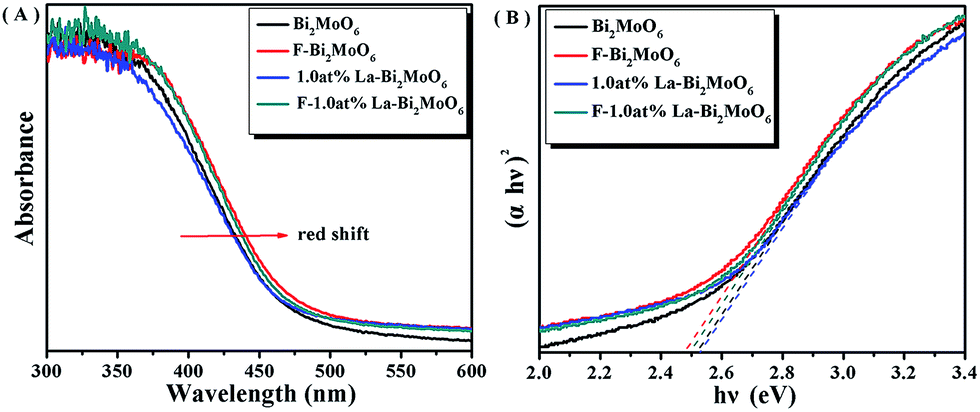
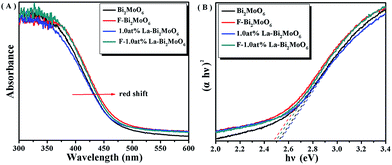
The band gap of Bi2MoO6 can be calculated by the formula,41 (αhν) = A(hν − Eg)n/2, where α, h, ν, A and Eg represent absorption coefficient, Planck constant, light frequency, a constant and band gap energy, respectively. Note that herein n is determined by the type of optical transition of the semiconductor (n = 1 for direct transition and n = 4 for indirect transition).42 For the Bi2MoO6 semiconductor, n = 1. The UV-Vis-DRS of pure Bi2MoO6, 1.0 at% La–Bi2MoO6, F–Bi2MoO6, and F-1.0 at% La–Bi2MoO6 are shown in Fig. 6A, demonstrating that the doping of La3+ did not exhibit any significant effect and the doping of F resulted in the occurrence of an obvious red-shift of the absorption edge which was caused by electron excitation from the valence band to the unoccupied gap states. This phenomenon is similar to that of F-doped ZnMoO4.39 The direct band gaps of pure Bi2MoO6, 1.0 at% La–Bi2MoO6, F–Bi2MoO6, and F-1.0 at% La–Bi2MoO6 can be obtained from the chart of absorption (αhν)2versus energy (hν) (Fig. 6B). The band gap values of the pure Bi2MoO6, 1.0 at% La–Bi2MoO6, F–Bi2MoO6, and F-1.0 at% La–Bi2MoO6 are estimated to be 2.52, 2.53, 2.48 and 2.50 eV, respectively, revealing that F–Bi2MoO6 and F-1.0 at% La–Bi2MoO6 are beneficial for the utilization of visible-light energy.
 |
| | Fig. 6 (A) UV-Vis-DRS spectra and (B) the plot of (αhν)2versus energy (hν) for the band gap energy of Bi2MoO6, 1.0 at% La–Bi2MoO6, F–Bi2MoO6, and F-1.0 at% La–Bi2MoO6. | |
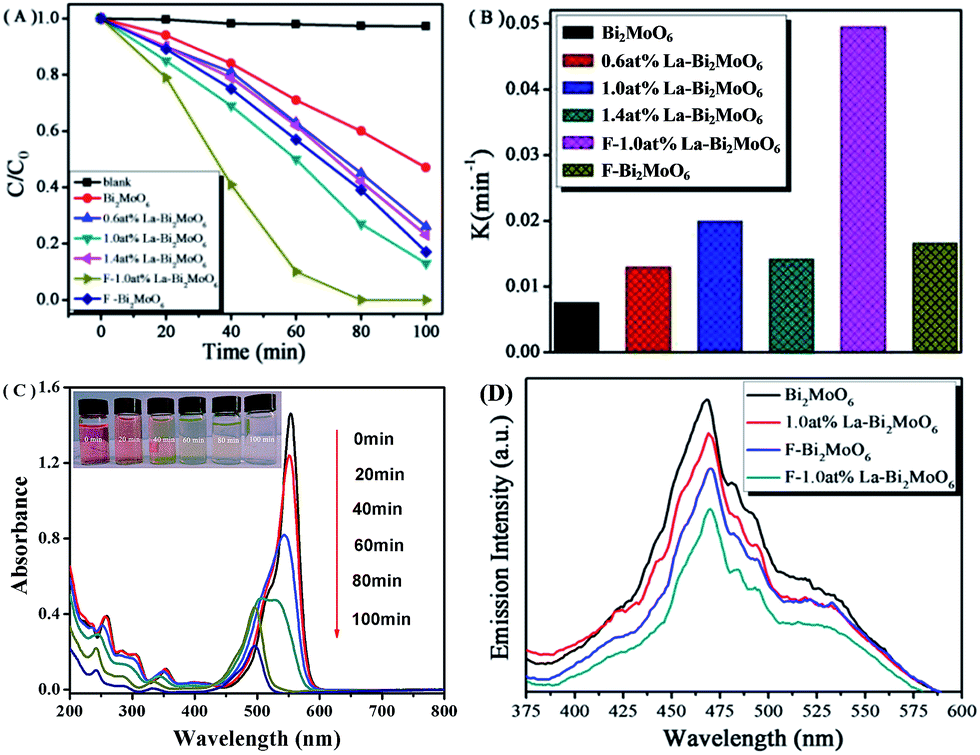
The visible light activities of the synthesized samples were evaluated by measuring the degradation of RhB. As shown in Fig. 7A, the degradation of RhB was negligible in a blank experiment. However, when F or La modified Bi2MoO6 were used as photocatalysts, the photodegradation rate was markedly improved, and nearly 100% degradation of RhB could be completed within 80 min. The ordering of photocatalytic activity is F-1.0 at% La–Bi2MoO6 > 1.0 at% La–Bi2MoO6 > F–Bi2MoO6 > 1.4 at% La–Bi2MoO6 > 0.6 at% La–Bi2MoO6 > Bi2MoO6. For the La-doped Bi2MoO6 series, it is obvious that the photocatalytic activity of 1.0 at% La–Bi2MoO6 is higher than that of the two others. Moreover the F/La-co-doped Bi2MoO6 shows the highest photocatalytic performance. According to the first order kinetics model43,44 and the fitted plots of ln(C0/C) versus reaction time t (not shown), a pseudo-first-order reaction for the photodegradation of RhB was found that is based on the equation ln(C0/C) = kappt, where kapp is the apparent rate constant (min−1), C0 and C are the initial concentration (mol L−1) and the instantaneous concentration of RhB, and the kapp constants are 7.56 × 10⁻³, 1.295 × 10⁻², 1.411 × 10⁻², 1.659 × 10⁻², 1.995 × 10⁻², and 4.945 × 10⁻² min−1 for pure Bi2MoO6, 0.6 at% La–Bi2MoO6, 1.4 at% La–Bi2MoO6, F–Bi2MoO6, 1.0 at% La–Bi2MoO6, and F-1.0 at% La–Bi2MoO6, respectively, as shown in Fig. 7B. The results demonstrated that the photocatalytic activity of F-1.0 at% La–Bi2MoO6 is much higher than that of pure Bi2MoO6, clearly revealing the synergistic effect of F and La co-dopants.
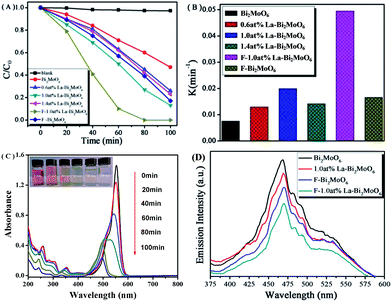 |
| | Fig. 7 (A) Photocatalytic degradation curves of RhB under visible light irradiation; (B) apparent rate constants (kapp) for the photodegradation of RhB over pure Bi2MoO6, La or F-doped Bi2MoO6, and F/La-codoped Bi2MoO6; (C) temporal absorption spectral patterns of RhB during the photodegradation over F-1.0 at% La–Bi2MoO6; (D) the PL spectra of pure Bi2MoO6 and F or (and) La-doped Bi2MoO6. | |
As a monitoring, Fig. 7C clearly shows the change in color and concentration of photodegraded RhB solution with increasing reaction time in the presence of photocatalyst F-1.0 at% La–Bi2MoO6 under visible light irradiation. The main absorption peak of RhB gradually shifted from 553 to 498 nm, indicating the stepwise formation of a series of N-deethylated intermediates.45,46 This process is in good agreement with the destruction of the conjugated structure and N-demethylation of the RhB dye35 which reflects the color of the RhB solution quickly changing from bright red to colorless under visible-light illumination.
3.4 Mechanism of enhanced photocatalytic activity
Owing to the PL emission results from the recombination of photogenerated electron–hole pairs,47 the low PL intensity implies a low recombination rate of charge carriers.48 For pure Bi2MoO6, F- or La-doped and F/La-co-doped Bi2MoO6 photocatalysts, their PL spectra are shown in Fig. 7D. When the excitation wavelength was 400 nm, the PL spectrum of the as-prepared Bi2MoO6 revealed that four peaks appeared at 423, 460, 475 and 535 nm. The strongest blue emission peak at ca. 470 nm is attributed to the intrinsic luminescence of Bi2MoO6, which originates from the photoinduced electron transfer transitions between the hybrid of Bi 6s and O 2p (VB) to the empty Mo 5d orbital (CB) in the MoO62− complex.49 The blue emission peak centered at 425 nm is attributed to the intrinsic transition of Bi3+ ions from the 3P1 (6s6p) excited state to the 1S0 (6S2) ground state.50 The emission peak at 535 nm (green) is attributed to the defects of metal atoms and oxygen vacancies during the crystal growth process,51 which become defect centers and thus affect the optical properties of Bi2MoO6. It can be observed that with the (co)doping of La or (and) F atoms into the Bi2MoO6 phase, the intensity of the PL spectra obtained is obviously lower than that of pure Bi2MoO6, indicating that the recombination of photogenerated charge carriers is significantly inhibited by F and La dopants. The lower recombination of charge carriers suggested a higher photocatalytic activity, which is in good agreement with the result of the RhB photodegradation experiments.
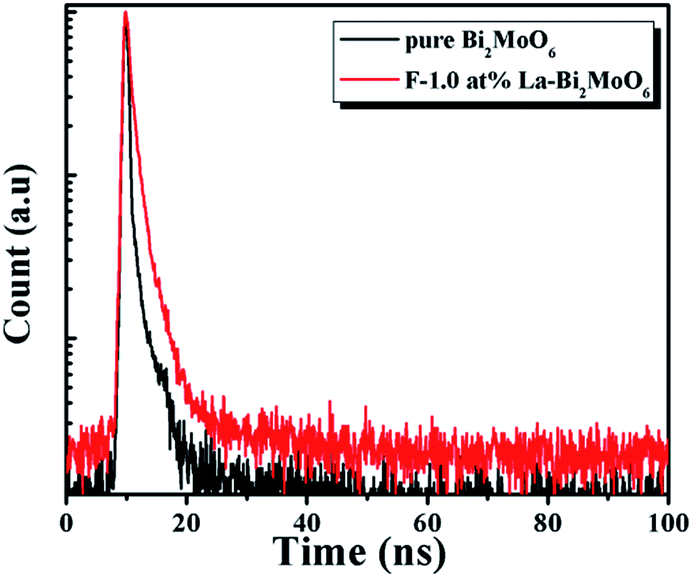
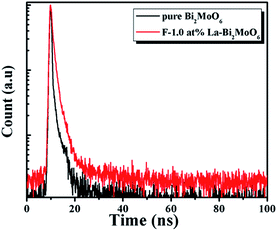
To further understand the recombination process in the samples, the recombination kinetics of the photoinduced charge carriers in Bi2MoO6 and F-1.0 at% La–Bi2MoO6 was monitored using time-resolved fluorescence spectroscopy. The fluorescence intensity at 460 nm was monitored upon excitation at 400 nm and the decay spectra are shown in Fig. 8. Multi-exponential decays are observed from the curvatures of the plots. These spectra fit well with the triple-exponential decay models, with χ2 values close to 1.0 (Table 2). Their lifetimes and intensities are also listed in Table 2. The three lifetimes τ1, τ2 and τ3 of F-1.0 at% La–Bi2MoO6 are 0.34, 1.84 and 10.11 ns, with intensities of ∼56.60, ∼39.37% and 4.03% of the total fluorescence intensity, respectively (Table 2). The prolonged lifetime originates from the F and La doping, which effectively reduces the recombination of photogenerated electrons and holes.
 |
| | Fig. 8 Time-resolved fluorescence decay spectra of Bi2MoO6 and F-1.0 at% La–Bi2MoO6, monitored at 460 nm using time-correlated single-photon counting, with an excitation wavelength of 405 nm. | |
Table 2 Lifetimes (τ1, τ2 and τ3) and relative intensities for pure Bi2MoO6 and F-1.0 at% La–Bi2MoO6
| Samples |
τ
1 (ns)/Int. (%) |
τ
2 (ns)/Int. (%) |
τ
3 (ns)/Int. (%) |
χ
2
|
| Bi2MoO6 |
0.12/85.73 |
1.45/12.20 |
8.43/2.07 |
1.228 |
| F-1.0 at% La–Bi2MoO6 |
0.34/56.60 |
1.84/39.37 |
10.11/4.03 |
1.112 |
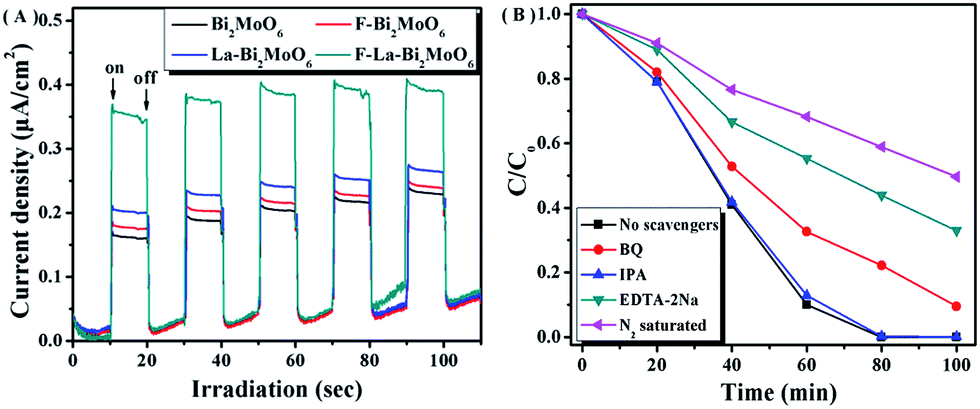
Additionally, the lower intensity of the PL spectra indirectly reflects the high separation efficiency of photogenerated electrons and holes that can be further corroborated by employing photocurrent measurements.52 The higher photocurrent density means a longer lifetime of the photogenerated charge carriers and a higher photocatalytic activity.47 In our study, I–t curves with five on–off cycles of intermittent irradiation for pure Bi2MoO6 and F-1.0 at% La–Bi2MoO6 are shown in Fig. 9A. The results reveal that the F-1.0 at% La–Bi2MoO6 had a higher transient photocurrent density compared to that of the pure Bi2MoO6, indicating that the lifetime of the photogenerated carriers is significantly enhanced. Obviously, the investigation on photocurrent is in accordance with the results of the PL spectra and time-resolved fluorescence spectroscopy.
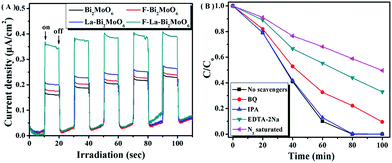 |
| | Fig. 9 (A) Comparison of transient photocurrent responses of Bi2MoO6 and F-1.0 at% La–Bi2MoO6 under visible light irradiation; (B) photodegradation of RhB over F-1.0 at% La–Bi2MoO6 in the presence of different scavengers. | |
To further confirm the possible reaction mechanism for the photodegradation of RhB over F–La–Bi2MoO6, we performed a series of controlled experiments under visible irradiation, as shown in Fig. 9B. The reaction performed under nitrogen atmosphere showed a lower degradation of RhB, implying that molecular oxygen acted in a crucial role in the reaction.
In addition, the determination of the major active species in photocatalysis can be carried out via radical and hole trapping experiments to characterize the roles of free radicals in the reaction.53–55 As a characteristic reagent for determining hydroxyl radicals (·OH), the addition of isopropanol (IPA) in the reaction system did not show any significant change or any obvious effect on the degradation of RhB, confirming that hydroxyl radicals were not the main active species. However, when benzoquinone (BQ) was added, the degradation efficiency of RhB markedly decreased, implying that superoxide radicals (·O2−) were one of the main active species for the degradation of RhB. When ethylenediaminetetraacetic acid disodium salt (EDTA-2Na) was added to the reaction system, the degradation of RhB was significantly suppressed, suggesting that ·O2− and photogenerated holes (h+) served as the main active species and manipulated the photodegradation of RhB in the presence of photocatalyst F–La–Bi2MoO6. Based on the above-mentioned results, we postulate that ·O2− and h+ were generated in the reaction system to act as the main active species for the RhB degradation in the presence of the photocatalyst under visible light irradiation, and the main degradation processes of RhB are as follows:
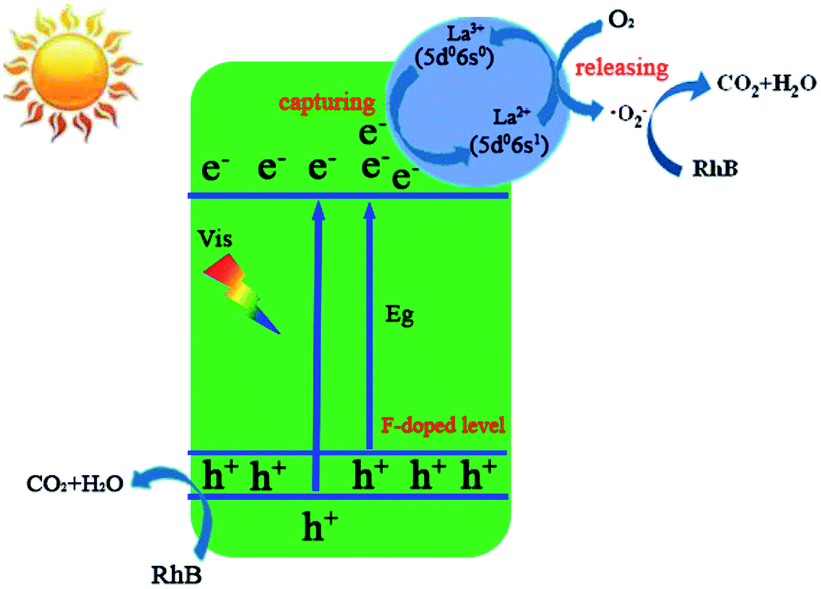
| | | F–La–Bi2MoO6 + hν (visible light) → F–La–Bi2MoO6 (e− + h+) | (1) |
| | | La3+ (5d0 6s0) + e− → La2+ (5d0 6s1) | (2) |
| | | O2 + La2+ (5d0 6s1) → ·O2− + La3+ (5d0 6s0) | (3) |
| | | RhB + ·O2−/h+ → CO2 + H2O + … | (4) |
Based on the observed effects of scavengers, a possible photocatalytic mechanism for the enhanced photocatalytic activity of F–La–Bi2MoO6 was proposed via the synergistic effect of La and F co-doping, as shown in Fig. 10. We think, on the one hand, the F doping results in a red-shift in the absorption edge, indicating that new energy levels consisting of the F 2p and O 2p states were formed on top of the valence band of the F-doped Bi2MoO6,27 and on the other hand, the F doping may act as an n-type impurity in the Bi2MoO6 substrate to increase electron density and thus improve the photocurrent density of the doped Bi2MoO6 under visible light irradiation. As a result, the F-doped Bi2MoO6 exhibits an enhanced photocatalytic activity. The integration of La3+ into Bi2MoO6 substituted Bi3+ ions to produce many defects that would lead to capture of free electrons in the Bi2MoO6 by the La3+ ions at the defects. These captured electrons could quickly transfer to the oxygen molecules adsorbed on the surface of the F–La–Bi2MoO6 catalyst and perform the conversion of O2 to ·O2−, and hence enable La2+ ions to return to the original stable full-empty d orbital and the outermost 8-electronic structure La3+ (5s25p65d06s0). In this process, La3+ ions capture electrons to convert into La2+ ions with a 5s25p65d06s1 electronic configuration and La2+ ions rapidly release electrons to the adsorbed O2 around the defects. As a result, the very unstable La2+ ions formed only act as a mediator for the release of electrons. This explanation is in good agreement with the previously discussed Gd-doped Bi2MoO6 photocatalyst with a stable Gd3+ ion with a half-filled electronic structure.56 Hence the doped La3+ ions act in a key role to capture and transfer/release the photogenerated electrons for conversion from O2 to ·O2− and thereby delay the recombination of the photogenerated electrons and holes, which indirectly promotes the separation of photogenerated electrons and holes. Both active species, hole (h+) and superoxide radical (·O2−), are greatly beneficial for the degradation of RhB. This hypothetical mechanism is in accordance with the result of the active species trapping experiments and the PL spectra.
 |
| | Fig. 10 Schematic diagram of the photodegradation of RhB over F-1.0 at% La–Bi2MoO6 under visible light irradiation. | |
Therefore, based on the above-mentioned results, the F-/La-co-doped Bi2MoO6 exhibited a highly efficient photocatalytic performance for the degradation of RhB compared to single F- or La-doped Bi2MoO6, which is associated with the efficient separation of the photogenerated electrons (e−) and holes (h+) caused by F-inhibited and La-captured/released electrons, which delayed the recombination of electrons and holes. In addition, the formation of very unstable mediate La2+ ions promoted the conversion of adsorbed O2 into active superoxide radicals ·O2−. The synergistic effect of both F and La on Bi2MoO6 markedly enhanced the photocatalytic activity of the F/La/Bi2MoO6 catalyst for the photodegradation of RhB.
4 Conclusions
In summary, a novel visible light responsive F–La–Bi2MoO6 photocatalyst has been successfully synthesized via a facile solvothermal method for the first time. The SEM and TEM analyses confirmed that F–La–Bi2MoO6 architectures consisted of numerous nanoplates with a thickness of 20–50 nm. The co-doping of La and F into Bi2MoO6 broadened the absorption in the visible-light region due to new energy levels on top of the valence band of F–La–Bi2MoO6 compared to that of pure Bi2MoO6. The F–La–Bi2MoO6-catalyzed RhB photodegradation indicated a highly catalytic performance compared to F-doped or La-doped Bi2MoO6 and pure Bi2MoO6 catalysts, revealing the synergistic effect of F and La, in which F doping led to the increase of absorptivity of F–Bi2MoO6 and acted as an n-type impurity to supply a hole carrier, and the doped La3+ ions act in a key role to capture and transfer/release the photogenerated electrons for conversion from O2 to ·O2− to delay the recombination of the photogenerated electrons and holes. The active species trapping experiments indicated that h+ and ·O2− were responsible for the photodegradation of RhB over F–La–Bi2MoO6. Furthermore, the photocatalytic mechanism was rationally proposed to explain the enhancement of the photocatalytic performance of the F–La–Bi2MoO6 photocatalyst. The synergistic effect of F and La effectively improves the separation and transfer efficiency of photogenerated charge carriers and simultaneously represses the recombination of h+ and e−, and thus results in significant enhancement of the photocatalytic activity for the degradation of RhB. The present work provides a better insight into the synergistic effect of La and F co-dopants. The co-doping strategy of rare earth and nonmetal elements may be a simple method for improving the photocatalytic activity of Bi2MoO6-based photocatalysts and application in other photocatalytic systems.
Acknowledgements
This work was supported by the National Natural Science Foundation of China (No. 21373159) and the Project of Science & Technology Office of Shaanxi Province (No. 2015SF291, 2013K11-08, 2013SZS20-P01) and the Natural Science Program of the Education Department of Shaanxi Province (No. 15JS119).
References
- R. Asahi, T. Morikawa, T. Ohwaki, K. Aoki and Y. Taga, Science, 2001, 293, 269–271 CrossRef CAS PubMed.
- X. B. Chen and C. Burda, J. Am. Chem. Soc., 2008, 130, 5018–5019 CrossRef CAS PubMed.
- J. J. Hill, N. Banks, K. Haller, M. E. Orazem and K. J. Ziegler, J. Am. Chem. Soc., 2011, 133, 18663–18672 CrossRef CAS PubMed.
- Y. Park, S. H. Lee, S. O. Kang and W. Choi, Chem. Commun., 2010, 46, 2477–2479 RSC.
- R. Zhou, Q. Zhang, E. Uchaker, J. Lan, M. Yin and G. Cao, J. Mater. Chem. A, 2014, 2, 2517–2525 CAS.
- S. N. R. Inturi, T. Boningari, M. Suidan and P. G. Smirniotis, Appl. Catal., B, 2014, 144, 333–342 CrossRef CAS.
- W. W. Fu, S. Ding, Y. Wang, L. L. Wu, D. M. Zhang, Z. W. Pan, R. W. Wang, Z. T. Zhang and S. L. Qiu, Dalton Trans., 2014, 43, 16160–16163 RSC.
- H. P. Li, Q. H. Deng, J. Y. Liu, W. G. Hou, N. Du, R. J. Zhang and X. T. Tao, Catal. Sci. Technol., 2014, 4, 1028–1037 CAS.
- B. Frit and J. P. Mercorio, J. Alloys Compd., 1992, 188, 27–35 CrossRef CAS.
- Y. Shimodaira, H. Kato, H. Kobayashi and A. Kudo, J. Phys. Chem. B, 2006, 110, 17790–17797 CrossRef CAS PubMed.
- X. Zhao, J. Qu, H. Liu and C. Hu, Environ. Sci. Technol., 2007, 41, 6802–6807 CrossRef CAS PubMed.
- G. Tian, Y. Chen, W. Zhou, K. Pan, Y. Dong, C. Tian and H. Fu, J. Mater. Chem., 2011, 21, 887–892 RSC.
- M. Shang, W. Wang, J. Ren, S. Sun and L. Zhang, Nanoscale, 2011, 3, 1474–1476 RSC.
- L. J. Xie, J. F. Ma and G. J. Xu, Mater. Chem. Phys., 2008, 110, 197–200 CrossRef CAS.
- W. Z. Yin, W. Z. Wang and S. M. Sun, Catal. Commun., 2010, 11, 647–650 CrossRef CAS.
- R. M. Mohamed and F. M. Ibrahim, J. Ind. Eng. Chem., 2015, 22, 28–33 CrossRef CAS.
- M. Y. Zhang, C. L. Shao, J. B. Mu, Z. Y. Zhang, Z. C. Guo, P. Zhang and Y. C. Liu, CrystEngComm, 2012, 14, 605–612 RSC.
- T. Yan, Q. Yan, X. D. Wang, H. Y. Liu, M. M. Li, S. X. Lu, W. G. Xu and M. Sun, Dalton Trans., 2015, 44, 1601–1611 RSC.
- N. Y. Fan, Y. J. Chen, Q. M. Feng, C. Wang, K. Pan, W. Zhou, Y. Li, H. G. Hou and G. F. Wang, J. Mater. Res., 2012, 27, 1471–1475 CrossRef CAS.
- H. G. Yu, Z. F. Zhu, J. H. Zhou, J. Wang, J. Q. Li and Y. L. Zhang, Appl. Surf. Sci., 2013, 265, 424–430 CrossRef CAS.
- H. W. Huang, K. Liu, K. Chen, Y. L. Zhang, Y. H. Zhang and S. C. Wang, J. Phys. Chem. C, 2014, 118, 14379–14387 CAS.
- A. A. Alemi, R. Kashfi and B. Shabani, J. Mol. Catal. A: Chem., 2014, 392, 290–298 CrossRef CAS.
- S. Liu, J. Yu, B. Cheng and M. Jaroniec, Adv. Colloid Interface Sci., 2012, 173, 35–53 CrossRef CAS PubMed.
- W. Q. Fang, Z. Y. Huo, P. R. Liu, X. L. Wang, M. Zhang, Y. Jia, H. M. Zhang, H. J. Zhao, H. G. Yang and X. D. Yao, Chem.–Eur. J., 2014, 20, 11439–11444 CrossRef CAS PubMed.
- M. V. Dozzi, C. D'Andrea, B. Ohtani, G. Valentini and E. Selli, J. Phys. Chem. C, 2013, 117, 25586–25595 CAS.
- K. L. Lv, B. Cheng, J. G. Yu and G. Liu, Phys. Chem. Chem. Phys., 2012, 14, 5349–5362 RSC.
- H. Y. Jiang, J. J. Liu, K. Cheng, W. B. Sun and J. Lin, J. Phys. Chem. C, 2013, 117, 20029–20036 CAS.
- Y. F. Liu, Y. H. Lv, Y. Y. Zhu, D. Liu, R. L. Zong and Y. F. Zhu, Appl. Catal., B, 2014, 147, 851–857 CrossRef CAS.
- R. Shi, G. L. Huang, J. Lin and Y. F. Zhu, J. Phys. Chem. C, 2009, 113, 19633–19638 CAS.
- L. S. Silva, L. C. B. Lima, F. C. Silva, J. M. E. Matos, M. R. M. C. Santos, L. S. S. Júnior, K. S. Sousa and E. C. S. Filho, Chem. Eng. J., 2013, 218, 89–98 CrossRef CAS.
- W. Wilson, A. Manivannan and V. R. Subramanian, Appl. Catal., A, 2012, 441–442, 1–9 CrossRef CAS.
- Y. R. Zhang, S. Q. Wang, S. L. Shen and B. X. Zhao, Chem. Eng. J., 2013, 233, 258–264 CrossRef CAS.
- T. Soltani and M. H. Entezari, Chem. Eng. J., 2013, 223, 145–154 CrossRef CAS.
- Q. Yan, M. Sun, T. Yan, M. M. Li, L. G. Yan, D. Wei and B. Du, RSC Adv., 2015, 5, 17245–17252 RSC.
- Y. S. Xu and W. D. Zhang, Dalton Trans., 2013, 42, 1094–1101 RSC.
- H. Liu, W. R. Cao, Y. Su, Y. Wang and X. H. Wang, Appl. Catal., B, 2012, 111–112, 271–279 CrossRef CAS.
- M. Y. Zhang, C. L. Shao, J. B. Mu, X. M. Huang, Z. Y. Zhang, Z. C. Guo, P. Zhang and Y. C. Liu, J. Mater. Chem., 2012, 22, 577–584 RSC.
- S. Guo, X. F. Li, H. Q. Wang, F. Dong and Z. B. Wu, J. Colloid Interface Sci., 2012, 369, 373–380 CrossRef CAS PubMed.
- S. H. Chen, S. X. Sun, H. G. Sun, W. L. Fan, X. Zhao and X. Sun, J. Phys. Chem. C, 2010, 114, 7680–7688 CAS.
- M. S. J. Marshall, D. T. Newell, D. J. Payne, R. G. Egdell and M. R. Castell, Phys. Rev. B, 2011, 83, 035410 CrossRef.
- J. Cao, B. Y. Xu, H. L. Lin, B. D. Luo and S. F. Chen, Dalton Trans., 2012, 41, 11482–11490 RSC.
- W. Q. Cui, W. J. An, L. Liu, J. S. Hu and Y. H. Liang, J. Hazard. Mater., 2014, 280, 417–427 CrossRef CAS PubMed.
- Y. He, Y. H. Zhang, H. W. Huang, N. Tian and Y. Luo, Inorg. Chem. Commun., 2014, 40, 55–58 CrossRef CAS.
- H. W. Huang, Y. He, Z. S. Lin, L. Kang and Y. H. Zhang, J. Phys. Chem. C, 2013, 117, 22986–22994 CAS.
- G. L. Huang and Y. F. Zhu, J. Phys. Chem. C, 2007, 111, 11952–11958 CAS.
- P. Dumrongrojthanath, T. Thongtem, A. Phuruangrat and S. Thongtem, Superlattices Microstruct., 2013, 54, 71–77 CrossRef CAS.
- Q. J. Xiang, J. G. Yu and M. Jaroniec, J. Phys. Chem. C, 2011, 115, 7355–7363 CAS.
- H. W. Huang, S. B. Wang, N. Tian and Y. H. Zhang, RSC Adv., 2014, 4, 5561–5567 RSC.
- Q. Xiao, J. Zhang, C. Xiao and T. K. Tan, Catal. Commun., 2008, 9, 1247–1253 CrossRef CAS.
- S. F. Wang, F. Gu, M. K. Lu, W. G. Zou, S. W. Liu, D. Xu, D. R. Yuan and G. J. Zhou, J. Phys. Chem. Solids, 2004, 65, 1243–1245 CrossRef CAS.
- P. F. Smet, J. Van Gheluwe, D. Poelman and R. L. Van Meirhaeghe, J. Lumin., 2003, 104, 145–150 CrossRef CAS.
- H. Xu, J. Yan, Y. G. Xu, Y. H. Song, H. M. Li, J. X. Xia, C. J. Huang and H. L. Wan, Appl. Catal., B, 2013, 129, 182–193 CrossRef CAS.
- C. Hu, T. W. Peng, X. X. Hu, Y. L. Nie, X. F. Zhou, J. H. Qu and H. He, J. Am. Chem. Soc., 2010, 132, 857–862 CrossRef CAS PubMed.
- M. C. Yin, Z. S. Li, J. H. Kou and Z. G. Zou, Environ. Sci. Technol., 2009, 43, 8361–8366 CrossRef CAS PubMed.
- X. X. Yao and X. H. Liu, J. Hazard. Mater., 2014, 280, 260–268 CrossRef CAS PubMed.
- N. Tian, Y. H. Zhang, H. W. Huang, Y. He and Y. X. Guo, J. Phys. Chem. C, 2014, 118, 15640–15648 CAS.
Footnote |
| † These authors contributed equally to this work. |
|
| This journal is © The Royal Society of Chemistry 2016 |
Click here to see how this site uses Cookies. View our privacy policy here. 
 Open Access Article
 This Open Access Article is licensed under a Creative Commons Attribution-Non Commercial 3.0 Unported Licence