A mesoporous fluorescent sensor based on ZnO nanorods for the fluorescent detection and selective recognition of tetracycline
Zhiping Zhou*a,
Kai Lua,
Xiao Weib,
Tongfan Haoa,
Yeqing Xuc,
Xiaodong Lvd and
Yufeng Zhanga
aSchool of Material Science and Engineering, Jiangsu University, Zhenjiang 212013, China. E-mail: zhouzp@ujs.edu.cn; Tel: +86 0511 88791919
bKey Laboratory of Subsurface Hydrology and Ecological Effects in Arid Region, Ministry of Education, Chang'an University, 710054, P. R. China
cSchool of Chemistry and Chemical Engineering, Jiangsu University, Zhenjiang 212013, China
dSchool of School of Mechanical Engineering, Jiangsu University, Zhenjiang 212013, China
First published on 15th July 2016
Abstract
Due to tetracycline (TC) being harmful to the environment and animals, versatile fluorescent sensors have been developed and applied for the specific recognition and determination of TC. In the present paper, a mesoporous fluorescent sensor was successfully prepared by using TC as the template, cetyl trimethyl ammonium bromide (CTAB) as the porogen, and ZnO nanorods (NRs) as the core substrate material and optical material. The synthesized composite materials were characterized by transmission electron microscopy (TEM) and X-ray diffraction (XRD). Fluorescent measurements of the target TC were then measured by a spectrofluorometer. Under optimal conditions, the linear range and correlation coefficient of the mesoporous MIPs-ZnO NRs were 2.0–120 μmol L−1 and 0.9993, respectively, and the imprinting factor (IF) was up to 3.50. Moreover, in order to further investigate the effect of the mesoporous structure, a fluorescent sensor without a mesoporous structure was synthesized as a comparison and measured by the same processes. Through analysis of the data, it was found that the mesoporous fluorescent sensor showed a lower response time, higher utilization, and higher selective recognition and sensitive determination than the non-mesoporous fluorescent sensor. This study provides a novel strategy to fabricate mesoporous-imprinted polymer layer-coated ZnO NRs with excellent fluorescent performance for TC.
1 Introduction
Tetracycline (TC) is a kind of broad-spectrum antibacterial agent, with sterilizing capabilities at high concentration. Due to its low cost and broad antibacterial spectrum, TC has been widely used in aquaculture and veterinary medicines to promote rapid growth of the animal.1 However, TC in the environment can cause the development of resistant strains that cannot be treated with the presently known drugs.2 Therefore, to develop new effective methods to monitor TC antibiotics is of environmental interest. So far, several analytical techniques and methods, such as glass carbon electrode (GCE),3 high-performance liquid chromatography (HPLC),4 capillary zone electrophoresis (CZE),5 and gas chromatography (GC),6 have been established for the determination of TC. However, these methods demand complicated sample pre-treatment, high cost, and a long analysis time. Most importantly, their selectivity is much lower and they may even cause the production of secondary pollutants. Thus, it is significant to establish a facile, rapid, sensitive, and selective analytical method for the determination of TC.In recent years, fluorescence sensors for the determination of pollution have attracted extensive attention in the scientific community due to their simplicity, multi-function, and easy operation. Most of these fluorescence sensors utilize semiconductor quantum dots (QDs), including CdSe, CdTe, ZnS, and so on, as the high-performance luminescent materials, because of their high quantum yields, good optical stability, narrow emission spectra, broad absorption spectra, and bright photoluminescence.7–10 However, most reports of the QD fluorescence sensors focus on the CdSe and CdTe QDs, with a subsequent heavy metal pollution, resulting in potential fatal damage to humans.11,12 Instead of QDs as the semiconductor material, ZnO has also been utilized due to its wide-band gap, environmental friendliness, high chemical stability, and perfect biological compatibility.13 Nevertheless, achieving the selectivity of the traditional fluorescent sensor is still challenging. To the best of our knowledge, molecularly imprinted polymers (MIPs), introduced as recognition units, have been used to enhance the selectivity of fluorescent detection.14–16
Surface molecularly imprinting technology (SMIT), developed on the basis of traditional molecularly imprinting technology (MIT), has been well established for synthesizing a three-dimensional network polymer layer on the surface of the supporting nanomaterial.17,18 MIP products have a mass of specific recognition sites that are complementary to the template after removing the template molecules.19 Compared with MIPs synthesized by MIT, MIPs synthesized by SMIT show many advantages, such as a higher mass transfer rate, better site accessibility, larger adsorption capacity, and easier removal of the templates.19–21 Due to these outstanding properties, MIPs synthesized by SMIT have been widely applied in scientific and technical fields, such as in separation, chemical sensors, solid-phase extraction, drug delivery, and controlled release.22–25 In particular, MIP-based fluorescent sensors, combining the advantages of the high selectivity of MIPs and the fluorescence property of fluorescent sensors, have received considerable attention for the determination of different substances. For example, Liu's group used YVO4:Eu3+ nanoparticles as the fluorescent material and supporting material to fabricate molecularly imprinting nanomaterial for the detection of λ-cyhalothrin.26 Gao's group used allyl fluorescein as the fluorescent material and spherical SiO2 as the supporting material to fabricate a core–shell molecularly imprinting nanomaterial for the detection of λ-cyhalothrin.27 Our group encapsulated QDs into silicon material as the fluorescent material and the supporting material to prepare core–shell imprinting microspheres for the fluorescent detection of aspirin.28 Generally, these MIP-based fluorescence sensors were prepared by grafting the MIP layer on the surface of the supporting core.29 However, these MIP-based fluorescent sensors need the addition of extra fluorescence material (such as YVO4:Eu3+, CdTe QDs, fluorescein), with a potential serious threat to the environment, or extra supporting nanomaterial (such as spherical SiO2), involving a waste of substance.30 Therefore, ZnO nanorods (NRs) utilized as the fluorescent material and as the supporting material show significant advantages.
Usually, MIP-based fluorescent sensors own not only the remarkable selectivity of MIPs but also the additional functions of other materials such as mesoporous silica.31 Mesoporous silica can make the composite materials possess a large pore volume and nanosized pore wall thickness, in which the recognition sites are located near to the surface.32 Compared with the common MIP-based composite materials, this special mesoporous structure may enhance the properties of MIP-based composite materials, such as the optical properties of the fluorescent material, the mass transfer rate, the adsorption capacity, and the opportunity of binding with the target.33 Due to these excellent properties, mesoporous silica materials are well suited to be utilized in MIP-based fluorescent sensors. However, to the best of our knowledge, there have been few reports based on applying the mesoporous material in the molecularly imprinting fluorescence detection field until now. Therefore, the use of mesoporous silica in MIP-based ZnO NRs would greatly improve the properties of the fluorescent detection and recognition of TC.
In this work, we developed a novel molecularly imprinting fluorescent sensor based on ZnO NRs with a mesoporous structure via a sol–gel process for the fluorescent detection of tetracycline. To fabricate this fluorescent sensor, ZnO NRs were chosen as the optical material and as the solid support; tetracycline (TC) was chosen as the target molecule; 3-aminopropyltriethoxysilane (APTES) was used as a functional monomer; tetraethoxysilane (TEOS) was chosen as the cross-linker; and cetyl trimethyl ammonium bromide (CTAB) was added to form the mesoporous structure. After the removal of TC and CTAB, MIPs-ZnO NRs with a mesoporous structure were obtained. Then, the mesoporous MIPs-ZnO NRs were characterized by transmission electron microscopy (TEM) and X-ray diffraction (XRD). Meanwhile, the fluorescent capacities for the selective recognition and determination of TC based on a radiation-energy-transfer quenching mechanism were investigated. To study the effect of the mesoporous structure in the MIPs-ZnO NRs, a molecularly imprinting fluorescent sensor without the mesoporous structure was also prepared, characterized, and measured. Finally, we made a comparison between the mesoporous MIPs-ZnO NRs and the non-mesoporous MIPs-ZnO NRs by comparing the results of this analysis of the fluorescence properties and summarizing the influence and mechanism of the mesoporous structure in MIPs-ZnO NRs for the selective recognition and determination of TC. As far as we know, this molecularly imprinting fluorescent sensor based on ZnO NRs with a mesoporous structure prepared by a sol–gel process for the selective fluorescent determination of TC has not been reported yet.
2 Experimental
2.1 Reagents and chemicals
All of the chemical reagents used in this work were of analytical grade. Zn(NO3)2·6H2O, sodium dodecyl benzene sulfonate (SDBS), sodium hydroxide (NaOH), and ethanol were received from Sinopharm Chemical Reagent (Shanghai, China). Tetraethoxysilane (TEOS), ammonia solution (NH3·H2O), 3-aminopropyltriethoxysilane (APTES), and cetyl trimethyl ammonium bromide (CTAB) were obtained from Aladdin Reagent (Shanghai, China). Tetracycline (TC), oxytetracycline (OTC), doxycycline (DC), and chlortetracycline (CTC) was obtained from TCI (Shanghai) Development Co. Ltd. (China). Double distilled water (DDW) was used throughout the experimental procedures.2.2 Instrument
Transmission electron microscopy (TEM) images of the prepared samples were recorded by a JEM-2100 (HR) electron microscope. X-ray diffraction (XRD) spectra were collected on a XRD-6100 Lab X-ray diffractometer (Shimadzu, Japan) with a sweep speed of 7° min−1 and Cu Kα radiation over the 2θ range of 10–80°. Fluorescence spectra were collected by a Cary Eclipse fluorescence spectrometer (USA).2.3 Synthesis of ZnO NRs
ZnO NRs were synthesized based on the reported method with necessary modification.34 In brief, 1.19 g of Zn(NO3)2·6H2O, 1.39 g of SDBS, and 4.0 g of NaOH were added into 40 mL of ethanol in turn and the mixture was vigorously stirred for 25 min. Then, the mixture was transferred into a 50 mL poly(tetrafluoroethylene) (Teflon)-lined autoclave. Afterwards, the solution was heated at 100 °C for 10 h. When the temperature of the autoclave was down to room temperature, the products were gathered by centrifugation and washed with ethanol and DDW several times to remove the unreacted reactants. Finally, the obtained ZnO NRs were dried in vacuum at 40 °C for 24 h.2.4 Molecular imprinting of TC at the surface of the ZnO NRs via a sol–gel process
The MIPs-based ZnO NRs with a mesoporous structure were synthesized by coating the imprinted polymer layer on the surface of ZnO NRs via a sol–gel process. In a typical synthesis, ZnO NRs were added into a 25 mL round-bottomed flask with a certain amount of DDW. Then, the flask was kept under ultrasonication for 10 min in order to ensure the ZnO NRs were completely dispersed in DDW. Afterwards, TC, CTAB (0.2 M), and NaOH (0.2 M) were added into the mixture and kept under persistent stirring at the speed of 800 rpm at room temperature. After 30 min, ethanol with TEOS and APTES were injected into the solution and it was kept under persistent stirring for another 24 h. As a comparison, MIP-based ZnO NRs without a mesoporous structure were synthesized by the same process without the porogen (CTAB). The amounts of chemical reagents added are shown in Table 1. These products were gathered by high-speed centrifugation (10![[thin space (1/6-em)]](https://www.rsc.org/images/entities/char_2009.gif) 000 rpm, 4.0 min) and alternately washed with hot water several times to remove the CTAB and template molecules (TC). Finally, the resulting MIP-particles were collected by drying in vacuum at 40 °C for further fluorescent measurement.
000 rpm, 4.0 min) and alternately washed with hot water several times to remove the CTAB and template molecules (TC). Finally, the resulting MIP-particles were collected by drying in vacuum at 40 °C for further fluorescent measurement.
| Mesoporous structure | Non-mesoporous structure | |||
|---|---|---|---|---|
| MIPs-ZnO NRs | NIPs-ZnO NRs | MIPs-ZnO NRs | NIPs-ZnO NRs | |
| ZnO/mg | 20 | 20 | 20 | 20 |
| DDW/mL | 15 | 15 | 15 | 15 |
| TC/mg | 5 | — | 5 | — |
| CTAB/mL | 0.8 | 0.8 | — | — |
| NaOH/μL | 100 | 100 | 100 | 100 |
| Ethanol/mL | 0.2 | 0.2 | 0.2 | 0.2 |
| TEOS/μL | 100 | 100 | 100 | 100 |
| APTES/μL | 20 | 20 | 20 | 20 |
The non-imprinted polymers were prepared using the same procedure without the addition of the template TC.
2.5 Measurement procedure
In the experiments, all the fluorescent measurements were taken under the same conditions: both the slit width of the excitation and emission were set at 10 nm. The excitation wavelength was 280 nm and the recording emission range was from 330 nm to 430 nm. Meanwhile, the photomultiplier tube voltage was set at 750 V.20 mg of both the MIPs-ZnO NRs and NIPs-ZnO NRs were dispersed in 20 mL DDW to get the freshly made stock solutions (1.0 g L−1). Some certain amounts of TC and other kinds of tetracycline antibiotic were dispersed in 25 mL DDW to gain the analyte stock solutions (1.0 mmol L−1) and stored at 4.0 °C. Before these measurements, a certain volume of the stock solution of the MIPs-ZnO NRs or NIPs-ZnO NRs was added into a 10 mL colorimetric tube, and a given concentration of analyte standard solution was added into it. Then, the mixture solution was diluted to the volume of 5.0 mL with DDW and mixed thoroughly. After incubating for a certain time, the mixture solution was transferred into a quartz cell (1.0 × 1.0 × 3.0 cm) for further fluorescent measurements.
3 Results and discussion
3.1 Preparation and characterization
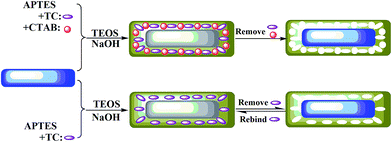
The general scheme for the synthesis of the mesoporous MIPs-ZnO NRs is illustrated in Fig. 1. In the first step, ZnO NRs with a lot of hydroxyl and carboxyl groups were synthesized by a hydrothermal method. In the second step, the mesoporous MIPs-ZnO NRs were obtained by a sol–gel process, as shown in Fig. 1, in which, the ZnO NRs were used as the solid support and optical material, TC was used as the template molecule, and CTAB was utilized to form the mesoporous structure. Meanwhile, APETS (the functional monomer), TEOS (the cross-linking agent), and NaOH (the catalyst) were involved in the formation of the MIPs layer on the surface of the ZnO NRs.35 After the template (TC) and the surfactant (CTAB) were removed by hot water, the mesoporous MIPs-ZnO NRs were obtained, and could rebind the template molecule due to the specific recognition sites with the appropriate compatibility of size, shape, and chemical interaction. Furthermore, the mesoporous MIPs silica layer could not only protect the fluorescence of the ZnO NRs, but could also accelerate the rapid mass transfer of template molecules. In the presence of TC, the photoluminescent energy of ZnO NRs is transferred to TC and results in ZnO NRs fluorescence quenching based on a radiation energy transfer quenching mechanism. To study the effect of mesoporous structure in the MIPs-ZnO NRs on the selective recognition and determination of TC, MIPs-ZnO NRs without a mesoporous structure were synthesized by the same process but with the absence of CTAB. To investigate the optical determining property of the MIPs-ZnO NRs, mesoporous NIPs-ZnO NRs and non-mesoporous NIPs-ZnO NRs were synthesized. Both the mesoporous and non-mesoporous NIPs-ZnO NRs were synthesized by the same sol–gel process without the presence of the template molecules (TC).The morphologies of the ZnO NRs and mesoporous MIPs-ZnO NRs and non-mesoporous MIPs-ZnO NRs were investigated by TEM, and the results are shown in Fig. 2a–d. It could be found from Fig. 2a that the length of ZnO NRs was 80–200 nm and the diameter was 18.5–23.5 nm. The NRs were obtained with perfect dispersibility and surface structures. Moreover, non-mesoporous MIPs-ZnO NRs (Fig. 2b) and mesoporous MIPs-ZnO NRs (Fig. 2c) were both wrapped with a thin polymer layer, and the thickness of these two products was almost the same with a value of about 14–19 nm. However, from Fig. 2c, it was not difficult to find that the surface of the mesoporous MIPs-ZnO NRs was much rougher and there were a lot of worm-like channels existing in the polymer layer, suggesting that many mesoporous structures had formed at the surface of the MIPs-ZnO NRs. Furthermore, as shown in Fig. 2d, the size of the mesoporous structure were approximately 2.5–5.0 nm, and this structure could improve site accessibility, reduce mass transfer resistance, and had a better defined material shape for special recognition toward the template TC. These results proved that these hybrid structures were successfully synthesized, and possessed the ZnO NRs as sensitive fluorescence signal units and a thin mesoporous or non-mesoporous structured imprinted polymer layer as selective recognition units.
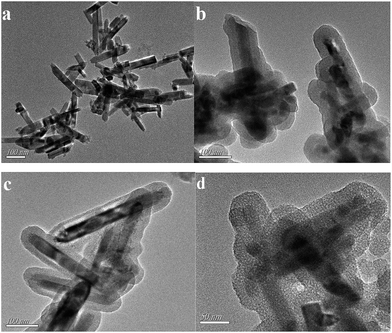 | ||
| Fig. 2 TEM images of ZnO NRs (a); non-mesoporous MIPs-ZnO NRs (b) and mesoporous MIPs-ZnO NRs (c and d). | ||
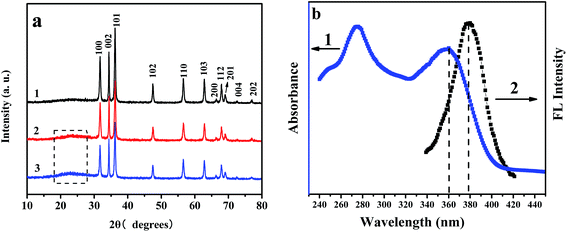
Fig. 3a shows the X-ray diffraction pattern of ZnO NRs (curve 1) and non-mesoporous MIPs-ZnO NRs (curve 2) and mesoporous MIPs-ZnO NRs (curve 3), respectively. In the 2θ range of 10–80°, eleven characteristic peaks, comprising (100), (002), (101), (102), (110), (103), (200), (112), (201), (004), and (202), were obvious, showing that the diffraction peaks are relatively sharp and peak intensity is high, indicating all the ZnO NRs, non-mesoporous MIPs-ZnO NRs, and mesoporous MIPs-ZnO NRs grains had developed well. Both the XRD patterns of the non-mesoporous MIPs-ZnO NRs and mesoporous MIPs-ZnO NRs were similar to that of the ZnO NRs, suggesting that grafting non-mesoporous and mesoporous polymer layers did not change the structure of the ZnO NRs. Furthermore, the XRD pattern of mesoporous MIPs-ZnO NRs was similar to the non-mesoporous MIPs-ZnO NRs, indicating that the mesoporous structure did not influence the polymer layer too much. Compared to the XRD pattern of ZnO NRs, there was a weak peak in the XRD pattern of both mesoporous MIPs-ZnO NRs and non-mesoporous MIPs-ZnO NRs in the 2θ range of 20–25°, which may have been caused by the imprinted polymer layer coating the ZnO NRs.
Fig. 3b shows the absorption spectra of TC (curve 1) and the emission spectra of MIPs-ZnO NRs (curve 2). It is obvious that TC has an absorption peak at 360 nm and ZnO has an emission peak at 380 nm. Moreover, the absorption spectra of TC and the emission spectra of MIPs-ZnO NRs have a certain degree of overlap, which indicate that the energy emitted from ZnO can be transferred to B, and absorbed by TC. This process can give rise to the fluorescence quenching of ZnO, which is named radiation energy transfer (RET).
3.2 Effect of the concentration of mesoporous MIPs-ZnO NRs and non-mesoporous MIPs-ZnO NRs
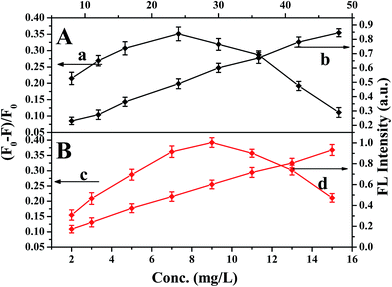
Due to the concentration of MIPs-ZnO NRs, they play an important role on the fluorescent detection system. Too much MIPs-ZnO NRs could lower the sensitivity, whereas too little could narrow the linear range. Taking these two factors into consideration, the concentration of mesoporous MIPs-ZnO NRs (part B) from 2.0 mg L−1 to 15 mg L−1 with 20 μmol L−1 of TC were chosen to investigate these factors. Moreover, we studied the concentration of non-mesoporous MIPs-ZnO NRs (part A) from 4.0 mg L−1 to 48 mg L−1 with 20 μmol L−1 of TC to make a comparison. As shown in Fig. 4, in consideration of these two key points (sensitivity and linear range), the optimum value of non-mesoporous MIPs-ZnO NRs for the further work was 36 mg L−1, while that of mesoporous MIPs-ZnO NRs was 13 mg L−1. It was not difficult to find that mesoporous MIPs-ZnO NRs were more sensitive than non-mesoporous MIPs-ZnO NRs for the fluorescence determination of TC under the same conditions, and to show that the mesoporous structure had greatly improved the utilization of the molecularly imprinting fluorescent sensor.3.3 Stability and detection time
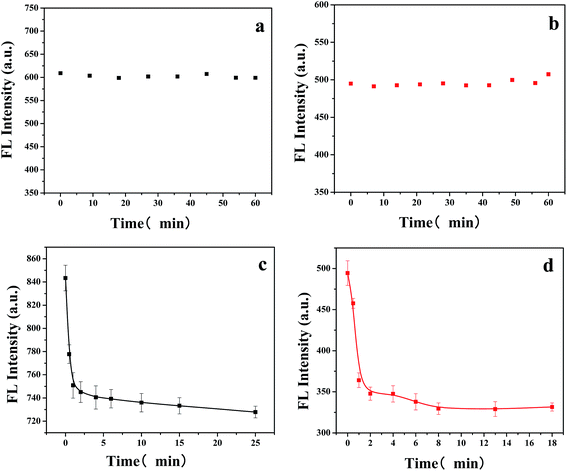
Except with the optimum concentration of MIPs-ZnO NRs, the optical stability was also investigate via the repeated detection of the fluorescence intensity of MIPs-ZnO NRs without any templates in 30 min. As shown in Fig. 5a and b, the change in the FL intensity of mesoporous MIPs-ZnO NRs (8.0 mg L−1) and non-mesoporous MIPs-ZnO NRs (36 mg L−1) were not obvious, suggesting that the optical stability of both mesoporous MIPs-ZnO NRs and non-mesoporous MIPs-ZnO NRs were considerably perfect within 30 min, which may well be because the ZnO NRs were well protected by the polymer layer.Base on the good optical stability, the response time of MIPs-ZnO NRs for detecting the template TC was also studied. As shown in Fig. 5c and d, the fluorescence intensity of mesoporous MIPs-ZnO NRs (8.0 mg L−1) with TC (20 μmol L−1) was recorded at different time intervals. As a comparison, the fluorescence intensity of non-mesoporous MIPs-ZnO NRs (36 mg L−1) with TC (60 μmol L−1) was also recorded under the same conditions. It could be found that the fluorescence intensity of mesoporous MIPs-ZnO NRs decreased rapidly in the initial 2.0 min and then remained stable after 4.0 min, whereas that of non-mesoporous MIPs-ZnO NRs decreased rapidly in the initial 5.0 min and remained stable after 7.0 min. Therefore, both the mesoporous MIPs-ZnO NRs and the non-mesoporous MIPs-ZnO NRs had a rapid response speed for TC, and the response rate of mesoporous MIPs-ZnO NRs was higher than the non-mesoporous MIPs-ZnO NRs for determining TC. In addition, 5.0 min was selected as the optimal detection time for both of these two MIPs-ZnO NRs for the further experiments.
3.4 Mesoporous MIPs-ZnO NRs and mesoporous NIPs-ZnO NRs with different concentrations of template TC
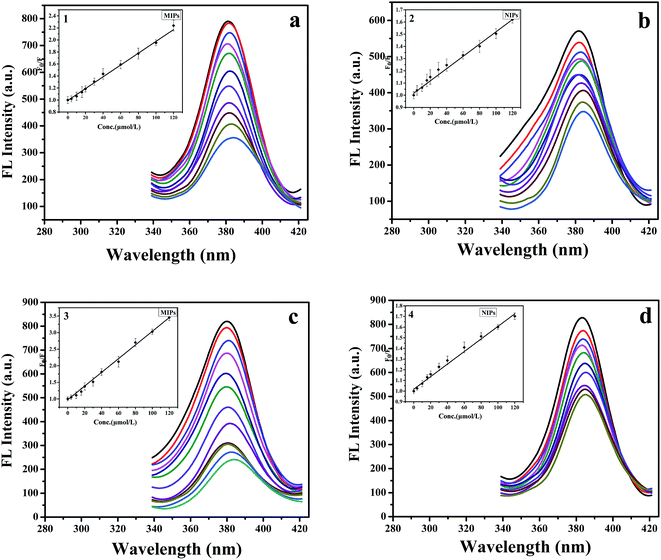
In this part, we further studied the recognition ability of the mesoporous MIPs-ZnO NRs and the mesoporous NIPs-ZnO NRs for the quantitative detection of TC under the optimum conditions determined above. Before the fluorescent detection, a certain amount of the target TC was incubated with mesoporous MIPs-ZnO NRs (optimum concentration) or mesoporous NIPs-ZnO NRs (corresponding concentration) in a comparison tube (10 mL) with DDW for 5.0 min at room temperature. With the concentrations of TC gradually increasing from 0 to 120 μmol L−1, the fluorescence intensity changed correspondingly. The results of the relevant data analysis are revealed in Fig. 6c and d. In this detection system, the fluorescence quenching could be described by the Stern–Volmer equation:| F0/F = 1 + KSVCTC |
As observed in Fig. 6c and d, the KSV,MIP1 of mesoporous MIPs-ZnO NRs and KSV,NIP1 of mesoporous NIPs-ZnO NRs were 20![[thin space (1/6-em)]](https://www.rsc.org/images/entities/char_2009.gif) 640 M−1 and 5890 M−1, respectively. As shown in the calibration curve 3 and curve 4, the linear range and the correlation coefficient of the mesoporous MIPs-ZnO NRs were 2.0–120 μmol L−1 and 0.9993. In addition, the detection limit (3σ/k) of the mesoporous MIPs-ZnO NRs was 1.27 μmol L−1, in which k is the slope of the calibration line and σ is the standard deviation of blank measurements (n = 10). While, the values for mesoporous NIPs-ZnO NRs were 2.0–120 μmol L−1 and 0.9910, respectively. As a comparison, the plots for the non-mesoporous fluorescent sensor are shown in Fig. 6a and b, where the KSV,MIP2 of the non-mesoporous MIPs-ZnO NRs and KSV,NIP2 of the non-mesoporous NIPs-ZnO NRs were 9820 M−1 and 5030 M−1, respectively. The linear range and the correlation coefficient (shown in the calibration curves 1 and 2) of the non-mesoporous MIPs-ZnO NRs were 2.0–120 μmol L−1 and 0.9955, while these of non-mesoporous NIPs-ZnO NRs were 2.0–120 μmol L−1 and 0.9966, respectively. Furthermore, the detection limit of the non-mesoporous MIPs-ZnO NRs was 1.54 μmol L−1. By calculation, the IF (KSV,MIP1/KSV,NIP1) of the mesoporous fluorescent sensor was about 3.50; while, the IF (KSV,MIP2/KSV,NIP2) of the non-mesoporous fluorescent sensor was about 1.95. Therefore, it was not difficult to find that MIPs had a higher selectivity than NIPs, owing to the recognizing sites contained in the MIPs-ZnO, but not in the NIPs-ZnO. Furthermore, the selectivity of the mesoporous fluorescent sensor was higher than that of the non-mesoporous fluorescent sensor, which may be caused by the mesoporous structure significantly enhancing the quenching efficiency of determining TC.
640 M−1 and 5890 M−1, respectively. As shown in the calibration curve 3 and curve 4, the linear range and the correlation coefficient of the mesoporous MIPs-ZnO NRs were 2.0–120 μmol L−1 and 0.9993. In addition, the detection limit (3σ/k) of the mesoporous MIPs-ZnO NRs was 1.27 μmol L−1, in which k is the slope of the calibration line and σ is the standard deviation of blank measurements (n = 10). While, the values for mesoporous NIPs-ZnO NRs were 2.0–120 μmol L−1 and 0.9910, respectively. As a comparison, the plots for the non-mesoporous fluorescent sensor are shown in Fig. 6a and b, where the KSV,MIP2 of the non-mesoporous MIPs-ZnO NRs and KSV,NIP2 of the non-mesoporous NIPs-ZnO NRs were 9820 M−1 and 5030 M−1, respectively. The linear range and the correlation coefficient (shown in the calibration curves 1 and 2) of the non-mesoporous MIPs-ZnO NRs were 2.0–120 μmol L−1 and 0.9955, while these of non-mesoporous NIPs-ZnO NRs were 2.0–120 μmol L−1 and 0.9966, respectively. Furthermore, the detection limit of the non-mesoporous MIPs-ZnO NRs was 1.54 μmol L−1. By calculation, the IF (KSV,MIP1/KSV,NIP1) of the mesoporous fluorescent sensor was about 3.50; while, the IF (KSV,MIP2/KSV,NIP2) of the non-mesoporous fluorescent sensor was about 1.95. Therefore, it was not difficult to find that MIPs had a higher selectivity than NIPs, owing to the recognizing sites contained in the MIPs-ZnO, but not in the NIPs-ZnO. Furthermore, the selectivity of the mesoporous fluorescent sensor was higher than that of the non-mesoporous fluorescent sensor, which may be caused by the mesoporous structure significantly enhancing the quenching efficiency of determining TC.
Many excellent works about ZnO-based sensors and the detection of TC have been reported, some of which have been summarized and are listed in Table 2 to compare with the present work. It was found that ZnO-based sensors have been used to fluorescently detect some substances with perfect performance. However, there has been no work reported about the ZnO-based sensor for the detection of TC. Some sensors, such as CdTe quantum dots, and silver nanoparticles, have been reported for fluorescently detecting TC. However, these methods may cause heavy metal pollution. Moreover, although some other sensors, such as carbon dots, could detect TC with outstanding performance, their selectivity was not satisfactory. Therefore, to take the detection limit, environmental friendly and selectivity into consideration, a fluorescent sensor based on mesoporous MIPs-ZnO NRs for the selective detection of TC was prepared in this work. In addition, the obtained mesoporous MIPs-ZnO NRs integrate the advantages of the excellent fluorescent property of the ZnO NRs with the high selectivity of the molecular imprinted polymers and the structural advantages of the mesoporous silicon.
| Sensor | Target object | Selectivity | Linear range | LOD | Reference |
|---|---|---|---|---|---|
| ZnO NRs | para-Nitrophenol | Yes | 0.5–14 mmol L−1 | 0.036 mmol L−1 | 29 |
| ZnO nanoparticles | Histidine | No | 0.5–20 μmol L−1 | 0.987 μmol L−1 | 36 |
| ZnO nanoparticles | Citalopram | No | 0.012–1.54 μmol L−1 | 0.005 μmol L−1 | 37 |
| CdTe quantum dots | Tetracycline | Yes | 0.07–2.2 mmol L−1 | 2.1 μmol L−1 | 38 |
| Silver nanoparticles | Tetracycline | No | 0.05–5.0 mg L−1 | 0.013 mg L−1 | 39 |
| Carbon dots | Tetracycline | No | 0.01–100 μmol L−1 | 0.0033 μmol L−1 | 40 |
| ZnO NRs | Tetracycline | Yes | 2.0–120 μmol L−1 | 1.27 μmol L−1 | This work |
3.5 Selectivity
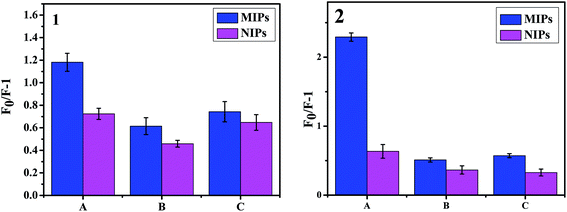
To further investigate the selective properties of these two fluorescent sensors, two other types of tetracycline antibiotics (DC and OTC), which have structures similar to TC, were chosen to record the fluorescent intensity. Here, F0/F − 1 was defined as the quenching amount. As shown in Fig. 7, both in the non-mesoporous fluorescent sensor (1) and in the mesoporous fluorescent sensor (2), the quenching amount of the MIPs-ZnO for the TC was much higher than that for the other tetracycline antibiotics, while the values for the NIPs-ZnO for TC and for the other tetracycline antibiotics were similar. By calculation, the quenching amounts of mesoporous MIPs-ZnO NRs were 2.2921, 0.5100, and 0.5726 at 100 μmol L−1 for TC, DC, and OTC, respectively, while those of non-mesoporous MIPs-ZnO NRs were 1.1811, 0.6143, and 0.7425 at 100 μmol L−1 for TC, DC, and OTC, respectively. Meanwhile, the quenching amount of mesoporous NIPs-ZnO NRs were 0.6342, 0.3654, and 0.3277, correspondingly, while those of non-mesoporous MIPs-ZnO NRs were 0.7238, 0.4586, and 0.6476. These results demonstrated that MIPs-ZnO NRs could allow special recognition of TC but not other tetracycline antibiotics, owing to the many specific recognition sites formed in the synthesis of the MIPs-ZnO NRs. In addition, the selective properties of the mesoporous fluorescent sensor were clearly higher than that of the non-mesoporous fluorescent sensor for the fluorescent determination of TC, which could be explained by the mesoporous structure locating the recognition sites near to the surface, which increases the chances of the combination of TC and the recognition sites, thus reducing the response time and enhancing the quenching efficiency.3.6 Analytical applications in water sample
To demonstrate the applicability of the mesoporous fluorescent sensor, mesoporous MIPs-ZnO NRs were utilized to detect TC in water samples gathered from the local rural area of Zhenjiang, China. Before the experiments, these samples were filtered through 0.45 mm Supor filters and stored in glass bottles with a volume of 10 mL. As no TC in these water samples were detectable by the fluorescent sensor, a recovery study was carried out. These samples were spiked with 6.0–24 μmol L−1 TC with 65 mg of mesoporous MIPs-ZnO NRs added into the solution. Before the fluorescence test, these mixtures were incubated for 5 min, and the corresponding results are listed in Table 3. According to the “standard” curve obtained in the previous work (Fig. 6c), we were able to estimate the TC levels in these water samples. These recoveries were from 102.37% to 103.51%, showing the excellent recognition ability of the mesoporous fluorescent sensor for detecting TC concentrations in unknown water samples. To investigate the effect of the mesoporous structure, we also studied the applicability of the non-mesoporous fluorescent sensor, and the corresponding results are also listed in Table 3. The recoveries of the non-mesoporous MIPs-ZnO NRs were from 94.61% to 103.55%, which showed that the mesoporous structure has greatly promoted the applicability of detecting TC in the unknown water samples.| Sample | Concentration taken (μmol L−1) | Mesoporous fluorescent sensor | Non-mesoporous fluorescent sensor | ||
|---|---|---|---|---|---|
| Found (μmol L−1) | Recovery (%) | Found (μmol L−1) | Recovery (%) | ||
| 1 | 6.0 | 6.142 | 102.37 | 5.913 | 98.55 |
| 2 | 12 | 12.421 | 103.51 | 12.353 | 102.94 |
| 3 | 18 | 18.582 | 103.23 | 17.965 | 99.81 |
| 4 | 24 | 24.643 | 102.68 | 24.394 | 101.64 |
4 Conclusion
In summary, a mesoporous fluorescent sensor was successfully fabricated, which used TC as the template molecule, CTAB as the porogen, and ZnO NRs as the core substrate material and optical material. The fluorescent sensor achieved the sensitive determination and selective recognition of TC from water medium, owing to combining the strong fluorescence property of ZnO NRs and the high selectivity of MIPs. By comparison with the non-mesoporous fluorescent sensor, the mesoporous MIPs-ZnO NRs displayed better selective recognition and sensitive detection of TC. Moreover, the amount of material consumed in the mesoporous fluorescent sensor was much less than that of non-mesoporous fluorescent sensor, and the response time of the mesoporous fluorescent sensor was lower than that of non-mesoporous fluorescent sensor. These results all demonstrated that the mesoporous fluorescent sensor possesses the more outstanding properties and could realize the simple, rapid, low-cost, eco-friendly, selective, and high sensitive fluorescence detection of TC in unknown water samples. Finally, all these fluorescent determining and recognition experiments were measured and confirmed in our laboratory. Overall, the mesoporous MIPs-ZnO NRs should attract more interest for specific determination and recognition in the future.Acknowledgements
This study was financially supported by the National Natural Science Foundation of China (no. 21107037, no. 21176107, no. 21174057, no. 21277063, no. 21407057 and no. 21407064), the National Basic Research Program of China (973 Program, 2012CB821500), the Natural Science Foundation of Jiangsu Province (no. BK20140535), the National Postdoctoral Science Foundation (no. 2014M561595), Postdoctoral Science Foundation funded Project of Jiangsu Province (no. 1401108C).References
- R. A. Palominos, M. A. Mondaca, A. Giraldo, G. Peñuela and M. Pérez-Moya, Catal. Today, 2009, 144, 100–105 CrossRef CAS.
- M. Addamo, V. Augugliaro, A. Paola, E. García-López and V. Loddo, Appl. Electrochem., 2005, 35, 765–774 CrossRef CAS.
- H. Oka, Y. Ito and H. J. Matsumoto, J. Chromatogr. A, 2000, 882, 109–133 CrossRef CAS PubMed.
- F. Aalipour, M. Mirlohi and J. Jalali, J. Environ. Health Sci. Eng., 2015, 13, 80 CrossRef PubMed.
- J. M. Miranda, J. A. Rodriguez and C. A. Galan-Vidal, J. Chromatogr. A, 2009, 1216, 3366–3371 CrossRef CAS PubMed.
- X. D. Zhu, Y. J. Wang and R. J. Sun, Chemosphere, 2013, 92, 925–932 CrossRef CAS PubMed.
- L. Zhu, X. Cui, J. Wu, Z. Wang, P. Wang and Y. Hou, Anal. Methods, 2014, 6, 4430–4436 RSC.
- E. Ying, D. Li, S. Guo, S. Dong and J. Wang, PLoS One, 2008, 3, 2222 Search PubMed.
- H. Chen, L. Lin, Z. Lin, G. Guo and J. Lin, J. Phys. Chem. A, 2010, 114, 10049–10058 CrossRef CAS PubMed.
- X. Wang, P. Sheng, L. Zhou, X. Tong and L. Shi, Biosens. Bioelectron., 2014, 60, 52–56 CrossRef CAS PubMed.
- H. Kim, W. Ren, J. Kim and J. Y. Yoon, Chem. Soc. Rev., 2012, 41, 3210–3244 RSC.
- L. Yuan, W. Lin, K. Zheng, L. He and W. Huang, Chem. Soc. Rev., 2013, 42, 622–661 RSC.
- J. B. Liang, J. W. Liu, Q. Xie, S. Bai, W. C. Yu and Y. T. Qian, J. Phys. Chem. B, 2005, 109, 9463–9467 CrossRef CAS PubMed.
- L. X. Chen, S. F. Xu and J. H. Li, Chem. Soc. Rev., 2011, 40, 2922–2942 RSC.
- M. J. Whitcombe, I. Chianella, L. Larcombe, S. A. Piletsky and J. Noble, Chem. Soc. Rev., 2011, 40, 1547–1571 RSC.
- J. H. Li, Z. Zhang, S. F. Xu and L. X. Chen, J. Mater. Chem., 2011, 21, 19267–19274 RSC.
- S. Liao, W. Zhang, W. Long, D. Hou and X. C. Yang, Appl. Surf. Sci., 2016, 364, 579–588 CrossRef CAS.
- X. F. Zheng, Q. Lian, H. Yang and X. P. Wang, Sci. Rep., 2016, 6, 21409 CrossRef CAS PubMed.
- C. H. Lu, W. H. Zhou, B. Han, H. Yang, X. Chen and X. Wang, Anal. Chem., 2007, 79, 5457–5461 CrossRef CAS PubMed.
- Z. Zhang, L. Chen, F. Yang and J. Li, RSC Adv., 2014, 4, 31507–31514 RSC.
- B. J. Gao, J. Wang, F. Q. An and Q. Liu, Polymer, 2008, 49, 1230–1238 CrossRef CAS.
- L. Qin, X. R. Jia, Y. Z. Yang and X. G. Liu, Ind. Eng. Chem. Res., 2016, 55, 1710–1719 CrossRef CAS.
- T. Kamra, S. Chaudhary, C. G. Xu, L. Montelius and J. Schnadt, J. Colloid Interface Sci., 2016, 461, 1–8 CrossRef CAS PubMed.
- Y. L. Gao, Y. Hu and K. J. Yao, Front. Chem. Sci. Eng., 2015, 9, 467–478 CrossRef CAS.
- A. G. Ayankojo, A. Tretjakoy, J. Reut, R. Boroznjak, A. Opik and K. Hinrichs, Anal. Chem., 2016, 88, 1476–1484 CrossRef CAS PubMed.
- C. B. Liu, Z. L. Song, J. M. Pan and Y. S. Yan, Talanta, 2014, 125, 14–20 CrossRef CAS PubMed.
- L. Gao, W. J. Han, X. Y. Li, J. X. Wang and Y. S. Yan, Anal. Bioanal. Chem., 2015, 407, 9177–9184 CrossRef CAS PubMed.
- X. Wei, T. F. Hao, Y. Q. Xu, H. J. Li and K. Lu, Sens. Actuators, B, 2016, 224, 315–324 CrossRef CAS.
- X. Wei, Z. P. Zhou and T. F. Hao, RSC Adv., 2015, 55, 44088–44095 RSC.
- F. Q. An, B. J. Gao and X. Q. Feng, J. Hazard. Mater., 2008, 157, 286–292 CrossRef CAS PubMed.
- Y. Zhao, Y. Ma, H. Li and L. Wang, Anal. Chem., 2011, 84, 386–395 CrossRef PubMed.
- M. B. Jung, M. Ś. Kim, J. K. Woo and Y. J. '. Chang, Chem. Commun., 2010, 46, 3699–3701 RSC.
- Z. Zhang, J. H. Li, X. Y. Wang, D. Z. Shen and L. X. Chen, ACS Appl. Mater. Interfaces, 2015, 7, 9118–9127 CAS.
- Y. Guo, X. B. Cao, X. M. Lan, C. Zhao and X. D. Xue, J. Phys. Chem. C, 2008, 112, 8832–8838 CAS.
- J. Kuijt, F. Ariese, U. A. T. Brinkman and C. Gooijer, Anal. Chim. Acta, 2003, 488, 135–171 CrossRef CAS.
- D. D. Wu, Q. W. Liang and Z. Chen, Luminescence, 2016, 31, 965–971 CrossRef CAS PubMed.
- H. Ghaedi, A. Afkhami and T. Madrakian, Mater. Sci. Eng., C, 2016, 59, 847–854 CrossRef CAS PubMed.
- M. R. Chao, C. W. Hu and J. L. Chen, Anal. Chim. Acta, 2016, 925, 61–69 CrossRef CAS PubMed.
- M. Amjadi, J. L. Manzoori and F. Pakpoor, J. Anal. Chem., 2016, 71, 253–258 CrossRef CAS.
- Y. J. Feng, D. Zhong, H. Miao and X. M. Yang, Talanta, 2015, 140, 128–133 CrossRef CAS PubMed.
| This journal is © The Royal Society of Chemistry 2016 |

