
 Open Access Article
 This Open Access Article is licensed under a
 Creative Commons Attribution 3.0 Unported Licence
Oxidation of free, peptide and protein tryptophan residues mediated by AAPH-derived free radicals: role of alkoxyl and peroxyl radicals
E.
Fuentes-Lemus
a,
E.
Dorta
a,
E.
Escobar
a,
A.
Aspée
b,
E.
Pino
b,
M. L.
Abasq
c,
H.
Speisky
d,
E.
Silva
e,
E.
Lissi
b,
M. J.
Davies
f and
C.
López-Alarcón
*a
aDepartamento de Farmacia, Facultad de Química, Pontificia Universidad Católica de Chile, Santiago, Chile. E-mail: clopezr@uc.cl
bFacultad de Química y Biología, Universidad de Santiago de Chile, Santiago, Chile
cFaculté de Sciences Pharmaceutiques et Biologiques, Université de Rennes 1, Rennes, France
dInstituto de Nutrición y Tecnología de los Alimentos, INTA, Universidad de Chile, Chile
eDepartamento de Química Física, Facultad de Química, Pontificia Universidad Católica de Chile, Santiago, Chile
fDepartment of Biomedical Sciences, Panum Institute, University of Copenhagen, Denmark
First published on 8th June 2016
Abstract
The oxidation of tryptophan (Trp) residues, mediated by peroxyl radicals (ROO˙), follows a complex mechanism involving free radical intermediates, and short chain reactions. The reactivity of Trp towards ROO˙ should be strongly affected by its inclusion in peptides and proteins. To examine the latter, we investigated (by fluorescence) the kinetic of the consumption of free, peptide- and protein-Trp residues towards AAPH (2,2′-azobis(2-amidinopropane)dihydrochloride)-derived free radicals. Interestingly, the initial consumption rates (Ri) were only slightly influenced by the inclusion of Trp in small peptides and proteins (human serum albumin and human superoxide dismutase). Depending on the Trp concentration, the Riversus Trp concentration ([Trp]) plots showed three regions. At low Trp concentrations (1–10 μM), a linear dependence was observed between Ri and [Trp]; at intermediate Trp concentrations (10–50 μM), the values of Ri were nearly constant; and at high Trp concentrations (50 μM to 1 mM), a slower increase of Ri than expected for chain reactions. Similar behavior was detected for all three systems (free Trp, and Trp in peptides and proteins). For the first time we are showing that alkoxyl radicals, formed from self-reaction of ROO˙, are responsible of the Trp oxidation at low concentrations, while at high Trp concentrations, a mixture of peroxyl and alkoxyl radicals are involved in the oxidation of Trp residues.
1. Introduction
Tryptophan (Trp) residues are known to be susceptible to oxidation by reactive oxygen species (ROS), and in particular, by peroxyl radicals (ROO˙).1–3 Oxidation by radicals involves the initial abstraction of a hydrogen atom from position 1 on the indole ring of Trp, to generate a tryptophanyl (indolyl) radical (Trp˙). Although a low rate constant has been reported for reaction of Trp˙ with O2,4 this process appears to be a major fate of this radical, with this yielding a tryptophanyl-peroxyl radical (Trp-OO˙).5 The latter species can react with another Trp molecule via a hydrogen-atom abstraction reaction generating a Trp hydroperoxide, which could produce either a hexahydropyrroloindole or an endoperoxide derivative.5 As multiple different reaction pathways appear to occur on reaction of ROO˙ with Trp, it is not surprising that multiple products have been identified, including hydroperoxides, alcohols, N-formylkynurenine (NFKyn) and kynurenine (Kyn).5–7The kinetics of Trp oxidation have been examined in several studies and conflicting data have been reported under different experimental conditions, and with a range of different ROS.5–9 Friedman and Cuq reported that Trp is stable in aqueous solutions at room temperature.6 However, at high temperatures (100 °C), and in the presence of oxygen or air, autoxidation was observed. This followed a first kinetic order limit with kinetic rate constants of ∼10 × 103 h−1.6 The mechanism of Trp autoxidation has been reported to resemble that for oxidation of Trp by ROS (i.e. involving Trp˙ and Trp-OO˙).5,6 In other studies, Krogull and coworkers observed that Trp is readily consumed in the presence of oxidizing methyl linoleate,7 with the consumption rate being dependent on the pH, ionic strength, and the presence of metal ions.7 Interestingly, when compared with free Trp, the rate of Trp consumption increased when this amino acid was present in the form of the tripeptide Gly–Trp–Gly.7
As azocompounds decompose during aerobic thermolysis to yield ROO˙ at a constant and known rate, these derivatives have been widely employed as source of model ROO˙.10 Several groups have employed AAPH (2,2′-azobis(2-amidinopropane)dihydrochloride) as a ROO˙ source for studies on the oxidation of free, peptide, and protein Trp residues.11–19 In proteins, Trp residues have been reported to be critical targets, whose secondary reactions can result in modification of further amino acids and/or fragmentation and oligomerization of the protein.18 Aspee and Lissi5 provided evidence showing that the incubation of free Trp with AAPH resulted in light emission through a process in which the reaction of intermediates with peroxyl radicals is involved.5 Such reaction has also been implicated in the chemiluminescence observed from proteins when they are exposed to AAPH.12 The decrease of the catalytic activity of lysozyme by ROO˙ has been related to the oxidation of Trp residues.16 Interestingly, the dependence of the initial consumption rate of Trp residues with their initial concentration showed a S-shape behavior, which was attributed to the presence of short chain reactions at high lysozyme concentrations.16 Moreover, the addition of free Trp to solutions containing lysozyme and AAPH clearly inhibited enzyme inactivation induced by ROO˙, indicating that free Trp can act as a scavenger of these radicals.16 Inhibition of the oxidation of 5-aminosalycilic acid and erythrocytes by free, and peptide-bound Trp has also been proposed to be due to the capacity of Trp to scavenge such radicals.17,20
As tyrosine,21 the oxidation of Trp mediated by reactive species is likely to be influenced by multiple factors, including the incorporation of this residue into peptides or proteins. In fact, the local protein environment has shown to modulate the rate constant for the reaction between Trp and oxygen singlet.22 However, towards ROO˙, only a few studies have been published comparing the reactivity of free, peptide and protein-incorporated Trp residues. In addition, and in spite of the popularity of the use of AAPH as free radical source, only a few studies have considered the formation and reactions of alkoxyl radicals (RO˙), which can be formed from self-reaction of two ROO˙.23,24 As RO˙ are considerably more reactive than ROO˙, the production of these species – even at low levels – may modulate the rate of Trp consumption significantly.
In the present study we have undertaken experiments to investigate the kinetics of oxidation of free, peptide, and protein Trp residues by AAPH-derived free radicals. Di- and tripeptides, as well as proteins with a single Trp residue (human superoxide dismutase (hSOD) and human serum albumin (HSA)) were exposed to AAPH and the consumption of Trp residues followed by use of fluorescence spectroscopy. The results obtained indicate that the inclusion of Trp in small peptides or proteins only has minor influences on the kinetic behavior of Trp oxidation, however analysis of the kinetic data shows that at low Trp concentrations, the formation and reactions of RO˙ need to be considered when AAPH is employed as a free radical source. The latter is the first report showing that during the oxidation of Trp, depending on the experimental conditions, AAPH can give rise not just to ROO˙, but also to RO˙. Since the reactivity of RO˙ is significantly greater than that of ROO˙, only at high Trp concentrations does the reaction with ROO˙ start to become dominant. This is a particularly relevant and novel finding given the widespread use of AAPH a presumptive source of ROO˙.
2. Material and methods
2.1 Reagents
Alanine (Ala), glycine (Gly), 2,2′-azobis(2-amidinopropane)dihydrochloride (AAPH), Chelex resin, human serum albumin (HSA), Trp and N-acetyl-Trp (N-acetyl-Trp) were supplied by Sigma-Aldrich (St Louis, MO, USA). Trp methyl ester (Trp-COOMe) was purchased from AK Scientific Inc. (Union City, USA). The peptides: Gly–Trp, Trp–Gly, Gly–Trp–Gly, Trp–Ala, and Ala–Trp–Ala were obtained from Bachem (Bubendorf, Switzerland). All compounds were employed as received. Formic acid and methanol were HPLC grade and supplied by Merck (Darmstad, Germany). In all experiments ultrapure water (Milli-Q) was employed. Solutions were pretreated with Chelex resin for 24 h to remove contaminating trace metal ions before use. Human superoxide dismutase (hSOD) was obtained by the procedure described by Álvarez and collaborators.25 Protein concentrations (typically ∼0.3 mg mL−1) were determined by the BCA (bicinchoninic acid) assay, using bovine serum albumin as a standard.262.2 Solutions
Stock solutions of free Trp, dipeptides and proteins were prepared daily in phosphate buffer (75 mM, pH 7.4) at concentrations between 100 μM and 2 mM. Stock solutions of tripeptides (2 mM) were daily prepared in a mixture of phosphate buffer (75 mM, pH 7.4) and acetic acid in an 80/20 ratio. The stock solutions of AAPH (0.6 M) were prepared daily in phosphate buffer.2.3 Fluorescence studies
The kinetic profile of free, peptide, and protein Trp residue consumption induced by AAPH-derived radicals was assessed by fluorescence spectroscopy. A reaction mixture containing Trp (5 μM to 1 mM) with AAPH (6 mM) was incubated in phosphate buffer 75 mM, pH 7.4 at 45 °C. Oxygen consumption experiments indicated that the rate of AAPH decomposition (to give ROO˙) was 2.4 μM min−1 under these reaction conditions (data not shown). Trp consumption was evaluated from the progressive decrease of the fluorescence intensity at 360 nm (λex = 295 nm). Fluorescence measurements were carried out using a Perkin Elmer LS-55 spectrofluorimeter (Beaconsfield, UK). No changes in the shape of the Trp fluorescence spectrum were observed during the incubation of solutions containing Trp and AAPH (data not shown).2.4 Electrochemical studies
Cyclic voltammograms of free Trp and peptides (500 μM to 2 mM) were recorded in 100 mM phosphate buffer, pH 7.4 in an Autolab electrochemical working station (PGSTAT 302N) using a three-electrode configuration. A glassy carbon and a platinum wire were employed as working and auxiliary electrodes, respectively. All potentials were measured and reported against an Ag/AgCl/KClsat reference electrode, provided by Methrom.3. Results
3.1 Fluorescence studies
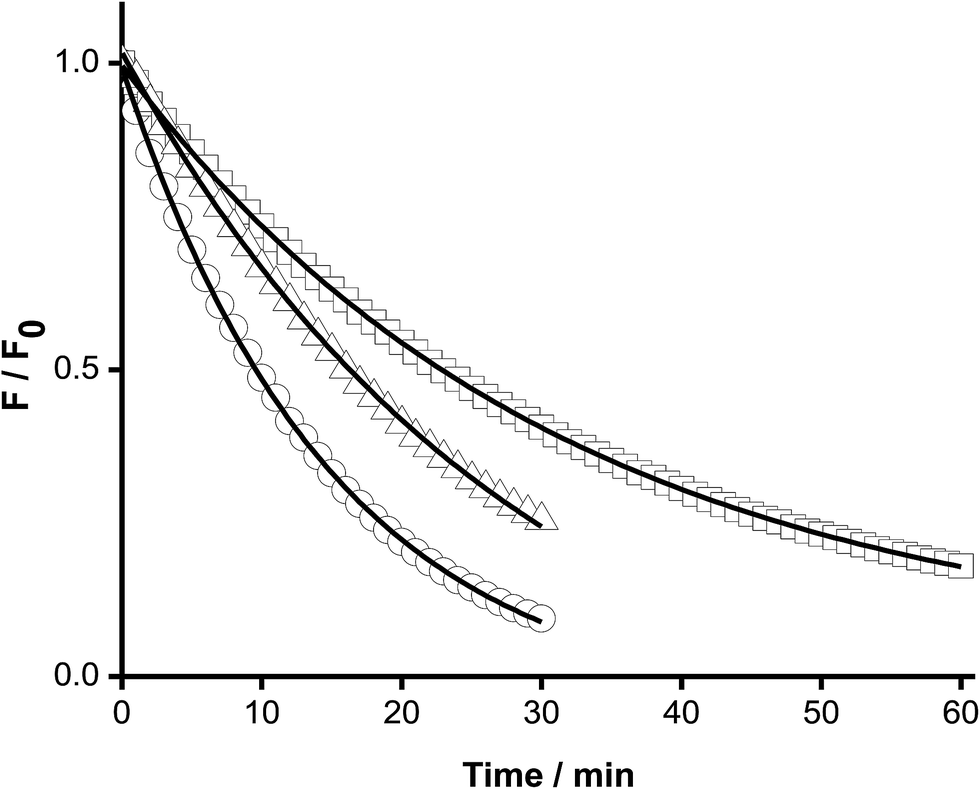
To study the kinetics of the reaction between Trp and AAPH-derived free radicals, solutions containing AAPH (6 mM) and Trp (5 μM to 1 mM) were incubated in phosphate buffer (75 mM, pH 7.4) at 45 °C. The fluorescence intensity (λex = 295 nm; λem = 360 nm) of such solutions was measured for 30 min or longer. As shown in Fig. 1, a significant decrease in the fluorescence intensity of free Trp was observed in the presence of AAPH. When the concentration of Trp was 5 μM, the fluorescence intensity reached 0.2 (from an initial normalized value of 1) after 20 min incubation, implying loss of 80% of the initial Trp concentration. After the same incubation time, but with the highest Trp concentration employed (1 mM), the fluorescence intensity only reached a (normalized) value of 0.9. Fig. 1 also shows the kinetic profile of consumption of Trp residues present in the dipeptide Gly–Trp on reaction with radicals from thermolysis of AAPH. At 5 μM, the initial consumption rate (Ri) of Gly–Trp was twice that seen with free Trp, with a normalised fluorescence intensity of 0.06 after 20 min incubation. In contrast with the highest concentration studied (1 mM), both derivatives (Trp and Gly–Trp) showed similar values of Ri. The dependence of the Ri values with the initial concentration of free Trp and Gly–Trp is presented in Fig. 2. As shown in Fig. 2A, at concentrations of 10 μM of lower, the Ri values were dependent on the initial concentration of both substrates. At 5 μM, Ri values of 0.32 and 0.65 μM min−1 were determined for free Trp and Gly–Trp, respectively, consistent with a two-fold faster rate of consumption of Trp in Gly–Trp compared to the free amino acid. However at concentrations of 10 μM or greater, the dependence between Ri values and the initial Trp concentration showed a near-plateau with only a small gradient. At 50 μM, Ri values of 0.82 and 1.25 μM min−1 were calculated for Trp and Gly–Trp, respectively. However for concentrations between 100 μM and 1 mM a linear dependence of Ri values with the initial Trp concentration was evident (Fig. 2B). For free Trp, linear regression of this behaviour showed an intercept of 0.321 (μM min−1) and a slope of 0.0064 min−1 (r2 = 0.99). In the case of Gly–Trp, the linear regression showed an intercept of 0.933 (μM min−1) and a slope of 0.0065 min−1 (r2 = 0.95). Interestingly, between 100 μM and 1 mM, similar values of Ri were determined for Trp and Gly–Trp. In fact, at the highest initial concentration studied (1 mM) Ri values of 6.8 and 7.7 μM min−1 were estimated for Trp and Gly–Trp, respectively, indicating that Gly–Trp was consumed only 1.1-fold faster than free Trp at this concentration (Fig. 2B).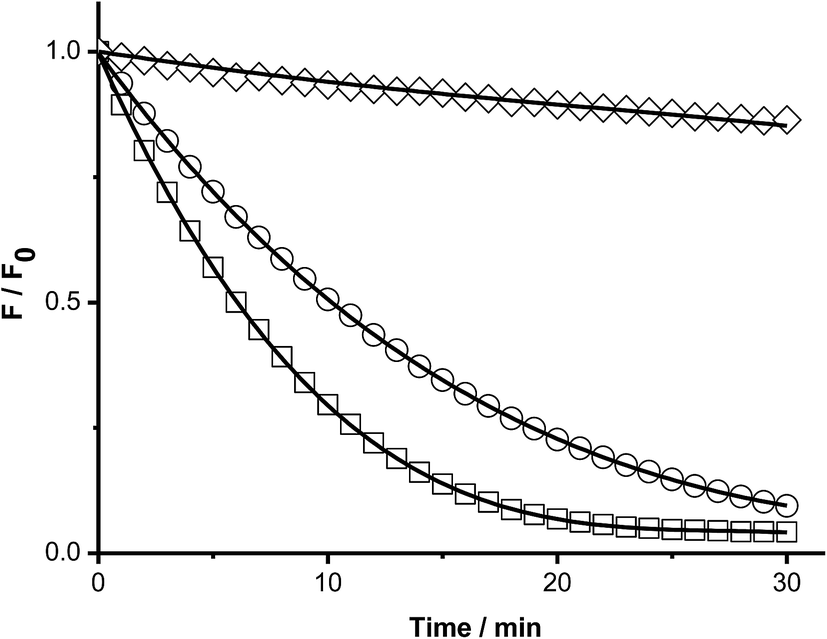 | ||
| Fig. 1 Kinetic profiles of Trp and Gly–Trp consumption mediated by AAPH-derived free radicals. Solutions of Gly–Trp at 5 μM (□) and free Trp at 5 μM (○), and 1 mM (◇) were incubated in the presence of AAPH (6 mM) in phosphate buffer at 45 °C. Trp consumption was followed by fluorescence emission at 360 nm (λex = 295 nm). The kinetic profiles of Gly–Trp at 1 mM concentration showed the same behaviour that free Trp. In order to simplify the plot, the Gly–Trp profile (1 mM) was not included in this figure. | ||
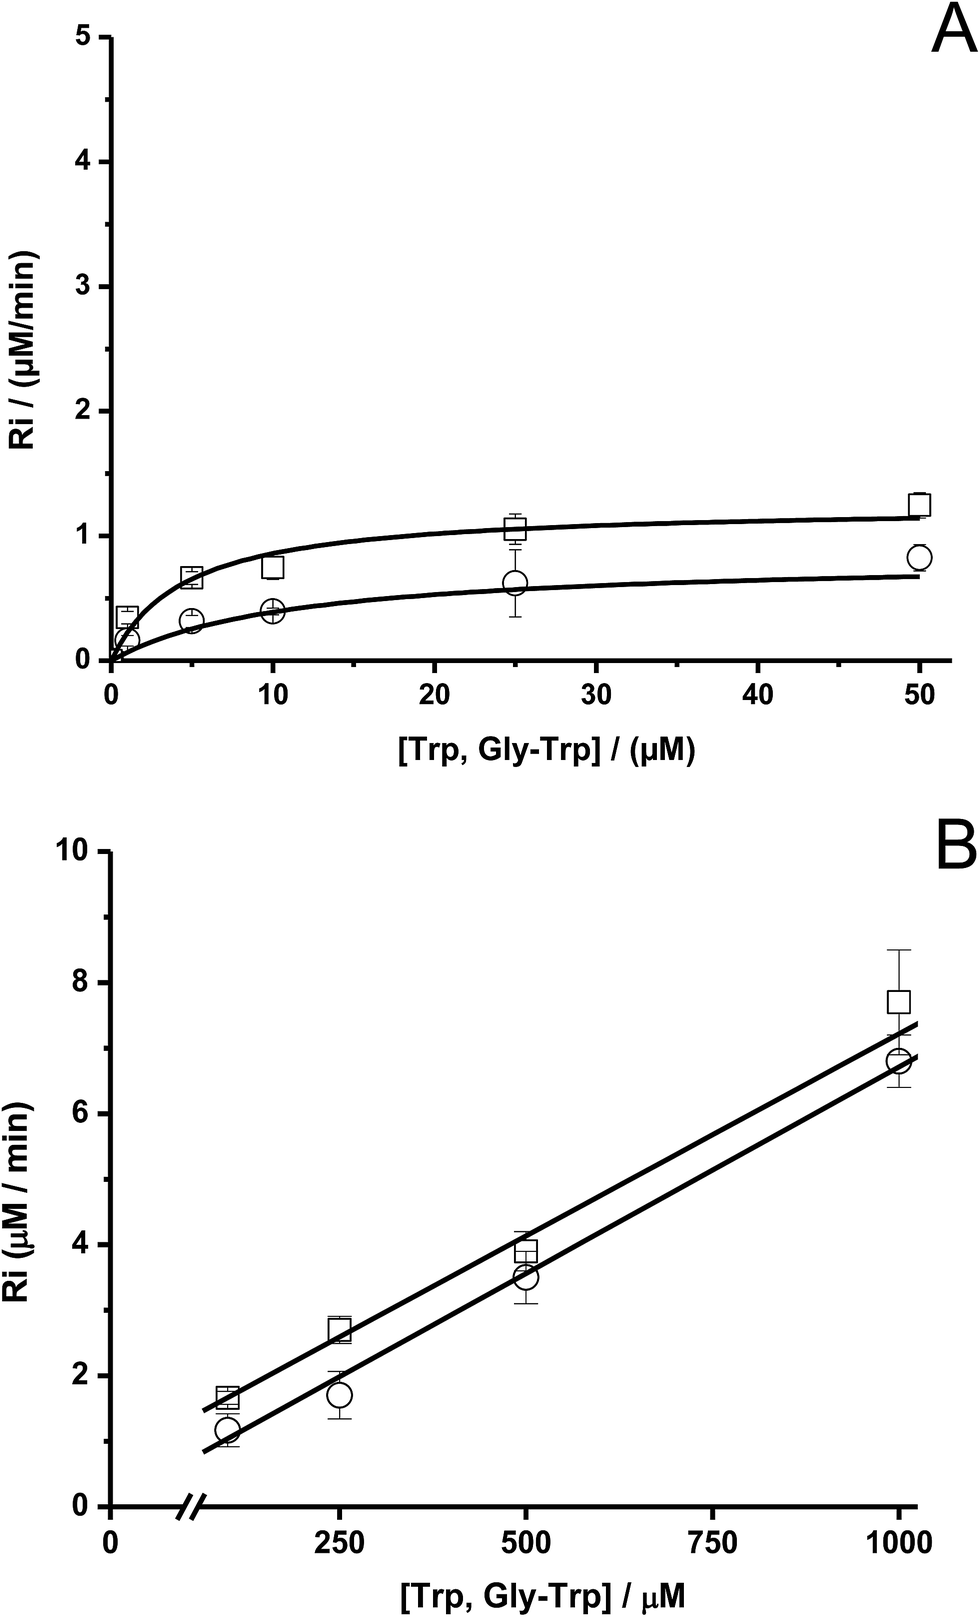 | ||
| Fig. 2 Dependence of the initial consumption rate (Ri) of free Trp (Ο)and Gly–Trp (□) with their initial concentration. Graphic (A) plot in the range of 1 and 50 μM, and graphic (B) between 100 and 1000 μM. [AAPH] = 6 mM, t° = 45 °C. | ||
The above described behaviour for Riversus initial Trp concentration was also observed for Trp–Gly, Gly–Trp–Gly, Trp–Ala, and Ala–Trp–Ala, with the Ri values for 5 μM and 1 mM substrate concentrations presented in Fig. 3A and B, respectively. Independent of the peptide examined, the Ri values were two-fold higher than those of free Trp at 5 μM (Fig. 3A), but at 1 mM each peptide had a similar Ri value to that of free Trp. In contrast the Ri values for Trp-COOMe and N-acetyl-Trp at 5 μM were not significantly different to those for free Trp (Fig. 3A).
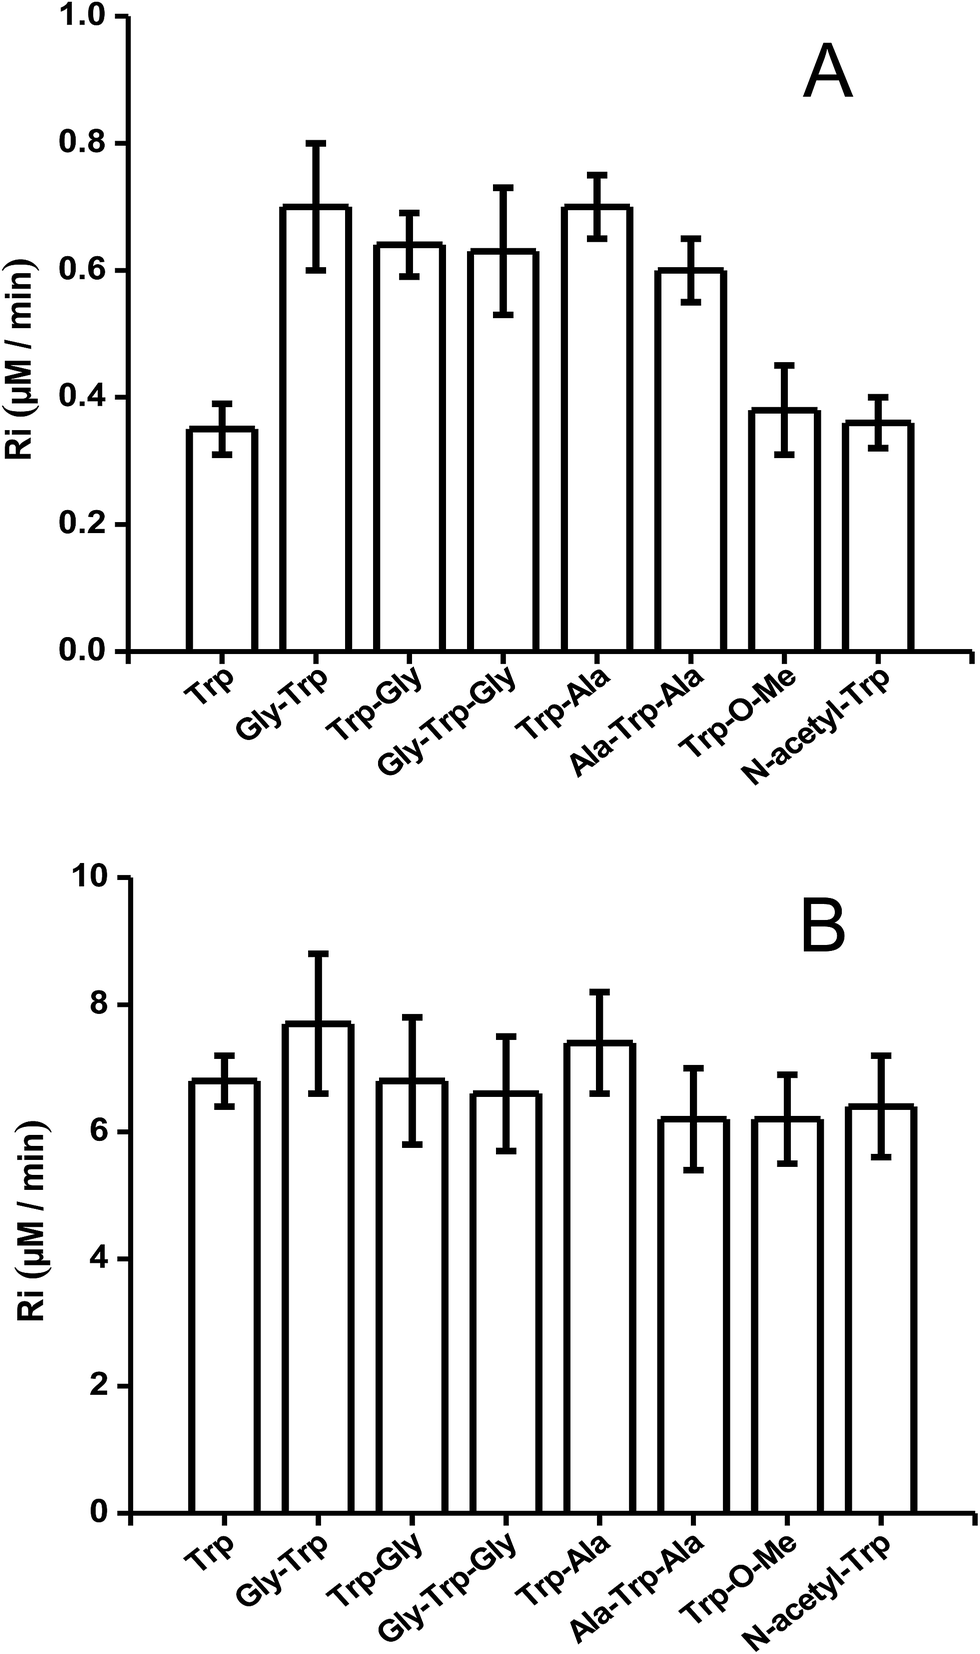 | ||
| Fig. 3 R i values of free Trp, peptides, N-acetyl-Trp, and Trp methylester. Graphic (A) at 5 μM concentration, and graphic (B) at 1 mM concentration. [AAPH] = 6 mM, t° = 45 °C. | ||
3.2 Cyclic voltammetry
To obtain further insight into the oxidation of Trp and its peptides, electrochemical (cyclic voltammetry, CV) studies were carried out. All compounds gave rise to irreversible electrochemical oxidation behavior as depicted in Fig. 4. The oxidation peak potentials (Ep) were dependent on the scan rate (between 0.02 and 0.5 V s−1), giving slope values of the ipversus log(scan rate)0.5 plots in agreement with a diffusion-controlled process. Free Trp, Trp–Ala and Trp-COOMe all showed the same Ep value (820 mV), with these being slightly lower than that for Trp–Gly (840 mV) and significantly lower than for Gly–Trp–Gly (940 mV). In contrast N-acetyl-Trp and Gly–Trp had lower Ep values (760 mV) than free Trp.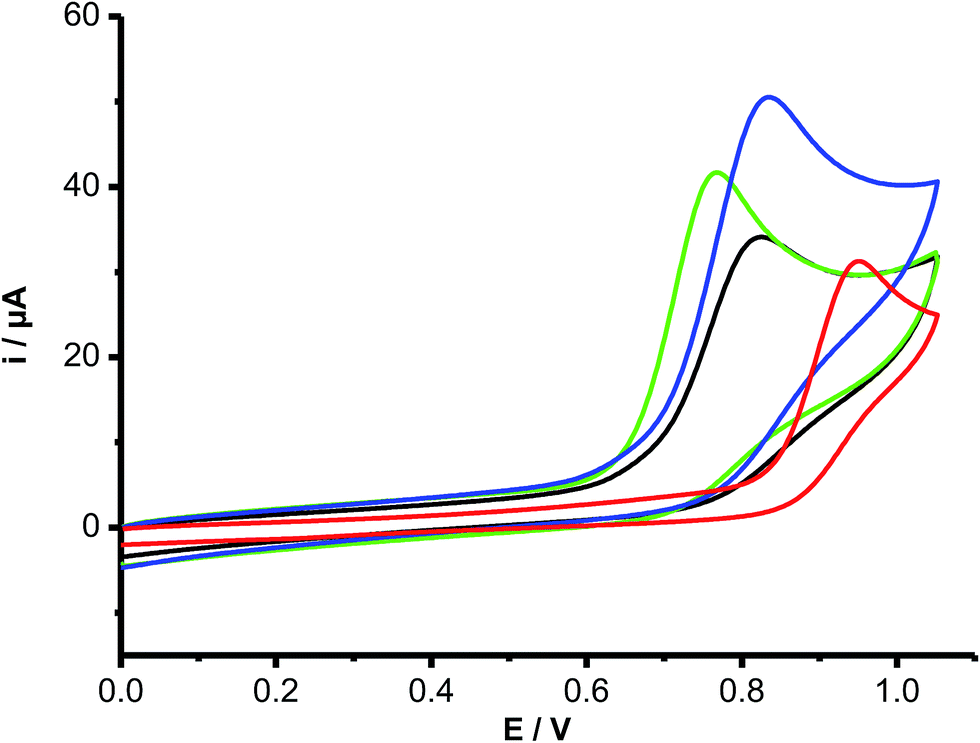 | ||
| Fig. 4 Cyclic voltammograms of free and peptide-included Trp derivatives. Free Trp (blue), Trp–Gly (black), Gly–Trp (green), and Gly–Trp–Gly (red) were incubated at 1.5 mM concentration in buffer phosphate 100 mM, pH 7.4. Voltammograms (0.5 V s−1) were registered employing a carbon vitreous working electrode, and Ag/AgCl as working and reference electrodes, respectively. | ||
3.3 Kinetic of Trp consumption included in proteins
The above kinetic studies were subsequently extended to proteins, with only proteins containing a single Trp moiety (HSA and hSOD) examined, in order to simplify analysis and minimize or eliminate complications from inhomogeneous fluorescence of different Trp residues, and intra-protein energy migration and oxidation.When solutions of HSA and hSOD were incubated in the presence of AAPH (6 mM, 45 °C) a significant decrease in the intensity of the Trp fluorescence spectrum was evident (Fig. 5). The shape of this spectrum did not change during incubation with AAPH (data not shown). After 20 min incubation, the percentage consumption of the Trp residues in hSOD and HSA was 59 and 46% respectively. From the kinetic profiles presented in Fig. 5, the initial Ri values for Trp consumption were obtained, with these being 0.17, and 0.21 μM min−1 for HSA, and hSOD, respectively (Fig. 6), and 1.7- and 2.1-fold lower than for free Trp.
 | ||
| Fig. 5 Kinetic profiles of the free and protein-included Trp consumption mediated by AAPH-derived free radicals. Solutions of Trp (○), HSA (□), and hSOD (△) were incubated in the presence of AAPH (6 mM) in phosphate buffer at 45 °C. Trp consumption was followed by fluorescence emission at 360 nm (λex = 295 nm). Protein concentration = 5 μM. | ||
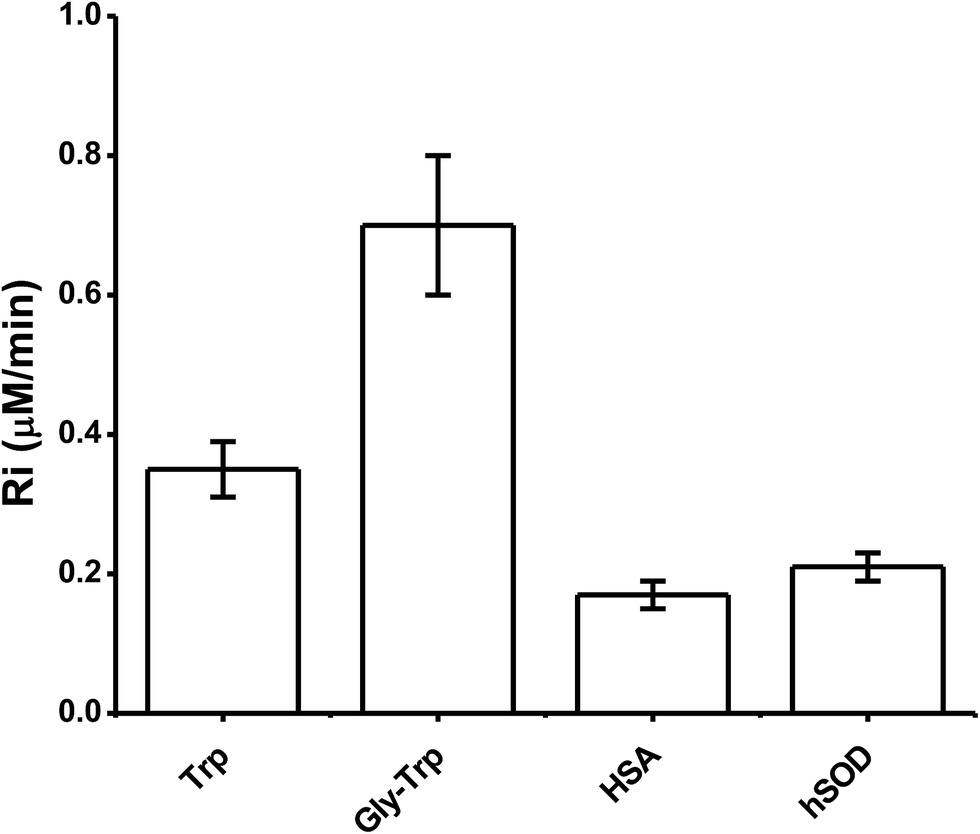 | ||
| Fig. 6 R i values of free Trp, Trp–Ala, and proteins. Ri values were obtained from kinetic data at 5 μM concentration. [AAPH] = 6 mM, t° = 45 °C. HSA = human serum albumin, hSOD = human superoxide dismutase. | ||
The dependence of Ri values with the initial concentration of has showed the same behavior as free Trp; i.e. the presence of a pseudo-plateau with a shallow gradient at intermediate concentrations, and a linear dependence at high concentrations (Fig. 7).
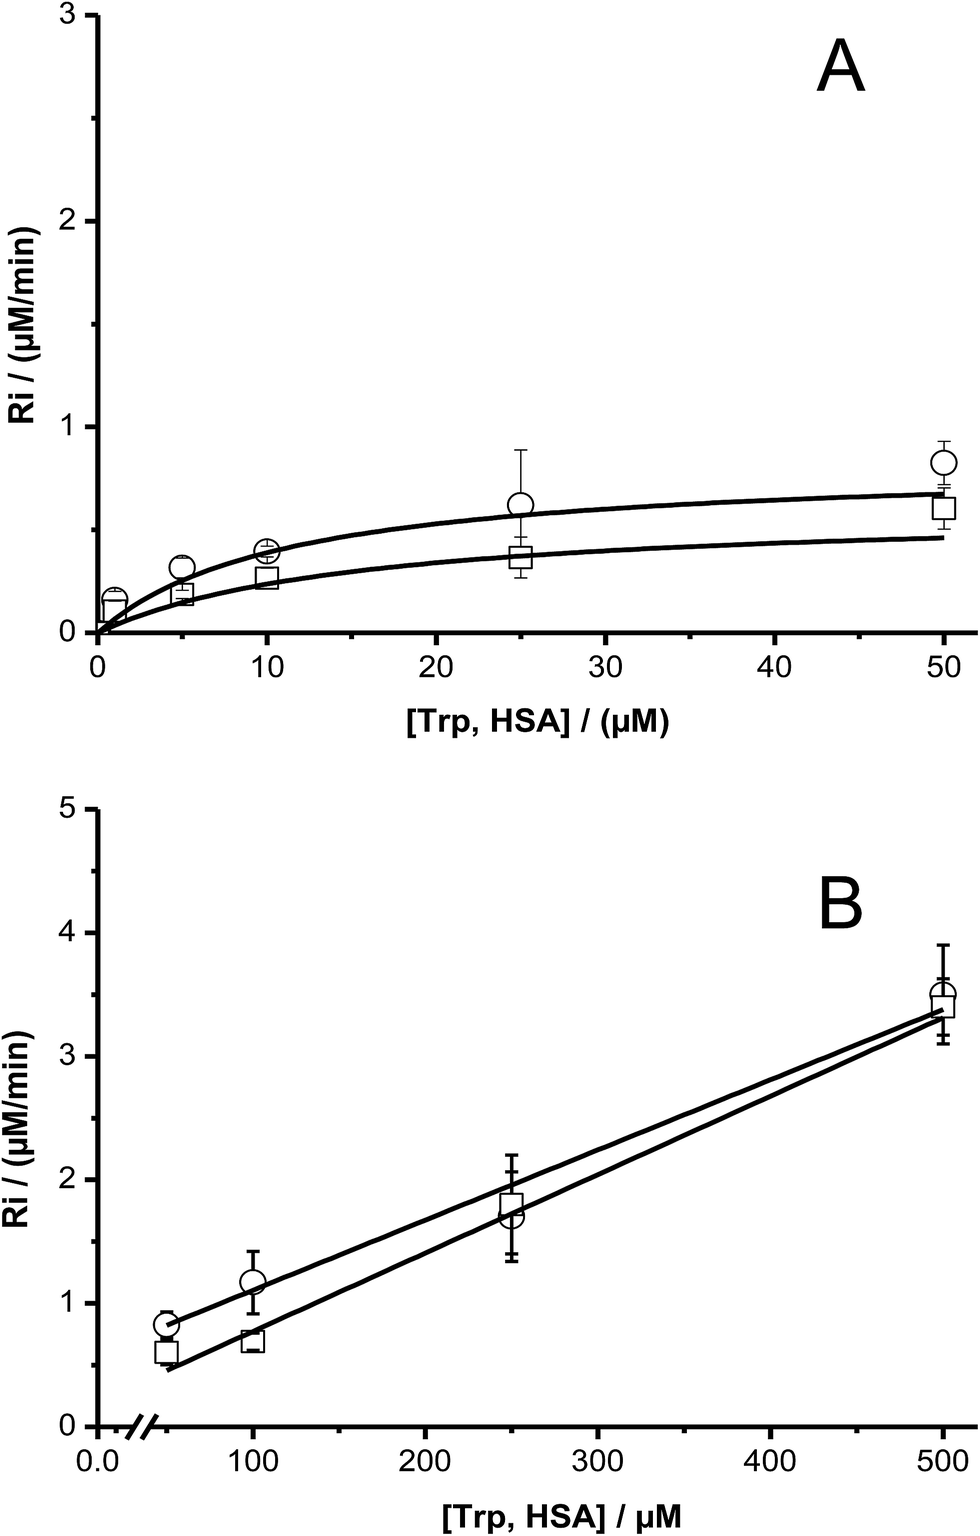 | ||
| Fig. 7 Dependence of the initial consumption rate (Ri) of free (Ο) and HSA-included (□) Trp with its initial concentration. Graphic (A) plot in the range of 1 and 50 μM, and graphic (B) between 50 and 500 μM. [AAPH] = 6 mM, t° = 45 °C. | ||
4. Discussion
Proteins are commonly exposed to ROO˙ derived from lipid peroxidation.27,28 In these reactions, ROO˙ trigger the oxidation of amino acids with Trp being one of the most susceptible species to damage.3,18 Trp oxidation has been studied extensively and considerable information is known about both the underlying mechanisms and the consequences of such oxidation for biological processes.29A limited number of studies have been carried out on the kinetics of oxidation of Trp (free, or in peptides or proteins) mediated by reactive species.7,9,16,17,30 Oxidation of Trp mediated by ROO˙ has been reported to involve initial hydrogen atom abstraction, formation of intermediate Trp peroxyl radicals, and the formation of hydroperoxides, alcohols, NFK and Kyn (amongst others) as products.5,18 These mechanism are consistent with, at low Trp concentrations, a stoichiometry of one (n, defined as the number of ROO˙ required to oxidize one molecule of Trp).5 However, at high Trp concentrations, short chain reactions have been proposed to explain n values of ∼0.3 (at 1 mM Trp).16
In this study we have assessed the reactivity of free, peptide, and protein Trp residues towards ROO˙ by use of fluorescence spectroscopy, with the rate of consumption (Ri) of these residues were determined (Fig. 1). At low Trp concentrations (5 μM) di- and tripeptides had Ri values twice those of free Trp, whereas at high concentrations (1 mM), all compounds showed similar Ri values. At 5 μM, Trp˙ generated during the oxidation of free Trp could disproportionate re-generating a Trp molecule and producing a final oxidized product. This process would give one-half of the expected Ri value. Disproportionation reactions between two Gly–Trp˙ would be difficult, giving Ri values two times higher than free Trp.
To determine if Ri was related to the redox potentials of these compounds we measured the oxidation peak potentials (Ep) of the compounds by cyclic voltammetry (Fig. 4). These experiments yielded Ep values in the order: Gly–Trp–Gly (940 mV) > Trp–Gly (840 mV) > Trp–Ala, Trp, and Trp-COOMe (820 mV) > Gly–Trp, and N-acetyl-Trp (760 mV). These values clearly do not correlate with the kinetic data for free Trp and peptide oxidation, indicating that the rate of Trp oxidation (Ri) is not related directly to the ease of oxidation of the indole ring. The variation in the Ri data may therefore relate to subsequent, or termination reactions of the Trp radical intermediates.
The dependence of Ri with Trp concentration, is shown in Fig. 2 and 7. These rates show a significant dependence on the Trp concentration, with the inclusion of Trp in peptides and proteins influencing Ri only at low substrate concentrations. Interestingly, the shape of the Riversus Trp concentration plots were similar for free Trp, and Trp included in small peptides and proteins. Overall, this behavior involves:
(i) at low Trp concentrations (1–10 μM): a linear dependence between Ri and [Trp],
(ii) at intermediate Trp concentrations (10–50 μM): nearly constant values of Ri, and
(iii) at high Trp concentrations (50 μM–1 mM): a slower increase of Ri than that expected for chain reactions.
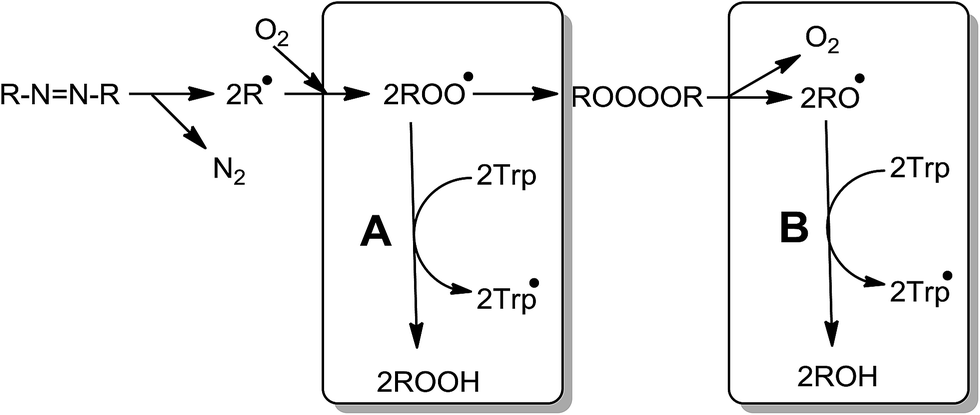
This behavior can be partly accounted for by the reactions that take place in the absence of Trp (Scheme 1).24
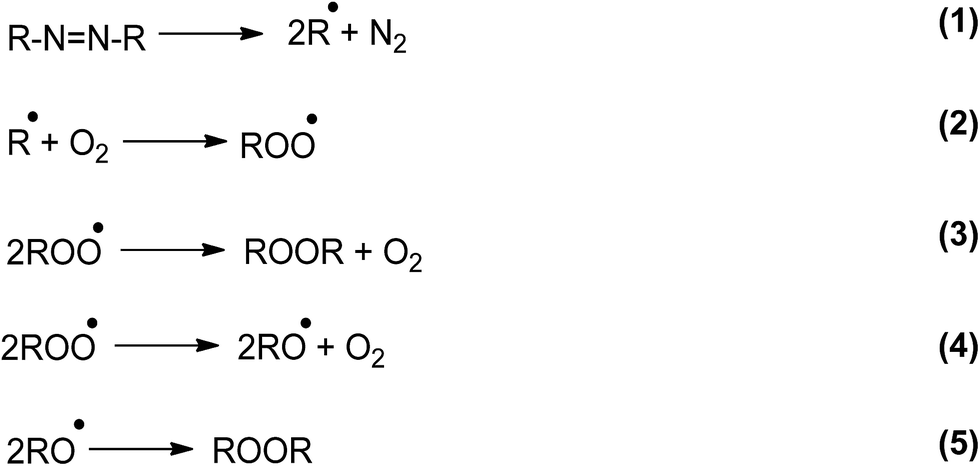 | ||
| Scheme 1 | ||
One of the most relevant aspects of this scheme is the simultaneous formation of ROO˙ and RO˙. However, in the presence of Trp, the yield of both free radicals will depend on the Trp concentration. At low Trp concentrations damage will occur via reactions of both ROO˙ and RO˙:
| RO˙ + Trp → ROH + Trp˙ | (6) |
| ROO˙ + Trp → ROOH + Trp˙ | (7) |
The rate of Trp consumption is therefore proportional to its reactivity towards both oxygenated radicals. Considering that ROO˙ are rather poor hydrogen abstractors,31 reaction [7] will be quantitatively important only if the target (e.g. Trp) includes a particularly labile H atom and/or is present at high concentrations. If these condition(s) are not fulfilled, reaction [4] transforms ROO˙ radicals in a more reactive free radical, RO˙ favoring a significant proportion of Trp consumption via reaction [6].
We observed that the Ri values of the all studied systems (free Trp, peptides and proteins) reached a plateau, i.e., the rate of the process becomes almost independent of the Trp concentration (zero order kinetic limit). This kinetic behavior is expected when all free radicals (or a type of them) are quantitatively trapped by the target substrate (free Trp, peptides or proteins). From the values of Ri determined for such plateaus the stoichiometry of the reaction (n) can be determined. In this context, a stoichiometry of reaction equal to one (n = 1), as the expected from the mechanism of Trp oxidation,5 should give a plateau at 2.4 μM min−1 in the Riversus [Trp] plots for [AAPH] = 6 mM, at 45 °C. Contrary to this expectation the data show a pseudo plateau (characterized by a small gradient) at Ri values of 0.57 μM min−1 at 25 μM Trp (Fig. 2A). This value indicates that four ROO˙ were removed for each Trp molecule (i.e. n = 4); a stoichiometry that is not in agreement with the simple scheme presented above. In this context, we have recently reported that low Ri values in the zero order kinetic limit of fluorescein could be explained by the reaction of this probe towards RO˙ arising from reaction [4].23 Consequently, we propose that at low target concentrations, the Trp is mainly oxidized by RO˙ instead of ROO˙. Thus, Trp would react with the fraction of RO˙ (fRO˙) generated from self-reactions of ROO˙. If, at low concentrations, Trp molecules react only with RO˙ (throughout a mechanism with a n = 1) a fRO˙ of 0.4 can be determined. This value is higher than reported for fluorescein, but is in line with that proposed by Werber and collaborators.24 The small slope observed in the plateau region, could be explained if the fRO˙ is not constant in the range of the Trp concentration studied (Fig. 2A). Therefore, as the Trp concentration increases, fRO˙ decreases, with increasing contributions from reaction [7].
At high Trp concentrations, the reported Ri values can be explained by the occurrence of short chain reactions. Thus at Trp concentrations greater than 50 μM, our results showed a linear dependence of Ri values with Trp concentration (Fig. 2B) such that at the highest concentration (1 mM), a Ri value of 6.8 μM min−1 was determined with n = 0.34 (Fig. 2B). Such behavior is not fulfilling with the expected for chain reactions, but could be explained by a change of the reactive species involved in the oxidation of Trp or a more complex mechanism. Thus, RO˙ reactions may be relevant at low Trp concentrations, but at high concentrations, both and RO˙ and ROO˙ as well as short chain reactions (reactions [7]–[9]) involving a mixture of reactive species are involved; these may involve further free radical species arising from decomposition of Trp-OOH.8
| Trp˙ + O2 → Trp-OO˙ | (8) |
| TrpOO˙ + Trp → Trp-OOH + Trp˙ | (9) |
Additionally, Ri values at high Trp concentrations would be also influenced by changes in the termination reaction of the intermediates indicated above, however, this is unlikely to contribute by more than a factor two to the Trp consumption.
To study Trp oxidation in proteins, we selected two proteins with a single Trp; hSOD, and HSA. The former protein contains an exposed Trp residue at position 32, while the Trp residue of HSA is located in a hydrophobic pocket at position 214.32,33 Since proteins have other amino acid capable to react towards ROO˙, we expected Ri values considerably lower than determined for free Trp. Surprisingly, data obtained from these proteins (Fig. 6) yielded Ri values only 2.0 (for HSA) and 1.7 (for hSOD) times lower than free Trp. This data indicate means that independent of the position of the Trp residues in these proteins, their reactivity towards AAPH-derived free radicals appears to be of the same order of magnitude as free Trp. Furthermore, the shape of the Riversus [Trp] plots was similar to that free Trp and peptides showing the presence of short chain reactions at high protein concentrations (Fig. 7). In fact, at 500 μM a value of 0.7 was determined, implying that 0.7 moles of free radicals were consumed per mole of Trp residues. This result is in agreement with chain reactions of Trp oxidation in other proteins such as lysozyme and cytolysin St I.16,34
As a whole, our results show by first time that the reactive species involved in the oxidation of Trp mediated by AAPH-derived free radicals depends on the experimental conditions. At low concentrations, the oxidation of Trp is mostly mediated by RO˙ derived from self-reactions of ROO˙ (Scheme 2, pathway B). Only at high Trp concentrations, the reaction towards ROO˙ starts to be relevant (Scheme 2, pathway A). The relevance of RO˙ or ROO˙ also depend on the ratio between the steady state concentration of ROO˙ ([ROO˙]ss) and Trp concentration ([ROO˙]ss/[Trp]). If such ratio is high, pathway (B) of Scheme 2 would be the principal pathway of Trp oxidation, on the contrary, if the ratio is low, pathway (A) would explain the Trp oxidation.
 | ||
| Scheme 2 | ||
5. Conclusions
The kinetics of Trp oxidation by AAPH-derived radicals are complex and are influenced not only by the reactivity of this species towards ROO˙, but also by contributions from RO˙, short chain reactions and also different termination reactions, depending on the Trp concentration. The initial rates of Trp consumption are slightly influenced by the inclusion of the free amino acids into small peptides and proteins, with Riversus Trp concentration plots showing the same profile for free, peptide and protein-included Trp. Thus when AAPH is employed as a radical source, analysis of kinetic behavior can be highly complex as a result of the generation of alkoxyl and peroxyl radicals in varying amounts depending on the target concentration.Acknowledgements
Fondecyt grants no. 1141142 and 3140307. FONDEQUIP (EQM 120065). Eduardo Fuentes Lemus and Elizabeth Escobar acknowledge CONICYT and Vicerrectoría de Investigación (VRI), Pontificia Universidad Católica de Chile. MJD gratefully acknowledges financial support from the Novo Nordisk Foundation (Laureate grant: NNF13OC0004294). E. Lissi acknowledges DICYT (Universidad de Santiago de Chile). Authors acknowledge to Dra. Beatriz Álvarez (Universidad de la República, Uruguay) by her contribution in the expression and purification of hSOD.REFERENCES
- K. Itakura, K. Uchida and S. Kawakishi, Chem. Res. Toxicol., 1994, 7, 185–190 CrossRef CAS PubMed.
- E. R. Stadtman, Annu. Rev. Biochem., 1993, 62, 797–821 CrossRef CAS PubMed.
- M. J. Davies, Biochim. Biophys. Acta, 2005, 1703, 93–109 CrossRef CAS PubMed.
- L. P. Candeias, P. Wardman and R. P. Mason, Biophys. Chem., 1997, 67, 229–237 CrossRef CAS PubMed.
- A. Aspee and E. Lissi, Luminescence, 2000, 15, 273–282 CrossRef CAS PubMed.
- M. Friedman and J. L. Cuq, J. Agric. Food Chem., 1988, 36, 1079–1093 CrossRef CAS.
- M. K. Krogull and O. Fennema, J. Agric. Food Chem., 1987, 35, 66–70 CrossRef CAS.
- M. Gracanin, C. L. Hawkins, D. I. Pattison and M. J. Davies, Free Radical Biol. Med., 2009, 47, 92–102 CrossRef CAS PubMed.
- T. J. Simat and H. Steinhart, J. Agric. Food Chem., 1998, 46, 490–498 CrossRef CAS PubMed.
- E. Niki, Methods Enzymol., 1990, 186, 100–108 CAS.
- A. Arenas, C. Lopez-Alarcon, M. Kogan, E. Lissi, M. J. Davies and E. Silva, Chem. Res. Toxicol., 2013, 26, 67–77 CrossRef CAS PubMed.
- A. Aspee and E. Lissi, J. Protein Chem., 2001, 20, 479–485 CrossRef CAS PubMed.
- N. N. Chen, M. M. Zhao and W. Z. Sun, Food Chem., 2013, 141, 3224–3229 CrossRef CAS PubMed.
- R. T. Dean, J. V. Hunt, A. J. Grant, Y. Yamamoto and E. Niki, Free Radical Biol. Med., 1991, 11, 161–168 CrossRef CAS PubMed.
- H. Y. Kwon, S. Y. Choi, M. H. Won, T. C. Kang and J. H. Kang, Biochim. Biophys. Acta, 2000, 1543, 69–76 CrossRef CAS.
- E. Lissi and N. Clavero, Free Radical Res. Commun., 1990, 10, 177–184 CrossRef CAS PubMed.
- C. Lopez-Alarcon, C. Rocco, E. Lissi, C. Carrasco, J. A. Squella, L. J. Nunez-Vergara and H. Speisky, Pharm. Res., 2005, 22, 1642–1648 CrossRef CAS PubMed.
- C. Lopez-Alarcon, A. Arenas, E. Lissi and E. Silva, Biomol. Concepts, 2014, 5, 119–130 CAS.
- W. Wu, C. M. Zhang, X. Z. Kong and Y. F. Hua, Food Chem., 2009, 116, 295–301 CrossRef CAS.
- L. Zheng, H. Z. Dong, G. W. Su, Q. Z. Zhao and M. M. Zhao, Food Chem., 2016, 197, 807–813 CrossRef CAS PubMed.
- J. Zhang and D. S. Kalonia, AAPS PharmSciTech, 2007, 8, E1–E8 CrossRef PubMed.
- R. L. Jensen, J. Arnbjerg and P. R. Ogilby, J. Am. Chem. Soc., 2012, 134, 9820–9826 CrossRef CAS PubMed.
- E. Dorta, E. Fuentes-Lemus, A. Aspee, E. Atala, H. Speisky, R. Bridi, E. Lissi and C. Lopez-Alarcon, RSC Adv., 2015, 5, 39899–39902 RSC.
- J. Werber, Y. J. Wang, M. Milligan, X. H. Li and J. Ji, J. Pharm. Sci., 2011, 100, 3307–3315 CrossRef CAS PubMed.
- B. Álvarez, V. Demicheli, R. Duran, M. Trujillo, C. Cervenansky, B. A. Freeman and R. Radi, Free Radical Biol. Med., 2004, 37, 813–822 CrossRef PubMed.
- P. K. Smith, R. I. Krohn, G. T. Hermanson, A. K. Mallia, F. H. Gartner, M. D. Provenzano, E. K. Fujimoto, N. M. Goeke, B. J. Olson and D. C. Klenk, Anal. Biochem., 1985, 150, 76–85 CrossRef CAS PubMed.
- M. Obando, A. Papastergiadis, S. Li and M. B. De, J. Agric. Food Chem., 2015, 63, 9820–9830 CrossRef CAS PubMed.
- K. M. Schaich and M. Karel, Lipids, 1976, 11, 392–400 CrossRef CAS PubMed.
- E. R. Stadtman and R. L. Levine, Ann. N. Y. Acad. Sci., 2000, 899, 191–208 CrossRef CAS PubMed.
- E. Lissi, M. Faure and N. Clavero, Free Radical Res. Commun., 1991, 14, 373–384 CrossRef CAS PubMed.
- G. R. Buettner, Arch. Biochem. Biophys., 1993, 300, 535–543 CrossRef CAS PubMed.
- F. R. Coelho, A. Iqbal, E. Linares, D. F. Silva, F. S. Lima, I. M. Cuccovia and O. Augusto, J. Biol. Chem., 2014, 289, 30690–30701 CrossRef CAS PubMed.
- T. Peters Jr, All about albumin, Elsevier, San Diego, 1995 Search PubMed.
- A. M. Campos, E. Lissi, C. Vergara, M. E. Lanio, C. Alvarez, I. Pazos, V. Morera, Y. Garcia and D. Martinez, J. Protein Chem., 1999, 18, 297–306 CrossRef CAS PubMed.
| This journal is © The Royal Society of Chemistry 2016 |