Synthesis and effects of oxadiazole derivatives on tyrosinase activity and human SK-MEL-28 malignant melanoma cells

Mohd Fadhlizil Fasihi Mohd Aluwi a, Kamal Rullahab, Tan Huan Huanc, Chan Kok Mengc, Tan Si Jiea, Leong Sze Weid, Ahmad Hasnan Mansora, Bohari M. Yamine and Lam Kok Wai*a
aDrugs and Herbal Research Centre, Faculty of Pharmacy, Universiti Kebangsaan Malaysia, Jalan Raja Muda Abdul Aziz, 50300 Kuala Lumpur, Malaysia. E-mail: david_lam@ukm.edu.my
bSekolah Tinggi Ilmu Farmasi Riau, Universitas Riau, Kampus Bina Widya Km 12.5, Simpang baru-Pekanbaru, Indonesia
cToxicology Laboratory, Faculty of Health Sciences, Universiti Kebangsaan Malaysia, Jalan Raja Muda Abdul Aziz, 50300 Kuala Lumpur, Malaysia
dInstitute of Bioscience, Universiti Putra Malaysia, Serdang, 43400, Selangor, Malaysia
eSchool of Chemical Sciences and Food Technology, Universiti Kebangsaan Malaysia, Bangi, 43600, Selangor, Malaysia

Received 17th May 2016 , Accepted 24th July 2016

First published on 25th July 2016


Abstract

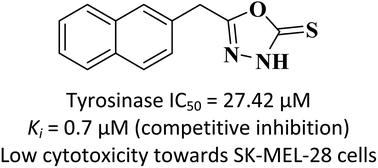
Melanin is a form of pigment that gives colour to human skin, hair and eyes. Whilst it protects against skin damage from the sun, accumulation of excessive amounts of epidermal melanin can lead to various dermatological disorders. This study aimed to evaluate the effects of three selected oxadiazoles on the o-diphenolase mushroom tyrosinase activity and their cytotoxic effects on SK-MEL-28 malignant melanoma cells. The results showed that compounds 1, 2 and 3 exhibited significant inhibition on the diphenolase activity of mushroom tyrosinase with IC50 values of 40.46 μM, 27.42 μM and 32.51 μM, respectively. Further kinetic studies revealed that compounds 1 (Ki = 3.8 μM) and 3 (Ki = 3.9 μM) exhibited a mixed-type inhibition while compound 2 (Ki = 0.7 μM) displayed a competitive-type inhibition as suggested by the Lineweaver–Burk plots. Molecular docking and dynamics simulations were also performed to understand the binding behaviour of compound 2 in the active site of tyrosinase. Finally, all three compounds displayed relatively low cytotoxicity to SK-MEL-28 cells up to 100 μM treatment via MTT assay.


Introduction

Melanin is synthesized via a biochemical process known as melanogenesis. It is responsible for skin colour and plays an important role in protecting the skin from ultraviolet sunlight damage. However, accumulation of excessive amounts of epidermal melanin can lead to various dermatological disorders including melasma, age spots, freckles and sites of actinic damage.1,2 In order to prevent hyperpigmentation, regulation of melanin synthesis by inhibiting the tyrosinase activity has become a current research topic. The treatment usually involves the application of medicines or medicinal cosmetics, which contain depigmenting agents or skin-whitening agents.

One example of a famous depigmenting agent is hydroquinone. It is commonly found in skin-bleaching creams used to treat post-inflammatory hyper-pigmentation and other skin disorders such as melasma and solar lentigines. It has been produced in the USA for over fifty-five years in various over-the-counter (OTC) and prescription formulations.3 In spite of this, the use of hydroquinone has led to a number of unfavourable adverse effects such as skin irritation, contact dermatitis and exogenous ochronosis especially in dark-skinned people. On the other hand, corticosteroids which are commonly available in the form of topical agents are known to be less effective and likely to cause local or systemic side effects after long-term use.4 In addition, researchers have been actively looking towards natural compounds with the aim of finding a novel inhibitor for treating skin problem e.g. hyperpigmentation. Unfortunately, compounds isolated from natural products still lack of individual activity or insufficient to be put into practical use or safety regulations of food additives, thus limit their use in vivo system.5

1,3,4-Oxadiazole belongs to the heterocyclic compounds which have been shown to display a broad range of biological activities including antitumoral, antimicrobial, anti-inflammatory and analgesic activities.6–10 In fact, oxadiazoles display good metabolic profile and could serve as bioisosteres of amides and ester that can significantly enhance the pharmacokinetic profile of a molecule.11,12 Besides, the presence of an oxadiazole ring could increase the lipophilicity properties of a molecule to cross the lipid transmembrane layer.13 Oxadiazoles can also easily participate in hydrogen bonding interactions therefore contributing to higher ligand binding affinity. Moreover, recent reports showed that this class of compounds could exhibit potent tyrosinase inhibition.14–16 Considering the fact that the potential of oxadiozole as tyrosinase inhibitory agent has yet to be thoroughly investigated, it remains an inspiration for our group to explore further. To initiate this study, we synthesized three synthetic oxadiazoles and investigated their effects on tyrosinase activity and cell viability of SK-MEL-28 malignant melanoma cells.

Experimental

Materials and methods

Reagents and chemicals used in this experiment were purchased from Sigma-Aldrich, Merck, and Acros Organics and used without further purification. Mushroom tyrosinase and L-DOPA were obtained from Roche Diagnostics, Sigma Aldrich and Calbiochem. A typical work-up included washing with brine and drying the organic layer with anhydrous magnesium sulfate before concentration in vacuo. Mass spectra was measured on Thermo Finnigan POLARIS Q spectrometer, with ionization induced by electron impact at 70 eV. Nuclear magnetic resonance spectra was recorded in CDCl3, CD3OD or DMSO-d6 using a Varian 500 MHz NMR Spectrometer. Melting points were determined on STUART SMP10 melting point apparatus. Normal phase column chromatography was performed using silica gel 60 Merck 7734 (70–230 mesh ASTM). Analytical TLC was carried out on silica gel F254 precoated (0.2 mm thickness, Merck) on aluminium sheets. The high resolution mass (HR-MS) was obtained from direct injection ESI-MS using Daltonic Bruker micrOTOF-Q (Bruker, Germany) using electrospray ionization (ESI) in positive mode.

General procedure for synthesis of compounds 1 and 2

To a suspension of 2-(naphthalen-1-yl)acetic acid or 2-(naphthalen-2-yl)acetic acid (10 mmol) in methanol, 1 ml of concentrated sulfuric acid was added dropwise followed by 4 h reflux. Upon completion, the mixture was concentrated in vacuo and extracted with EA. The EA layer was concentrated to afford ester product. To a 10 mmol of the ester product solution in 5 ml of absolute ethanol, hydrazine monohydrate (12 mmol) was added. The mixture was refluxed for 4 h and finally concentrated in vacuo. The colorless crystals formed were filtered to afford hydrazides. A mixture of hydrazide (10 mmol) in 20 ml of absolute ethanol, carbon disulphide (15 mmol) and KOH (12 mmol) were added and refluxed for 6 h to afford potassium dithiocarbazates. Potassium dithiocarbazate salts (10 mmol) from the above procedure were treated with concentrated hydrochloric acid. The precipitate formed was filtered and recrystallized. (1) Brown solid. Mp 172–173 °C. 1H NMR (500 MHz, DMSO) δ 7.71 (d, J = 8.2 Hz, 1H), 7.61 (d, J = 8.7 Hz, 1H), 7.56 (d, J = 7.9 Hz, 1H), 7.26–7.12 (m, 4H), 4.25 (s, 2H). 13C NMR (126 MHz, DMSO) δ 177.87, 163.06, 133.53, 131.39, 129.56, 128.75, 128.46, 128.16, 126.75, 126.19, 125.77, 123.71, 28.86. ESI-HRMS: (C13H10N2OS) calc. [M + H] 243.3040, found 243.3029. (2) Pale yellow solid. Mp 138–139 °C. 1H NMR (500 MHz, DMSO) δ 7.61, 7.60, 7.59, 7.59, 7.57, 7.55, 7.23, 7.22, 7.21, 7.20, 7.19, 7.15, 7.13, 3.99. 13C NMR (126 MHz, DMSO) δ 178.05, 163.11, 133.09, 132.27, 131.18, 128.53, 127.85, 127.73, 127.69, 127.20, 126.64, 126.33, 31.37. ESI-HRMS: (C13H10N2OS) calc. [M + H] 243.3040, found 243.3033.

General procedure for synthesis of compound 3

The oxadiazole (2) (5 mmol) was then dissolved in a mixture of ethanol and dioxane (2[thin space (1/6-em)]:[thin space (1/6-em)]1, v/v) followed by the addition of formaldehyde (37%, 0.25 ml) and secondary amine (5 mmol) to afford the target product. (3) Colorless crystals. Mp 98–99 °C. 1H NMR (500 MHz, DMSO) δ 7.85 (dd, J = 13.3, 10.9 Hz, 1H), 7.80 (s, 1H), 7.51–7.43 (m, 1H), 7.40 (d, J = 8.9 Hz, 1H), 4.83 (s, 1H), 4.25 (s, 1H), 2.57 (s, 1H), 1.58–1.18 (m, 2H). 13C NMR (126 MHz, DMSO) δ 178.38, 161.49, 133.36, 132.51, 128.77, 128.00, 127.92, 127.40, 126.90, 126.55, 71.00, 51.32, 31.61, 25.77, 23.68. ESI-HRMS: (C19H21N3OS) calc. [M + H] 340.4650, found 340.4642.

Bioassay

Tyrosinase inhibitory activity studies. The tyrosinase assay was performed based on the method below. The compounds were first dissolved in absolute ethanol and used in the experiments and were preliminary assayed at 50 μM. The pre-incubation of the mixture consisted of 68 μl of 0.1 M (pH 6.8) buffer solution + 30 μl of tyrosinase enzyme solutions (200 units per ml) and 2 μl of compounds was each inserted into the 96-well tissue culture plates. The mixture was then pre-incubated at 25 °C for 1 minute. Then, 0.1 ml of 6 mM L-DOPA was added into the wells. Immediately, the enzyme activity was monitored by dopachrome formation at 475 nm for 10 minutes to measure the initial rate as a linear increase. The value in the absence from the compound was represented as the control. Kojic acid was used as positive control. Final concentrations of DMSO (1%) did not interfere with enzyme activity. Percentage inhibition was calculated based on the ability of compounds to inhibit tyrosinase activity compared with the control (media without compounds and DMSO), which was considered as 0% inhibition. The IC50 was determined by non-linear regression plot using GraphPad.
Michaelis–Menten kinetic studies. In a 96-well plate, 2 μl of different concentrations of compound 1/2/3 was mixed with 100 μl of L-DOPA (1, 2, 3, 4, 5 and 6 mM). Subsequently, 30 μl of mushroom tyrosinase 250 units per ml was added and the formation of dopachrome in the solution was monitored for 10 min by measuring absorbance at 475 nm. The reaction was performed at a constant temperature of 25 °C. All experiments were conducted in triplicate. The inhibition mechanism was evaluated using Lineweaver–Burk plots, and the inhibition constants were estimated from the second plots of the apparent 1/Vmax and Km/Vmax against the inhibitor concentration, as described in ref. 17.
MTT cytotoxicity studies. SK-MEL-28 cells were seeded in 96-well microplate at the concentration of 5 × 10⁴ cells per ml in a volume of 200 μl per well. The seeded cells were incubated under 5% CO2 at 37 °C for 24 hours. The cells were then treated with compounds 1, 2 and 3 respectively at the final concentrations of 6.25 μM, 12.5 μM, 25 μM, 50 μM and 100 μM. After 24 hours incubation, 20 μl of 5 mg ml−1 MTT solution was added to the treated cells and further incubated for 4 hours at 37 °C. Subsequently, the total medium in each well was discarded and the crystalline formazan was solubilised using 200 μl DMSO. For complete dissolution, the plate was incubated for 15 minutes followed with gentle shaking for 5 minutes. The cytotoxicities of the compounds were assessed by measuring the absorbance of each well at 570 nm. Mean absorbance for each compound concentration was expressed as a percentage of vehicle control absorbance and plotted versus compound concentration. The IC50 represents the compound concentration that reduced the mean absorbance at 570 nm to 50% of those in the vehicle control wells.
Computational studies.
Molecular docking and dynamics simulation. The 3D crystal structure of tyrosinase (PDB ID 2Y9W (2.30 Å)) was retrieved from RCSB Protein Data Bank (http://www.rcsb.org.pdb).18 Addition of hydrogen atoms, removal of water molecules, insertion of missing loops, introduction of CHARMm forcefield and fixation of protonation state were performed using Accelrys Discovery Studio 3.1. The ligand binding site was identified based on the position of copper-binding site and the literature review. The inhibitors were then docked to the binding site using the in-house CDOCKER protocol. Different conformations were generated for each ligand through high temperature molecular dynamics. The ligands were heated to a temperature of 700 K in 2000 steps followed by 300 K cooling temperature and then subjected to refinement by grid-based (GRID 1) simulated annealing and full force minimization after random rotation. The ligands were allowed to flex while the receptor was held rigid during refinement process. The generated ligand conformations were clustered according to their binding interactions. Finally, the ligand conformation with the highest – CDOCKER interaction energy and – CDOCKER energy was chosen for further dynamic simulation.

Molecular dynamics simulation was performed with GROMACS 5.0.4 package, employing the GROMOS96 53a6 force field.19 Protonation states of ionizable residues were chosen based on their most probable state at pH 7. To maintain the coordination of Cu2+ with the histidine residues in the active site, a special position restraint was applied during all MD simulation steps. The ligand–protein complex was energy relaxed using the steepest descent energy minimization algorithm. The complex was then immersed in a dodecahedron-shaped box with the minimum distance of 1 nm between the protein surface and the box walls. The starting structures were solvated in extended simple point charge (SPC/E) water. The system net charge was also neutralized by the adding of Na+ counter ions which were randomly substituted by water molecules. MD simulations were performed using the LINCS algorithm to constrain bond lengths and periodic boundary conditions were applied in all directions.20 Long range electrostatic forces will be treated using the fast particle-mesh Ewald method (PME).21 van der Waals forces and Coulomb potential were treated using a cut-off of 0.9 nm and the simulation time step was set to 2 fs. An initial velocity obtained according to a Maxwell distribution at 300 K is given to all the atoms. During the simulation, Parrinello–Rahman pressure and Nose–Hoover temperature couplings were set at 1 bar and 300 K with a coupling time of τP = 2 ps and τT = 0.1 ps, respectively. The production run was set for 10 ns at constant pressure and temperature conditions.

Results and discussion

Chemistry

Compounds 1 and 2 were synthesized according to Scheme 1.16 First, the naphthyl acetic acid was dissolved in methanol and was converted into a methyl ester in the presence of a catalytic amount of hydrochloric acid. The ester was then mixed with hydrazine monohydrate in absolute ethanol and refluxed for 2 hours. The hydrazides were filtered and further dissolved in ethanol and mixed with carbon disulphide and KOH. The formation of potassium dithiocarbazates salts were complete after 6 hours of reflux followed by titrating with concentrated hydrochloric acid. The formation of white solids were then filtered and subjected to simple purification by recrystallizing in absolute ethanol to afford compounds 1 and 2 in reasonable yields. Finally, compound 3 was prepared by simple Mannich reaction as shown in Scheme 2. The purity of the compounds was monitored by HPLC analysis.
image file: c6ra12754a-s1.tif
Scheme 1 Synthesis of compounds 1 and 2. Reagents and reaction conditions: (i) methanol, H2SO4, reflux, 4 h; (ii) NH2NH2·H2O, acetic acid, ethanol, reflux, 4 h; (iii) CS2, KOH, ethanol, reflux, 6 h; (iv) HCl, cold distilled water.

image file: c6ra12754a-s2.tif
Scheme 2 Synthesis of compound 3. Reagents and reaction conditions: (i) piperidine, formaldehyde, dioxane, ethanol.

Effect on tyrosinase activity

Compound 2 exhibited higher tyrosinase inhibition with IC50 value of 27.42 μM as compared to both kojic acid (IC50 value = 44.55 μM) and compound 1 (IC50 value = 40.46 μM). Even though the inhibition displayed by 2 was less potent than tropolone, it is interesting to note that the position of the naphthyl ring is highly crucial for the inhibition. A lower potency was observed when the oxadiazole ring was shifted to the α-position (1). To determine the significance of the oxadiazole ring to the inhibition, we repeated the experiments using rhodanine and 2-mercapto-1-methylimidazole under similar condition since both compounds are structurally comparable to the oxadiazole ring. Surprisingly, both 2-mercapto-1-methylimidazole and rhodanine were only able to exhibit weak to moderate inhibition with IC50 values of 207.30 μM and 79.43 μM. This suggests that the presence of naphthyl ring is again important and likely to increase the binding affinity of the compound to tyrosinase binding site through van der Waals and other hydrophobic interactions. Removing the oxadiazole ring would diminish the inhibition as shown in Table 1 since both the starting materials, 2-(naphthalen-1-yl)acetic acid and 2-(naphthalen-2-yl)acetic acid used were inactive even when tested at high concentration of 1 mM. There is a possibility that the position of the naphthyl ring might influence the electron movement in the oxadiazole ring affecting particularly the charge of the sulfur atom in the thione moiety. Reports have shown that the thione moiety could potentially disrupt the hydroxo-bridge present in the Cu(II)–Cu(II) enzyme by metal chelating effects.22 In a similar study conducted by Lin et al., the charge of atom oxygen of compounds α-naphthol and β-napthol were almost equal suggesting that charge difference was not the main contributing factor for the difference in inhibition potency.23 This observation corroborates with our results, in which the sulfur atom of compounds 1 and 2 carry similar partial charges of −0.163 and −0.162 as retrieved from the quantum mechanics calculation.
Table 1 The IC50 and inhibition constant for selected inhibitors and synthesized oxadiazole compounds on o-dihydroxyphenolase activity of mushroom tyrosinasea,d
Compound IC50 (μM) Inhibition type Equilibrium constants (M)
Ki Ki
a n.a. not available.b Refer to ref. 24.c Refer to ref. 27.d Ki is the equilibrium constant for an inhibitor binding to tyrosinase, and Ki is the equilibrium constant for an inhibitor binding to L-DOPA–tyrosinase complex.
Kojic acid 44.55 Mixed-type 1.98 × 10⁻⁶ 10.97 × 10⁻⁶
Rhodanine 79.43 Mixed-type 14.01 × 10⁻⁶ 32.83 × 10⁻⁶
2-Mercapto-1-methylimidazole 207.30 Mixed-typeb 4.60 × 10⁻⁶b n.a
Tropolone 0.40 Mixed-typec 1.5 × 10⁻⁵c n.a
2-(Naphthalen-1-yl)acetic acid >1000
2-(Naphthalen-2-yl)acetic acid >1000
1 40.46 Mixed-type 3.842 × 10⁻⁶ 38.96 × 10⁻⁶
2 27.42 Competitive 0.666 × 10⁻⁶
3 32.51 Mixed-type 3.887 × 10⁻⁶ 14.80 × 10⁻⁶


To determine the inhibition type and inhibition constant of the compounds, enzyme kinetic studies were carried out. The concentrations of enzyme and L-DOPA were kept constant while the concentration of the inhibitors was varied. Under these experimental conditions, the oxidation of L-DOPA to o-dopaquinone was shown to follow the Michaelis–Menten kinetics. Their mode of inhibition is represented using the Lineweaver–Burk plots as depicted in Fig. 1, 2 and 3. The equilibrium constant for inhibitor binding with free enzyme, Ki, and the enzyme–substrate complex, Ki were determined from the second plots of the apparent Km/Vmax (Kmapp/Vmaxapp) and 1/Vmax (1/Vmaxapp) versus inhibitor concentrations.24 The inhibition constants are listed in Table 1 for comparison. For compound 2, only Ki was obtained as it only binds to the free enzyme.


image file: c6ra12754a-f1.tif
Fig. 1 Lineweaver–Burk plots for inhibition of compound 1 on the oxidation of L-DOPA by mushroom tyrosinase. Concentrations of compound 1 for curves 0–4 were 0, 5, 15, 20 and 40 μM, respectively. The inset represents the secondary plot of slope or Y-intercept versus the compound 1 concentration for determining the Ki and Ki. The line was drawn using linear least square fit.

image file: c6ra12754a-f2.tif
Fig. 2 Lineweaver–Burk plots for inhibition of compound 2 on the oxidation of L-DOPA by mushroom tyrosinase. Concentrations of compound 2 for curves 0–4 were 0, 1, 1.5, 2 and 5 μM, respectively. The inset represents the secondary plot of slope or Y-intercept versus the compound 2 concentration for determining the Ki and Ki. The line was drawn using linear least square fit.

image file: c6ra12754a-f3.tif
Fig. 3 Lineweaver–Burk plots for inhibition of compound 3 on the oxidation of L-DOPA by mushroom tyrosinase. Concentrations of compound 3 for curves 0–4 were 0, 1, 1.5, 5 and 20 μM, respectively. The inset represents the secondary plot of slope or Y-intercept versus the compound 3 concentration for determining the Ki and Ki. The line was drawn using linear least square fit.

Kojic acid, rhodanine (ESI – Fig. 1 & 2), compounds 1 (Fig. 1) and 3 (Fig. 3) exhibited mixed-type inhibition based on the results of Lineweaver–Burk double-reciprocal plots which showed a series of linear lines that intercept at the second quadrant. The results indicate that these inhibitors could bind with both the free enzyme and the enzyme–substrate complex. Other example of mixed-type dihydroxyphenolase tyrosinase inhibitor is 2-mercapto-1-methylimidazole.24 On the other hand, it is worth to mention here that although Kahn and Andrawis reported that tropolone possessed a mixed-type inhibition, a work by Espin and Wichers showed that it was actually a slow-binding inhibition.25 For mixed-inhibition, the apparent Vmax value change as the inhibitor is capable of preventing the activity of enzyme regardless of whether the substrate is bound to the enzyme. The apparent Km also varies, depending on the relative values of Ki (the Ki for binding to the free enzyme) and Ki (the Ki for binding to the ES complex). All of the compounds exhibited lower equilibrium constant Ki than Ki, indicate that the affinity of the inhibitors for a free enzyme was stronger than that for an enzyme–substrate complex.

A family of straight double-reciprocal lines intersect at a common point in Y-axis but with different slopes in the Lineweaver–Burk plot can be observed for compound 2 (Fig. 2). When the concentration of compound 2 increased, the value of Km increased while the value of Vmax unchanged. This indicates that compound 2 only inhibit the free tyrosinase enzyme by binding to the active site. Thus, compound 2 is a competitive inhibitor. In a competitive inhibition, Ki (binding to the free enzyme) = ∞ and Ki (binding to the enzyme–substrate complex) = 0 as the binding of the substrate and inhibitor to the enzyme are mutually exclusive.26

The change of the standard Gibbs free energy of binding (ΔG°) for each compound was also calculated using the association binding constant (Ka), obtained from the inverse of the Ki value, in the equation ΔG° = −RT[thin space (1/6-em)]ln[thin space (1/6-em)]Ka; where R is the gas constant and T is the absolute. The calculated ΔG° values for the three compounds are summarized in Table 2. The inhibitor binding process is thermodynamically favorable and likely to occur spontaneously (ΔG° < 0) in all cases.

Table 2 Thermodynamic parameters of binding of compounds 1, 2 and 3 to mushroom tyrosinase at 25 °C and pH 6.8
Compound Ka (M−1) ΔG° (kJ mol−1)
Kojic acid 5.05 × 10⁵ −32.52
Rhodanine 7.14 × 10⁴ −27.68
1 2.60 × 10⁵ −30.88
2 1.50 × 10⁶ −35.22
3 2.57 × 10⁵ −30.85


Molecular docking and dynamics simulation

To understand the plausible binding interactions in the protein–ligand complex, CDOCKER was used to dock compound 2 to the active site of tyrosinase. The lowest energy conformation in the generated docking pose was retrieved and analyzed. Based on the docking results in Fig. 4, it could be observed that the sulfur atom of the inhibitor participates in a metal–acceptor interaction mediated by the metal copper in the active site. Besides, the sulfur atom engaged in the π–sulfur interactions with residues His61, His259, His296 and Phe292 that could potentially increase the binding affinity of the inhibitor in the cavity preventing the substrate, L-DOPA from entering the active site. Several π interactions could also be observed between the oxadiazole ring and the side-chains of His263, Ala286 and Val283. On the other hand, the naphthyl ring could only form weak π interactions with Val283. On the other hand, two distinct binding conformations could be observed for compound 3. In the first conformation, the piperidine ring projects towards the bicopper center while the oxadiazole ring is placed at the adjacent pocket. This is different than the second conformation where the naphthyl ring occupies the bicopper active site while the piperidine ring is directed towards the solvent region (results not shown here). These observations can be explained since the docking was carried out using the rigid protein crystal structure, therefore it does not represent the true protein–ligand complex interactions (a long molecular dynamics simulation is required to investigate the favorable binding conformation of the inhibitor). On the other hand, there is also a possibility that the inhibitor was unstable in buffer solution leading to the dissociation of the piperidine ring. Further studies are required to understand the detailed mechanism of inhibition displayed by compound 3.
image file: c6ra12754a-f4.tif
Fig. 4 Predicted binding interactions between compound 2 and residues in the active site of tyrosinase retrieved from the docking simulation. The atom coloring for compound 2 is in the following: carbons in gray, oxygen in red, nitrogen in blue, sulfur in yellow and hydrogen in white. The surface is colored by the hydrogen bond capacity of the ligand, from pink for donor to green for acceptor while hydrophobicity of the protein residues, from blue for hydrophilic to brown for hydrophobic.

To analyze the dynamic binding stabilities of compound 2, a 10 ns MD simulation was conducted. It appears that the protein–ligand complex RMSDs in (ESI – Fig. 3) showing stabilizing trend after 50 ps. There is no major fluctuation in the RMSD of tyrosinase Cα backbone during the course of 10 ns simulation suggesting that the binding of compound 2 did not induce any major changes to the protein conformation. In contrast, the RMSD plot of the compound appears to fluctuate during the first 5 ns largely due to the movement and the placing of the naphthyl ring in the hydrophobic cavity. To evaluate the stability of the interacting residues predicted from the docking study carried out earlier, a RMSF analysis was performed.

Based on the RMSF plot in (ESI – Fig. 4), there is no apparent changes in the movement of His61 (result not shown here), His259, His293, Val283, Ala286, Phe292 and His296 side chains in the last 5 ns simulation, possibly stabilized by strong chelating effects of the metal bicopper and H-bonding interactions with the oxadiazole moiety of compound 2. On the other hand, we observed that the naphthyl ring did not interact with Val283 residue as predicted in the docking but repositioning itself by forming key hydrophobic interactions with the side chains of Met257 and Val248 and the backbone amide of Glu256. This interesting observation could be the key reason that leads to higher potency as compared to compounds 1 and 3. Fig. 7 summarizes the overall interactions of compound 2 with the residues in tyrosinase binding site during the final 5 ns of simulations. In term of hydrogen bonding interactions per time frame, compound 2 could form an average of 0.202 hydrogen bonds with the residues adjacent to the bicopper center in the final 5 ns of simulation.


image file: c6ra12754a-f5.tif
Fig. 5 Molecular structure of compound 3 drawn at 50% probability ellipsoids.

image file: c6ra12754a-f6.tif
Fig. 6 Effect of compounds 1, 2 and 3 on the viability of SK-MEL-28 malignant melanoma cells as assessed by MTT cytotoxicity assay. Cells were treated with the respective compounds with indicated concentrations for 24 hours. No IC50 values were observed. Each data point was obtained from three independent experimental replicates and expressed as mean ± SEM of the percentage of cell viability.

image file: c6ra12754a-f7.tif
Fig. 7 MD simulation snapshots of compound 2. The atom coloring for compound 2 is in the following: carbons in gray, oxygen in red, nitrogen in blue, sulfur in yellow and hydrogen in white. The surface is colored by the hydrophobicity of the protein residues, from blue for hydrophilic to brown for hydrophobic.

X-ray structural characterization

Compound 3 crystallized in triclinic system with space group P[1 with combining macron]. The detailed crystal system and refinement parameters is shown in ESI. The whole molecule is not planar as shown in Fig. 5. However the central oxadiazole–thione fragment, S1/O1/N1/N2/C12/C13, is planar (max deviation 0.018 (1) Å for O1 atom) and almost perpendicular to the biphenyl ring, (C1–C10), with dihedral angle of 75.94 (6)°. The piperidine ring adopts a chair conformation. The C12–N2 and C13–S1 bond lengths are double bonds of 1.274 (2) and 1.644 (2) Å, respectively. The crystallographic data for the structural analysis was deposited with the Cambridge Crystallographic Data Centre no. 1479789.

Effect on cell viability of SK-MEL-28 malignant melanoma cells

Compounds 1, 2 and 3 all displayed relatively low cytotoxicity towards SK-MEL-28 cells up to 100 μM treatment as assessed using MTT cytotoxicity assay (Fig. 6). There is no IC50 value observed. Although these compounds did not exert potent cytotoxicity, the inhibition of melanogenesis by the tyrosinase inhibitors represents a potential therapeutic target for the management of advanced melanoma. Study by Pinon and colleagues in 2011 had demonstrated that melanogenesis is an apoptosis resistance mechanisms for melanoma cells.28 Hence, further studies can be conducted by testing these compounds with the existing chemotherapeutic drugs used against malignant melanomas.

Conclusions

In conclusion, the synthesized oxadiazoles (1, 2 and 3) showed interesting results against the activity of tyrosinase as compared to some of the well-known inhibitors while at the same exhibited none cytotoxic effect towards SK-MEL-28 cells. To have a complete view on the SAR of compound 2 as an effective therapeutic agent for the treatment of advanced melanoma, more analogues will be synthesized and tested both in vitro and in vivo. Finally, the results from this study clearly showed that oxadiazoles have a vast potential to be developed as tyrosinase inhibitors.

Acknowledgements

This work was financially supported by University Kebangsaan Malaysia under the Research University Grant (GUP) GUP-2013-012 and GGPM-2011-075. The DIP-UKM-2014-016 grant for the X-ray analysis.

References

  1. M. Friedman, Adv. Exp. Med. Biol., 1991, 289, 171–215 CrossRef CAS PubMed.
  2. R. Matsuura, H. Ukeda and M. Sawamura, J. Agric. Food Chem., 2006, 54, 2309–2313 CrossRef CAS PubMed.
  3. M. Chandra, J. Levitt and C. A. Pensabene, Acta Derm.-Venereol., 2012, 92, 232–235 CrossRef CAS PubMed.
  4. W. Y. Zhu and J. Gao, J. Invest. Dermatol. Symp. Proc., 2008, 13, 20–24 CrossRef CAS PubMed.
  5. I. Kubo, I. Kinst-Hori, S. K. Chaudhuri, Y. Kubo, Y. Sanchez and T. Ogura, Bioorg. Med. Chem., 2000, 8, 1749–1755 CrossRef CAS PubMed.
  6. A. S. Aboraia, H. M. Abdel-Rahman, N. M. Mahfouz and M. A. El-Gendy, Bioorg. Med. Chem., 2006, 14, 1236–1246 CrossRef CAS PubMed.
  7. Y. A. Al-Soud, N. A. Al-Masoudi and R. Ferwanah Ael, Bioorg. Med. Chem., 2003, 11, 1701–1708 CrossRef CAS PubMed.
  8. A. A. El-Emam, O. A. Al-Deeb, M. Al-Omar and J. Lehmann, Bioorg. Med. Chem., 2004, 12, 5107–5113 CrossRef CAS PubMed.
  9. B. Narayana, B. V. Ashalatha, K. K. Vijaya Raj, J. Fernandes and B. K. Sarojini, Bioorg. Med. Chem., 2005, 13, 4638–4644 CrossRef CAS PubMed.
  10. M. Santagati, M. Modica, A. Santagati, F. Russo, A. Caruso, V. Cutuli, E. Di Pietro and M. Amico-Roxas, Pharmazie, 1994, 49, 880–884 CAS.
  11. H. Wan and A. G. Holmen, Comb. Chem. High Throughput Screening, 2009, 12, 315–329 CrossRef CAS PubMed.
  12. G. A. Patani and E. J. LaVoie, Chem. Rev., 1996, 96, 3147–3176 CrossRef CAS PubMed.
  13. A. Andreani, M. Granaiola, A. Leoni, A. Locatelli, R. Morigi and M. Rambaldi, Eur. J. Med. Chem., 2001, 36, 743–746 CrossRef CAS PubMed.
  14. M. T. Khan, M. I. Choudhary, K. M. Khan, M. Rani and R. Atta ur, Bioorg. Med. Chem., 2005, 13, 3385–3395 CrossRef CAS PubMed.
  15. U. Ghani and N. Ullah, Bioorg. Med. Chem., 2010, 18, 4042–4048 CrossRef CAS PubMed.
  16. K. W. Lam, A. Syahida, Z. Ul-Haq, M. B. A. Rahman and N. H. Lajis, Bioorg. Med. Chem. Lett., 2010, 20, 3755–3759 CrossRef CAS PubMed.
  17. X. H. Huang, Q. X. Chen, Q. Wang, K. K. Song, J. Wang, L. Sha and X. Guan, Food Chem., 2006, 94, 1–6 CrossRef CAS.
  18. W. T. Ismaya, H. J. Rozeboom, A. Weijn, J. J. Mes, F. Fusetti, H. J. Wichers and B. W. Dijkstra, Biochemistry, 2011, 50, 5477–5486 CrossRef CAS PubMed.
  19. D. Van Der Spoel, E. Lindahl, B. Hess, G. Groenhof, A. E. Mark and H. J. Berendsen, J. Comput. Chem., 2005, 26, 1701–1718 CrossRef CAS PubMed.
  20. B. Hess, J. Chem. Theory Comput., 2008, 4, 116–122 CrossRef CAS PubMed.
  21. D. S. Cerutti, R. E. Duke, T. A. Darden and T. P. Lybrand, J. Chem. Theory Comput., 2009, 5, 2322 CrossRef CAS PubMed.
  22. T. Klabunde, C. Eicken, J. C. Sacchettini and B. Krebs, Nat. Struct. Biol., 1998, 5, 1084–1090 CrossRef CAS PubMed.
  23. Y. F. Lin, Y. H. Hu, Y. L. Jia, Z. C. Li, Y. J. Guo, Q. X. Chen and H. T. Lin, Int. J. Biol. Macromol., 2012, 51, 32–36 CrossRef CAS PubMed.
  24. C. F. Chan, S. T. Lai, Y. C. Guo and M. J. Chen, Bioorg. Med. Chem., 2014, 22, 2809–2815 CrossRef CAS PubMed.
  25. J. C. Espin and H. J. Wichers, J. Agric. Food Chem., 1999, 47, 2638–2644 CrossRef CAS PubMed.
  26. M. Yoshino and K. Murakami, J. Enzyme Inhib. Med. Chem., 2009, 24, 1288–1290 CrossRef CAS PubMed.
  27. V. a. A. Kahn and A. Andrawis, Phytochemistry, 1985a, 24, 905–908 Search PubMed.
  28. A. Pinon, Y. Limami, L. Micallef, J. Cook-Moreau, B. Liagre, C. Delage, R. E. Duval and A. Simon, Exp. Cell Res., 2011, 317, 1669–1676 CrossRef CAS PubMed.

Footnotes

Electronic supplementary information (ESI) available. CCDC 1479789. For ESI and crystallographic data in CIF or other electronic format see DOI: 10.1039/c6ra12754a
These authors contributed equally to this work.

This journal is © The Royal Society of Chemistry 2016
Click here to see how this site uses Cookies. View our privacy policy here.