A reversible fluorescent-colorimetric chemosensor based on a novel Schiff base for visual detection of CO32− in aqueous solution†
Anupam Ghorai,
Jahangir Mondal,
Rukmani Chandra and
Goutam K. Patra*
Department of Chemistry, Guru Ghasidas Vishwavidyalaya, Bilaspur, C.G, India. E-mail: patra29in@yahoo.co.in; Tel: +91 7587312992
First published on 13th January 2016
Abstract
A reversible fluorescent colorimetric chemosensor for rapid detection of carbonate ion has been developed based on a novel bis-Schiff base. The chemosensor L employed here is easy to synthesize, eco-friendly and cost effective. It exhibits excellent selectivity and sensitivity towards carbonate ion by changes in both the absorption and fluorescence intensity. The anion recognition occurs indirectly through coordination of a counter metal ion to the Schiff base ligand exhibiting a colour change from colourless to yellow. Microstructural features of L and L + M+ have been investigated by SEM images. The sensitivity of the absorbance based assay (96 nM) for carbonate ion is the lowest ever reported in the literature. The chemosensor L providing rapid response time with sufficiently low detection limit may be useful as a valuable practical sensor for environmental analyses of carbonate ion.
Introduction
In recent years, the design and synthesis of new sensitive and selective chemosensors that can selectively recognize and signal the presence of anionic species through the naked eye and optical responses has received significant attention because of their potential applications in the environmental, biological and clinical areas.1 Among various anions commonly present in our environment, the detection and quantification of carbonate is of great importance due to its abundance and ubiquity in natural waters and soil environments mainly as metal carbonates.2 The major sources of carbonates are the hydrolysis of carbon dioxide into carbonic acid and consequential transformation into carbonates and bicarbonates which are involved in rock weathering, mineral precipitation, ocean acidification and climate change.3 Calcium carbonate being an important material for marine and geological processes is often created as a result of bio-mineralisation and is used by nature to perform many diverse functions in marine organisms including skeleton and shell growth. Carbonate compounds are extensively used in the manufacture of glass, rayon, rubber, plastic, paper, printing ink, cosmetics, toothpaste and food. It is also used as an important candidate for electric vehicle and hybrid electric vehicle power sources where vinylene carbonate is used as additive electrolytes for rechargeable Li-ion batteries.4 Furthermore, carbonate has vital roles in agricultural planting, soil science,5 hydrology6 and geology.7 In spite of these wide applications in various processes, carbonate ion is toxic in large doses. The strong caustic effect of carbonate to the gastro-intestinal tract may cause severe abdominal pain, vomiting, diarrhea, collapse and even death.8 So it is of urgent need to develop a simple, cost effective chemosensor for carbonate having potential of real sample investigation without interference from endogenous substrates.9 A number of analytical methods have been developed for carbonate ion detection including continuous-flow method,5 electrochemical method,10 acoustic method,11 Fourier transform infrared spectroscopy,12 gas chromatography,13 pH-ion-sensitive field-effect transistor,14 ion selective electrodes15 and chromo ionophore based optodes16 etc. However, these methods are cumbersome, time consuming and naked-eye-invisible in most cases. Although many sensors have been reported for the recognition of various anions including phosphate, acetate, sulphide, fluoride and cyanide17 very few sensors have been reported for carbonate18 ion till date. Recently Li et al. reported a carbonate sensor based on crystal polymer films.19 But to the best of our knowledge, a Schiff base or a simple receptor acting as carbonate sensor with potential of easy and onsite analysis is rarely reported in literature. This possibly results from the difficulty to design a synthetic receptor for carbonate in aqueous media due to its relatively strong alkaline nature and large hydration free energy.20As a part of our ongoing research work21 in the design and synthesis of chemosensors for anions, cations and neutral molecules, we have synthesized a novel azino bis-Schiff base ligand L, a 1![[thin space (1/6-em)]](https://www.rsc.org/images/entities/char_2009.gif) :
:![[thin space (1/6-em)]](https://www.rsc.org/images/entities/char_2009.gif) 2 condensate of benzil dihydrazone and syringaldehyde, for the detection of carbonate ion in aqueous solution. The chemosensor L demonstrated the presence of carbonate ion both by change in absorbance and fluorescence intensity accompanied by instantaneous colour change from colourless to yellow.
2 condensate of benzil dihydrazone and syringaldehyde, for the detection of carbonate ion in aqueous solution. The chemosensor L demonstrated the presence of carbonate ion both by change in absorbance and fluorescence intensity accompanied by instantaneous colour change from colourless to yellow.
Experimental
General information
UV/visible spectra were recorded on a Shimadzu UV 1800 spectrophotometer using a 10 mm path length quartz cuvette. Fluorescence spectra were recorded on a Hitachi spectrophotometer. 1H and 13C NMR spectra were recorded on a Bruker Ultrashield 400 using CDCl3 and NMR titrations were carried out by dissolving L and sodium carbonate in DMSO-d6 and D2O respectively at room temperature and the chemical shifts are reported in δ values (ppm) relative to TMS. High resolution mass (HRMS) spectra were recorded on a Waters mass spectrometer using mixed solvent HPLC methanol and triple distilled water. All the chemicals and metal salts were purchased from Merck. All the anions are of sodium salts and re-crystallized from water (Millipore) before use. Solutions of the receptor L (1 × 10⁻⁵ M) and anions (1 × 10⁻⁴ M) were prepared in CH3OH–H2O (2/1, v/v) and H2O respectively.Synthesis and characterisation of L
Benzil dihydrazone (1.190 g, 5 mmol) is dissolved in 100 mL of anhydrous methanol. To this solution, 1.82 g (10 mmol) of solid syringaldehyde is added with constant stirring. The resulting bright yellowish solution is refluxed for 12 h, maintaining dry condition. Then the reaction mixture is cooled to room temperature. Light yellow crystalline solid (suitable for X-ray analysis) precipitates out. It is filtered off, and dried in air. Yield, 2.35 (72%); mp, 202 °C. 1H NMR (400 MHz, CDCl3, TMS): δ 8.30 (s, –HC![[double bond, length as m-dash]](https://www.rsc.org/images/entities/char_e001.gif) N, 2H), 7.89 (d, 4H), 7.39 (dd, 6H), 6.75 (s, 4H), 3.77 (s, –OCH3, 12H) (Fig S1†). 13C NMR (400 MHz, CDCl3, δ ppm, TMS): 165.1, 159.4, 147.10, 137.8, 135.3, 130.6, 128.7, 127.7, 125.9, 105.6 and 56.4 (Fig. S2†). FTIR/cm−1 (KBr): 692 (w), 729 (w), 756 (w), 1114 (vs), 1157 (m), 1216 (s), 1246 (m), 1317 (s), 1355 (s), 1421 (m), 1458 (s), 1512 (vs), 1597 (vs, –C
N, 2H), 7.89 (d, 4H), 7.39 (dd, 6H), 6.75 (s, 4H), 3.77 (s, –OCH3, 12H) (Fig S1†). 13C NMR (400 MHz, CDCl3, δ ppm, TMS): 165.1, 159.4, 147.10, 137.8, 135.3, 130.6, 128.7, 127.7, 125.9, 105.6 and 56.4 (Fig. S2†). FTIR/cm−1 (KBr): 692 (w), 729 (w), 756 (w), 1114 (vs), 1157 (m), 1216 (s), 1246 (m), 1317 (s), 1355 (s), 1421 (m), 1458 (s), 1512 (vs), 1597 (vs, –C![[double bond, length as m-dash]](https://www.rsc.org/images/entities/char_e001.gif) N), 2937 (w), 3080 (w), 3498 (w) (Fig. S3†). ESI MS: 567.50 (LH+, 100%) (Fig. S4†). UV-vis λmax/nm (ε/dm3 mol−1 cm−1) (CH3OH): 345 (40
N), 2937 (w), 3080 (w), 3498 (w) (Fig. S3†). ESI MS: 567.50 (LH+, 100%) (Fig. S4†). UV-vis λmax/nm (ε/dm3 mol−1 cm−1) (CH3OH): 345 (40![[thin space (1/6-em)]](https://www.rsc.org/images/entities/char_2009.gif) 970). Anal. calcd for C32H30N4O6: C, 67.83; H, 5.34; N, 9.89. Found C, 67.77; H, 5.39; N, 9.85%.
970). Anal. calcd for C32H30N4O6: C, 67.83; H, 5.34; N, 9.89. Found C, 67.77; H, 5.39; N, 9.85%.
X-ray data collection and structural determination
X-ray single crystal data were collected using MoKα (λ = 0.7107 Å) radiation on a BRUKER APEX II diffractometer equipped with CCD area detector. Data collection, data reduction, structure solution/refinement were carried out using the software package of SMART APEX.22 The structures were solved by direct methods (SHELXS-97)23 and standard Fourier techniques, and refined on F2 using full matrix least squares procedures of SHELXL-97 incorporated in WinGX.24 In most of the cases, non-hydrogen atoms were treated anisotropically. Hydrogen atoms were fixed geometrically at their calculated positions following riding atom model. The crystallographic data are listed in Table 1. Structural information has been deposited at the Cambridge Crystallographic Data Center (CCDC 1410686).| Formula | C32H30N4O6 |
| Formula weight | 566.60 |
| Crystal system | Monoclinic |
| Space group | P21/c (no. 14) |
| a [Å] | 11.840(5) |
| b [Å] | 10.520(5) |
| c [Å] | 23.100(5) |
| β [°] | 96.951(5) |
| V [Å3] | 2856.1(19) |
| Z | 4 |
| D(calc) [g cm−3] | 1.318 |
| μ(MoKα) [/mm] | 0.092 |
| F(000) | 1192 |
| Crystal size [mm] | 0.14 × 0.16 × 0.20 |
| Temperature (K) | 293 |
| Radiation [Å] | MoKα, 0.71073 |
| Θ min–max [°] | 2.1; 28.8 |
| Dataset | −15![[thin space (1/6-em)]](https://www.rsc.org/images/entities/char_2009.gif) : :![[thin space (1/6-em)]](https://www.rsc.org/images/entities/char_2009.gif) 15; −14 15; −14![[thin space (1/6-em)]](https://www.rsc.org/images/entities/char_2009.gif) : :![[thin space (1/6-em)]](https://www.rsc.org/images/entities/char_2009.gif) 14; −30 14; −30![[thin space (1/6-em)]](https://www.rsc.org/images/entities/char_2009.gif) : :![[thin space (1/6-em)]](https://www.rsc.org/images/entities/char_2009.gif) 30 30 |
| Total data | 92![[thin space (1/6-em)]](https://www.rsc.org/images/entities/char_2009.gif) 134 134 |
| Uniq. data | 7313 |
| R(int) | 0.168 |
| Observed data [I > 2.0 sigma(I)] | 3856 |
| Nref | 7313 |
| Npar | 380 |
| R | 0.0964 |
| wR2 | 0.2885 |
| S | 1.09 |
UV-vis titrations
L (5.66 mg, 0.01 mmol) was dissolved in the solvent mixture CH3OH–H2O (2/1, v/v) (10 mL) and 30 μL of it was diluted to 3 mL with the solvent mixture to make a final concentration of 10 μM. Na2CO3 (10.6 mg, 0.1 mmol) was dissolved in 10 mL of triple distilled water and 1.5–90 μL of the carbonate ion solution (10 mM) were transferred to the solution of L (10 μM) prepared above. After mixing them for a few seconds, UV-vis spectra were obtained at room temperature.Fluorescence titration
L (5.66 mg, 0.01 mmol) was dissolved in 10 mL of mixed solvent CH3OH–H2O (2/1, v/v) to make a solution of 1 × 10⁻³ M and 30 μL of this solution were diluted with 2.97 mL of solvent mixture to make the final concentration of 10 μM. Na2CO3 (10.6 mg, 0.1 mmol) was dissolved in triple distilled water (10 mL) and 1.5–60 μL of this CO32− solution (10 mM) were transferred to each receptor solution (10 μM) to give 0.5–20 equiv. After mixing them for a few seconds, fluorescence spectra were obtained at room temperature.Competition with other anions
For CO32−, L (5.66 mg, 0.01 mmol) was dissolved in afore-mentioned solvent mixture (10 mL) and 30 μL of it was diluted to 3 mL with the solvent mixture to make a final concentration of 10 μM. Sodium salts of F−, Cl−, Br−, I−, N3−, H2PO4−, NO3−, OAc−, HCO3−, HSO3−, CO32−, SO42−, SO32−, CN−, S2− (0.1 mmol) were dissolved in 10 mL of triple distilled water and 6 μL of each solution (10 mM) were added to 3 mL of the solution of receptor L (10 μM) to give 2 equiv. of anion conc. Then, 6 μL of CO32− solution (10 mM) were added to the mixed solution of each anion and L to make 2 equiv. After mixing them for a few seconds, absorbance spectra were obtained at room temperature.Job plot measurements
L (5.66 mg, 0.01 mmol) was dissolved in methanol (10 mL). 100, 90, 80, 70, 60, 50, 40, 30, 20, 10 and 0 μL of the L solution were taken and transferred to vials. Each vial was diluted with 2.9 mL of a mixed solvent. Na2CO3 (0.01 mmol) was dissolved in triple distilled water (10 mL). 0, 10, 20, 30, 40, 50, 60, 70, 80, 90 and 100 μL of the carbonate solution were added to each diluted L solution. Each vial had a total volume of 3 mL. After shaking them for a minute, UV-vis spectra were obtained at room temperature.Computational details
The GAUSSIAN-09 Revision C.01 program package was used for all calculations.25 The gas phase geometries of the compound was fully optimized without any symmetry restrictions in singlet ground state with the gradient-corrected DFT level coupled with the hybrid exchange correlation functional that uses Coulomb-attenuating method B3LYP.26 Basis set 6-31++G was found to be suitable for the whole molecule.Result and discussion
Synthesis and structure of L
Receptor L was obtained by the condensation reaction of benzil dihydrazone and syringaldehyde in methanol with 72% yield (Scheme 1) and characterized by 1H NMR, 13C NMR, IR, ESI-mass spectrometry, elemental analysis and X-ray crystallography. The IR spectra of azino bis-Schiff base L showed a broad band at 3498 cm−1 for OH stretching vibration. In addition, the band appeared at 1597 cm−1 is due to γ(C![[double bond, length as m-dash]](https://www.rsc.org/images/entities/char_e001.gif) N) stretching frequency.
N) stretching frequency.
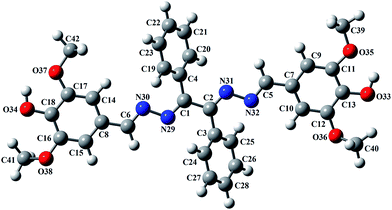
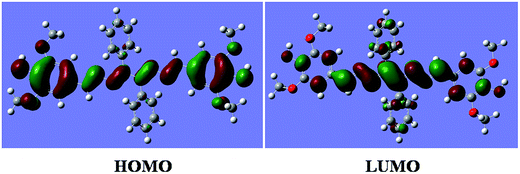
DFT calculations were performed on the molecule L. The geometry optimizations staring from Gauss-view structure of L lead to a global minimum as stationary level. The optimized structure of the L has been shown in Fig. 1. A schematic representation of the energy of MOs and contours of selected HOMO and LUMO orbitals of L are presented in Fig. 2. The HOMO to LUMO energy gap for L is 7.40683 eV.
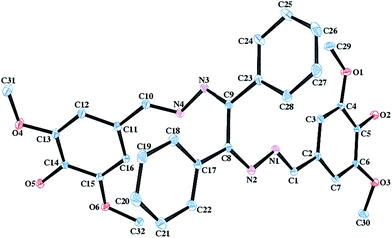
Crystals of L were obtained by slow evaporation of methanolic solution. Single crystal-XRD analysis of L reveals that the molecule crystallizes in P21/c space group and the ‘z’ value is 4. The ORTEP diagram of L is shown in Fig. 3. The molecular structure is based on the –C1–N1–N2–C8–C9–N3–N4–C10– backbone where two unsubstituted phenyl rings are attached to the middle C-atoms (C8 and C9) and two substituted phenyl rings are attached to terminal C-atoms (C1 and C10).
Absorption studies of L towards different anions
The colorimetric selective sensing abilities of chemosensor L were primarily investigated by UV-vis absorption spectrometry in a CH3OH–H2O solution (2![[thin space (1/6-em)]](https://www.rsc.org/images/entities/char_2009.gif) :
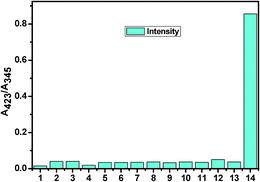
:![[thin space (1/6-em)]](https://www.rsc.org/images/entities/char_2009.gif) 1, v/v) with various metal cations (Al3+, Mg2+, Mn2+, Fe3+, Ba2+, Co2+, K+, Ni2+, Ca2+, Cu2+, Cr3+, Zn2+, Cd2+, Na+, Hg2+ and Ag+) (Fig. S5†) and anions (SO42−, SO32−, HSO3−, F−, OAc−, Cl−, Br−, I−, H2PO4−, HCO3−, N3−, NO3−, CO32−) (Fig. 4). Only the addition of carbonate induced distinct spectral changes while other anions did not induce any spectral change. We further checked the absorption behaviour of L with the anions S2− and CN−. Both CN− and S2− exhibit almost no change in the absorption spectra as well as in visible colour. But in much higher concentration, S2− (8 × 10⁻³ M) induces a decrease in absorption intensity at 345 nm with hardly perceptible colour change of L (Fig. S6†).
1, v/v) with various metal cations (Al3+, Mg2+, Mn2+, Fe3+, Ba2+, Co2+, K+, Ni2+, Ca2+, Cu2+, Cr3+, Zn2+, Cd2+, Na+, Hg2+ and Ag+) (Fig. S5†) and anions (SO42−, SO32−, HSO3−, F−, OAc−, Cl−, Br−, I−, H2PO4−, HCO3−, N3−, NO3−, CO32−) (Fig. 4). Only the addition of carbonate induced distinct spectral changes while other anions did not induce any spectral change. We further checked the absorption behaviour of L with the anions S2− and CN−. Both CN− and S2− exhibit almost no change in the absorption spectra as well as in visible colour. But in much higher concentration, S2− (8 × 10⁻³ M) induces a decrease in absorption intensity at 345 nm with hardly perceptible colour change of L (Fig. S6†).
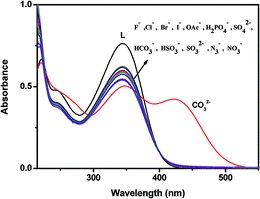 | ||
| Fig. 4 Changes in the absorption spectra of L (10 μM) in the presence of 2 equiv. of different anions. | ||
The probe L without carbonate exhibited a strong UV-vis absorption band at 345 nm which was attributed to the photo-induced electron transfer (PET) transition in the molecule. Addition of carbonate to a solution of L led to an obvious absorption enhancement at 423 nm with concomitant decrease in absorption intensity at 345 nm. Consistent with this change in the UV-vis spectra, the solution of L resulted in an immediate colour change from colourless to yellow with the carbonate ion (Fig. S7†), indicating that receptor L can serve as a ‘naked-eye’ carbonate indicator in aqueous solution.
The selectivity behaviour over a wide range of back ground anions is obviously a matter of importance for an excellent sensing material. The exclusive selectivity of chemosensor L towards carbonate ion was further studied ratiometrically.
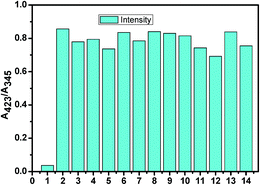
However, the absorption study carried out with common metal cations and other anions showed no significant change, indicating their noninteractive nature with L. In Fig. 5, a bar graph showing the relative absorption intensity of L upon treatment with various anions has been given. To further check the practical applicability of receptor L as a carbonate ion selective chromogenic receptor, a competitive experiment was carried out with 2 equiv. of CO32− in the presence of 2 equiv. of other anions in an aqueous solution (Fig. 6). It was found that any other anions under experiment did not interfere with the detection of CO32− by L. This indicates that under signalling conditions, the possible interference by them is not a practical problem in carbonate sensing by L.
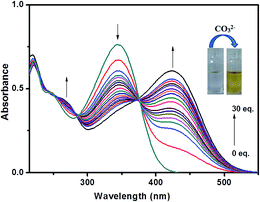
The recognition ability of probe L towards carbonate ion was established upon titration of the probe solution with variable concentrations of carbonate ion followed by subsequent measurement of absorption spectra (Fig. 7).
Interestingly, probe L exhibits two well-defined isosbestic points at 285 and 375 nm in the absorption spectra upon increasing concentration of carbonate. The isosbestic point at 375 nm indicates equilibrium between two species, the free ligand and metal bonded ligand. In the UV-visible titration experiment, the blue-shifted band around 345 nm went-down while the intensity of the newly red shifted band at 423 nm triggered by carbonate ion continuously increases with successive increment of carbonate ion (0–30 equiv.) into the probe solution as shown in Fig. 7. We propose that the blue-shifted band, which is initially present, corresponds to the free receptor L and the red-shifted band corresponds to the metal ion-bonded species. The prominent bathochromic shift of about 78 nm occurred on addition of carbonate led us to propose that the π conjugate system of L underwent intramolecular charge transfer (ICT) from donor to the acceptor upon excitation by light through de-protonation of probe L by carbonate ion. Here Na2CO3 gets hydrolysed to produce NaOH which causes this de-protonation followed by subsequent metallation. Binding of Na+ ion with L affected the efficiency of ICT leading to decrease in intensity at 345 nm. To identify the ICT property of L, we have checked the change of its absorption spectra in several solvents such as dimethyl sulfoxide, methanol, ethanol and acetonitrile because it has been reported that the solvent dipole can relax the ICT excited by polar solvents.27 As shown in Fig. S8† and summarized in Table 2, the absorption spectra of L featured a marginal red-shift of the absorption maxima (Δλabs = 9 nm), indicating an apparent solvent dependence of the absorption band. In order to confirm whether the colour change and corresponding absorbance change occurs due to ICT through de-protonation mechanism the interaction between the probe L and OH− was carried out. UV-vis spectral change of L on addition of OH− was almost similar as observed in case of carbonate ion demonstrating the de-protonation mechanism (Fig. S9†).
| Solvent | λabs [nm] (log![[thin space (1/6-em)]](https://www.rsc.org/images/entities/char_2009.gif) ε) ε) |
|---|---|
| MeOH | 345 (7.23) |
| Acetonitrile | 352 (7.14) |
| Chloroform | 347 (7.21) |
| DMSO | 354 (7.11) |
Therefore, this solvatochromic behaviour demonstrates the occurrence of the ICT transition in receptor L. Fig. S10† which highlights the ratiometric response of the probe L on addition carbonate in narrow range shows that the A423/A345 curve becomes a plateau at [CO32−]/[L] ratio over 1. The Job plot analysis also indicated a 1![[thin space (1/6-em)]](https://www.rsc.org/images/entities/char_2009.gif) :
:![[thin space (1/6-em)]](https://www.rsc.org/images/entities/char_2009.gif) 1 stoichiometric adduct of receptor L and Na+ ion (Fig. S11†). The fact that the sensing of CO32− by chemosensor L does not depend on counter metal ion, can be established by the similar type of absorbance spectra shown by L with potassium carbonate (Fig. S12†). To our pleasure, the detection limit calculated from the titration profile was found to be 96 nM (Fig. S13†), which, to the best of our knowledge, is the lowest ever reported in the literature.
1 stoichiometric adduct of receptor L and Na+ ion (Fig. S11†). The fact that the sensing of CO32− by chemosensor L does not depend on counter metal ion, can be established by the similar type of absorbance spectra shown by L with potassium carbonate (Fig. S12†). To our pleasure, the detection limit calculated from the titration profile was found to be 96 nM (Fig. S13†), which, to the best of our knowledge, is the lowest ever reported in the literature.
Fluorescence studies
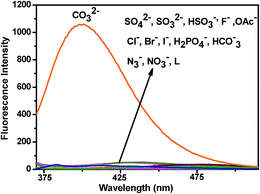
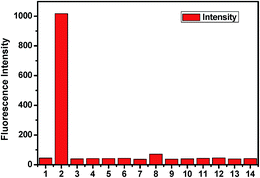
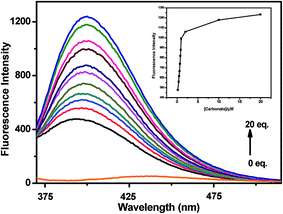
The fluorescence behaviour of chemosensor L is also prominent in distinguishing CO32− from other anions (SO42−, SO32−, HSO3−, F−, OAc−, Cl−, Br−, I−, H2PO4−, HCO3−, N3−, NO3−) (Fig. 8). Upon excitation at 340 nm at room temperature L exhibits little emission with a low fluorescence quantum yield (Φ = 0.0157) along with other anions except for CO32− (Φ = 0.427). The low fluorescence intensity of L can be ascribed to the photo-induced electron transfer (PET) process. On addition of CO32−, L gets attached to the metal ion through the terminal hydroxyl groups and thereby hinders the PET process resulting a significant fluorescence enhancement of the L − M+ adduct accompanied by a prominent blue shift of 36 nm. The selectivity experiment is further carried out using HEPES buffer to maintain a constant pH medium of pH = 8.0. It also shows similar result as observed in absence of buffer (Fig. 9).A quantitative investigation of the binding affinity of L with Na+ on addition of Na2CO3 was performed by a fluorescence titration (Fig. 10). It revealed that the emission intensity at 398 nm monotonically increased upon gradual addition of CO32− up to 20 equiv. The inset plot of (Fig. 10) elaborates the titration data in narrow range implying that the reaction gets almost completed on addition of one equivalent of CO32−.
Sensing mechanism, 1H NMR and HRMS spectral studies of the probe and the adduct
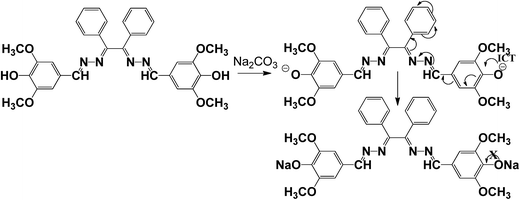
In order to obtain better insight into the sensing mechanism, 1H NMR and mass spectral studies of carbonate have been carried out. The presence of two terminal hydroxyl groups in Schiff base receptor was observed to play a vital role in sensing mechanism (Scheme 2). The disappearance of –OH band (which was present in IR spectra of free ligand) in IR spectra of metal bonded adduct (Fig. S14†) stands in support of involvement of hydroxyl group in sensing mechanism.The mechanism is also well corroborated by 1H NMR spectra (Fig. S15†), where the peak at 9.05 ppm for –OH proton in free receptor was completely vanished with slight displacement of other peaks on addition of one equivalent of sodium carbonate due to binding of Na+ ion to terminal hydroxyl group of receptor. In addition, the formation of a 1: 2 adduct between L and Na+ was further confirmed by the appearance of a peak at m/z 611, assignable to [L + 2Na+] in the ESI/MS (Fig. S16†). Moreover fluorescence behaviour of the probe L before and after the addition of carbonate was examined under different pH conditions (Fig. S17†). It was observed that there was no significant change in emission intensity at 398 nm for the probe (10 μM) alone in the pH range 2–9 while after addition of carbonate ions into probe solution, a drastic enhancement in the emission signal centred at 398 nm appeared in the pH span of 5–8. At lower pH range 2–4, the fluorescence intensity of the probe, on addition of carbonate ions, abruptly falls and similar observation was also observed after pH > 8. But to be a pH sensor it should be pH responsive at different pH conditions. So it can be concluded that the probe is not a pH sensor.
SEM image
To understand the aggregation property of L and L + Na2CO3 and its effect on their chemo-sensing property, scanning electron microscope (SEM) imaging was carried out. L and L + Na2CO3 adduct possess charge transfer, π–π stacking, and van der Waals force of attraction which cause the compounds to form agglomerate material and framework like structure respectively (Fig. S18†). The framework like structure results due to strong interaction of the Na+ ion with the ligand L.Reversibility is a prerequisite in developing novel chemosensors for practical application. In detection of carbonate ion reversibility is rarely observed.28 The reversibility of the recognition process of receptor L was performed by adding an Na+ bonding agent, CH3COOH (Fig. 11). The addition of CH3COOH to a mixture of receptor L and Na2CO3 resulted in appearance of peak at 345 nm with diminution of the absorption intensity at 423 nm, indicating the regeneration of the free receptor L. The absorption band at 423 nm was recovered by the addition of Na2CO3 again. Such reversibility is important for the fabrication of devices to sense carbonate ion.
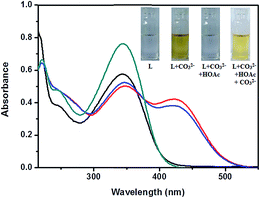 | ||
| Fig. 11 Reversibility test of L with CH3COOH (green trace, L; red trace L + Na2CO3; black trace, L + Na2CO3 + HOAc; blue trace, L + Na2CO3 + HOAc + Na2CO3). | ||
The quick response time for a sensing material is a prerequisite for practical applicability. To understand the carbonate binding reaction time with probe L, the absorption spectra of probe L was recorded by variable time interval and the results revealed that the response in ratiometric absorption change started immediately upon carbonate addition and completed within 1 min as shown in the absorption spectra at different time intervals (Fig. S19†). It was observed that ratiometric absorbance remained almost constant up to 10 min on addition of 2 equiv. of carbonate ion.
Application of chemosensor L
To check the practical application, the test kits were utilized to sense carbonate among different competing anions. As shown in Fig. 12, when the test kits coated with L were added to different anion solutions, the obvious colour change was observed only with carbonate in aqueous solution. Therefore, the test kits coated with the chemosensor L solution would be convenient for detecting carbonate. These results showed that chemosensor L could be a valuable practical sensor for environmental analyses of carbonate. | ||
| Fig. 12 Photographs of the test kits with L (0.5 mM) for detecting carbonate ion among other anions. | ||
The applicability of the chemosensor L towards real sample analysis was investigated by employing distilled water, tap water and river water under the same conditions (Fig. S20†). Almost no fluorescence enhancement was observed in case of distilled water for all concentration of carbonate ion in comparison to the chemosensor L alone. But in case of tap water and river water, there occur little enhancement in fluorescence intensity due to presence of carbonate ion in those water samples. However the results obtained suggests that the background ions present in the water samples have little influence in detection of carbonate ion.
Conclusion
In summary we have developed a novel bis Schiff base sensor for visual detection of carbonate in aqueous solution. The chemosensor L employed is easy to synthesize, eco-friendly, and cost effective. It exhibits an excellent selectivity and sensitivity towards carbonate by changes in both absorption and fluorescence intensity. The detection limit (96 nM) is the lowest ever reported in the literature. The chemosensor L proposed by us has the potentiality in detecting carbonate ions in real samples. On the basis of these results, we believe that the chemosensor L may be useful as a valuable practical sensor for environmental analyses of carbonate.Acknowledgements
G. K. P would like to thank the Department of Science and Technology and Department of Biotechnology, Government of India, New Delhi for financial support and Dr Rajat Saha for various help.References
- (a) S. Mizukami, T. Nagano, Y. Urano, A. Odani and K. A. Kikuchi, J. Am. Chem. Soc., 2002, 124, 3920–3925 CrossRef CAS PubMed; (b) R. M. Duke, E. B. Veale, F. M. Pfeffer, P. E. Kruger and T. Gunnlaugsson, Chem. Soc. Rev., 2010, 39, 3936–3953 RSC; (c) J. Shao, H. Lin and H.-K. Lin, Talanta, 2008, 75, 1015–1020 CrossRef CAS PubMed; (d) B. Kuswandi, W. Verboom and D. N. Reinhoudt, Sensors, 2006, 6, 978–1017 CrossRef CAS; (e) K. Ghosh and S. Adhikari, Tetrahedron Lett., 2006, 47, 8165–8169 CrossRef CAS; (f) A. K. Jain, J. Raisoni, R. Kumar and S. Jain, Int. J. Environ. Anal. Chem., 2007, 87, 553–563 CrossRef CAS; (g) G. A. E. Mostafa, Int. J. Environ. Anal. Chem., 2008, 88, 435–446 CrossRef CAS; (h) M. T. Oms, P. A. C. Jongejan, A. C. Veltkamp, G. P. Wyers and J. Slanina, Int. J. Environ. Anal. Chem., 1996, 62, 207–218 CrossRef CAS.
- (a) M. Descostes, C. Beaucaire, F. Mercier, S. Savoye, J. Sow and P. Zuddas, Bull. Soc. Geol. Fr., 2002, 173, 265–270 CrossRef CAS; (b) C. Su and D. L. Suarez, Clays Clay Miner., 1997, 45, 814–825 CAS; (c) L. D. Chen, D. Mandal, G. Pozzi, J. A. Gladysz and P. Buhlmann, J. Am. Chem. Soc., 2011, 133, 20869–20877 CrossRef CAS PubMed.
- A. H. England, A. M. Duffin, C. P. Schwartz, J. S. Uejio, D. Prendergast and R. J. Saykally, Chem. Phys. Lett., 2011, 514, 187–390 CrossRef CAS.
- (a) A. C. Tas, Int. J. Appl. Ceram. Technol., 2009, 6, 53–64 CrossRef CAS; (b) R. Demichelis, P. Raiteri, J. D. Gale, D. Quigley and D. Gebauer, Nat. Commun., 2011, 1604–1611 Search PubMed; (c) H. Zhao, S. J. Park, F. Shi, Y. Fu, V. Battaglia, P. N. Ross and G. Liu, J. Electrochem. Soc., 2014, 161, A194–A197 CrossRef CAS; (d) D. Aurbach, J. S. Gnanaraj, W. Geissler and M. Schmidt, J. Electrochem. Soc., 2004, 151, A23–A30 CrossRef CAS; (e) C. Han, Z. Cui, Z. Zou, D. Sabahaiti and H. Li, Photochem. Photobiol. Sci., 2010, 9, 1269–1273 RSC.
- M. Zougagh, A. Ríos and M. Valcárcel, Talanta, 2005, 65, 29–35 CAS.
- Y. S. Choi, L. Lvova, J. H. Shin, S. H. Oh, C. S. Lee, B. H. Kim, G. S. Cha and H. Nam, Anal. Chem., 2002, 74, 2435–2440 CrossRef CAS PubMed.
- R. V. Morris, S. W. Ruff, D. W. Ming, R. E. Arvidson, B. C. Clark, D. C. Golden, K. Siebach, G. Klingelhöfer, C. Schröder, I. Fleischer, A. S. Yen and S. W. Squyres, Science, 2010, 329, 421–424 CrossRef CAS PubMed.
- A. K. Jain, V. K. Gupta and J. R. Raisoni, Electrochim. Acta, 2006, 52, 951–957 CrossRef CAS.
- N. Abramova, S. Levichev and A. Bratov, Talanta, 2010, 81, 1750–1754 CrossRef CAS PubMed.
- H. K. Lee, H. Oh, K. C. Nam and S. Jeon, Sens. Actuators, B, 2005, 106, 207–211 CrossRef CAS.
- O. Dóka, D. Bicanic, M. Szücs and M. Lubbers, Appl. Spectrosc., 1998, 52, 1526–1529 CrossRef.
- E. E. Burt and A. H. Rau, Drug Dev. Ind. Pharm., 1994, 20, 2955–2964 CrossRef CAS.
- R. G. Amundson, J. Trask and E. Pendall, Soil Sci. Soc. Am. J., 1988, 52, 880–883 CrossRef CAS.
- (a) K. Tsukada, Y. Miyahara, Y. Shibata and H. Miyagi, Sens. Actuators, B, 1990, 2, 291–295 CrossRef CAS; (b) J. H. Shin, H. J. Lee, C. Y. Kim, B. K. Oh, K. L. Rho, H. Nam and G. S. Cha, Anal. Chem., 1996, 68, 3166–3172 CrossRef CAS.
- (a) H. J. Lee, I. J. Yoon, C. L. Yoo, H. -J. Pyun, G. S. Cha and H. Nam, Anal. Chem., 2000, 7(2), 4694–4699 CrossRef; (b) H. K. Lee, H. Oh, K. C. Nam and S. Jeon, Sens. Actuators, B, 2005, 106, 207–211 CrossRef CAS; (c) R. K. Meruva and M. E. Meyerhoff, Biosens. Bioelectron., 1998, 13, 201–212 CrossRef CAS PubMed.
- W. E. Morf, K. Seiler, B. Lehmann, C. Behringer, K. Hartman and W. Simon, Pure Appl. Chem., 1989, 61, 1613–1618 CrossRef CAS.
- (a) N. Kaura, J. Singha, G. Dhakaa, R. Ranib and V. Luxami, Supramol. Chem., 2015, 27, 453–459 CrossRef; (b) L. J. Tang, M. J. Cai, Z. L. Huang, K. L. Zhong, S. H. Hou, Y. J. Bian and R. Nandhakumar, Sens. Actuators, B, 2013, 185, 188–194 CrossRef CAS; (c) L. J. Tang, M. J. Cai, P. Zhou, J. Zhao, K. L. Zhong, S. H. Hou and Y. J. Bian, RSC Adv., 2013, 3, 16802–16809 RSC; (d) L. J. Tang, P. Zhou, K. L. Zhong and S. H. Hou, Sens. Actuators, B, 2013, 182, 439–445 CrossRef CAS; (e) Z.-B. Zheng, Z.-M. Duan, Y.-Y. Ma and K.-Z. Wang, Inorg. Chem., 2013, 52, 2306–2316 CrossRef CAS PubMed; (f) D. Zhang, X. Jiang, H. Yang, Z. Su, E. Gao, A. Martinez and G. Gao, Chem. Commun., 2013, 49, 6149–6151 RSC; (g) S.-I. Kondo and R. Takai, Org. Lett., 2013, 15, 538–541 CrossRef CAS PubMed; (h) V. Reena, S. Suganya and S. Velmathi, J. Fluorine Chem., 2013, 153, 89–95 CrossRef CAS.
- (a) G. Hennrich, H. Sonnenschein and U. Resch-Genger, Tetrahedron Lett., 2001, 42, 2805–2808 CrossRef CAS; (b) H. Cuiping, C. Zhimin, Z. Zhilong, T. Demei and L. Haibing, Photochem. Photobiol. Sci., 2010, 9, 1269–1273 RSC; (c) J. Vaněk, P. Lubal, P. Hermann and P. Anzenbacher Jr, J. Fluoresc., 2013, 23, 57–69 CrossRef PubMed.
- L. Li, B. Zhao, Y. Long, J.-M. Gao, G. Yang, C. H. Tung and K. Song, J. Mater. Chem. C, 2015, 3, 9524–9527 RSC.
- Y. Marcus, J. Chem. Soc., Faraday Trans., 1991, 87, 2995–2999 RSC.
- (a) A. Ghorai, J. Mondal, R. Chandra and G. K. Patra, Dalton Trans., 2015, 44, 13261 RSC; (b) A. Ghorai, J. Mondal, R. Chandra and G. K. Patra, Anal. Methods, 2015, 7, 8146–8151 RSC.
- SMART & SAINT Software Reference manuals, version 5.0, Bruker AXS Inc., Madison, WI, 1998 Search PubMed.
- G. M. Sheldrick, Acta Crystallogr., Sect. A: Found. Crystallogr., 2008, 64, 112 CrossRef CAS PubMed.
- L. J. Farrugia, WinGX: An Integrated System of Windows Programs for the Solution, Refinement and Analysis for Single Crystal X-ray Diffraction Data, version 1.80.01, Department of Chemistry: University of Glasgow, 2003jnltransJ. Appl. Crystallogr., 1999, 32837. Search PubMed.
- M. J. Frisch, G. W. Trucks, H. B. Schlegel, G. E. Scuseria, M. A. Robb, J. R. Cheeseman, G. Scalmani, V. Barone, B. Mennucci, G. A. Petersson, H. Nakatsuji, M. Caricato, X. Li, H. P. Hratchian, A. F. Izmaylov, J. Bloino, G. Zheng, J. L. Sonnenberg, M. Hada, M. Ehara, K. Toyota, R. Fukuda, J. Hasegawa, M. Ishida, T. Nakajima, Y. Honda, O. Kitao, H. Nakai, T. Vreven, J. A. Montgomery Jr, J. E. Peralta, F. Ogliaro, M. Bearpark, J. J. Heyd, E. Brothers, K. N. Kudin, V. N. Staroverov, R. Kobayashi, J. Normand, K. Raghavachari, A. Rendell, J. C. Burant, S. S. Iyengar, J. Tomasi, M. Cossi, N. Rega, J. M. Millam, M. Klene, J. E. Knox, J. B. Cross, V. Bakken, C. Adamo, J. Jaramillo, R. Gomperts, R. E. Stratmann, O. Yazyev, A. J. Austin, R. Cammi, C. Pomelli, J. W. Ochterski, R. L. Martin, K. Morokuma, V. G. Zakrzewski, G. A. Voth, P. Salvador, J. J. Dannenberg, S. Dapprich, A. D. Daniels, Ö. Farkas, J. B. Foresman, J. V. Ortiz, J. Cioslowski and D. J. Fox, Gaussian 09, Revision C.01, Gaussian Inc., Wallingford, CT, 2009 Search PubMed.
- (a) A. D. Becke, J. Chem. Phys., 1993, 98, 5648 CrossRef CAS; (b) C. Lee, W. Yang and R. G. Parr, Phys. Rev. [Sect.] B, 1988, 37, 785 CrossRef CAS.
- (a) K. C. Song, H. Kim, K. M. Lee, Y. S. Lee, Y. Do and M. H. Lee, Sens. Actuators, B, 2013, 176, 850–857 CrossRef CAS; (b) S. Maruyama, K. Kikuchi, T. Hirano, Y. Urano, T. Nagano and A. Novel, J. Am. Chem. Soc., 2002, 124, 10650–10651 CrossRef CAS PubMed; (c) A. P. Silva, H. Q. N. Gunaratne, T. Gunnlaugsson, A. J. M. Huxley, C. P. McCoy, J. T. Rademacher and T. E. Rice, Chem. Rev., 1997, 97, 1515–1566 CrossRef PubMed.
- B. K.-L. Wong, G. L. Law, Y.-Y. Yang and W.-T. Wong, Adv. Mater., 2006, 18, 1051–1054 CrossRef.
Footnote |
| † Electronic supplementary information (ESI) available. CCDC 1410686. For ESI and crystallographic data in CIF or other electronic format see DOI: 10.1039/c5ra24549d |
| This journal is © The Royal Society of Chemistry 2016 |


