
A pseudo-kinetics approach for time-series metabolomics investigations: more reliable and sensitive biomarkers revealed in vincristine-induced paralytic ileus rats†
Huimin Guoab,
Jiaqing Chenab,
Yin Huangab,
Wei Zhangc,
Fengguo Xu*ab and
Zunjian Zhang*ab
aKey Laboratory of Drug Quality Control and Pharmacovigilance, China Pharmaceutical University, Ministry of Education, Nanjing 210009, China. E-mail: zunjianzhangcpu@hotmail.com; fengguoxu@gmail.com; Tel: +86-25-83271454 Tel: +86-25-83271021
bState Key Laboratory of Natural Medicine, China Pharmaceutical University, Nanjing 210009, China
cState Key Laboratory of Quality Research in Chinese Medicines, Macau University of Science and Technology, Taipa, Macau, China
First published on 1st June 2016
Abstract
Time-series metabolomics studies can provide snapshots of the metabolic status during the progress of disease and drug treatment. In order to reveal the dynamic development of a disease, a pseudo-kinetics approach based on calibration and integration of absolute fold changes (FCk) along the time points was proposed. A distance based discriminative trajectory was applied to assess global metabolic alterations during ileus progress upon principle component analysis (PCA). The area under the curve (AUC) and peak time (Tmax) of the absolute FCk–time curve were integrated as complementary thresholds to screen sensitive biomarkers compared with the typical ileus parameters of gastric emptying (GE) and gastrointestinal transit (GI). As a result, docosahexaenoic acid, glycocholic acid, glutamine and acetyl-carnitine were identified as sensitive biomarkers for early prediction of paralytic ileus, which were related to intestinal inflammation and mucosal injury. Furthermore, the discrimination abilities of these four biomarkers were validated using receiver-operating characteristic (ROC) analysis. Collectively, this study demonstrated that our proposed pseudo-kinetics approach is effective to screen more reliable and sensitive biomarkers along a pathologic progress.
1 Introduction
The metabolomics technique is a useful tool to study alterations at the metabolic level comprehensively, which can be regarded as the ultimate response of biological systems to endogenous or exogenous stimuli.1,2 It is critical to monitor the dynamic changes of metabolites in response to disease development and drug administration since metabolism is a dynamic process.3,4 Coupled with systematic metabolomics investigations, time series studies have become recognized as advantageous in disease pathogenesis research, early diagnosis, personalized medicine and the elucidation of complex life processes.4The most commonly used method for time series is PCA based trajectory analysis to highlight the metabolic shifts.3–6 Although this plot can depict the metabolic variation trends that consisted of different groups during disease progress, it is difficult to screen biomarkers based on the established models. Batch modeling is another widely used method for dynamic study of biological processes.7 It is possible to establish a control chart to monitor the deviations between the normalities and models. But a drawback with batch modeling is that all study objects must have a similar metabolic and response rate.8 Zhang et al. proposed a weighted method based on the means and variations along the time points in order to identify discriminative metabolites reflecting dynamic development of disease.9 In spite of this, cumulative variation degrees of metabolites along disease progress were ignored, which is convictive to express organic disturbance for pathophysiology. Thus, it is critical to establish a kinetics processing method to deal with time series data where the integral effects of metabolites during disease progress must be considered.
Vincristine (VCR), an alkaloid derived from the Catharanthusroseus (L.) G. Don, has been widely used as a chemotherapeutic agent for the management of hematological malignancies and solid tumors.10,11 However, its clinical setting has been limited due to unavoidable neurotoxicity induced by the property of high binding affinity towards neuronal cytoskeleton protein and disruption of microtubule polymerizations.12 Paralytic ileus and constipation are the most serious side effects of VCR on the gastrointestinal tract.13 However, their mechanism remains obscure because of the complicated interactions of multiple factors.
In this study, a pseudo-kinetics approach combining with multivariate projection methods based on calibration and integration of absolute fold changes (FCK) along disease progress was proposed. Area under curve (AUC) and peak time (Tmax) of absolute FCk–time curve were calculated and compared between metabolites and ileus typical parameters with the aim of revealing more reliable and sensitive diagnosis biomarkers and metabolic dysregulations contributing to gastrointestinal toxicity induced by chemotherapy.
2 Materials and methods
2.1 Animal experiment
A total of 60 male Sprague-Dawley (S.D.) rats (220 ± 20 g) were supplied by Nanjing Qinlong lab. Animal Co. Ltd. (Jiangsu, China) and housed under controlled environment (22 ± 2 °C, 60–70% relative humidity and 12/12 h light/dark cycle), with unlimited access to standard laboratory food and water for 5 days. The rats were assigned to two groups randomly (n = 30). In model group, rats were administrated VCR (0.2 mg kg−1) by intravenous injections once every other day for eight days, while rats in control group received equivalent volumes of saline injections. The experiment scheme is shown in Fig. S-1.† The present study conformed to the guidelines for the care and use of laboratory animals and approved by animal ethics committee of China Pharmaceutical University.To verify the histological progress of paralytic ileus, five rats in each group of model and control were subjected to phenol red gelatin for investigation the influence of gastric emptying (GE) and gastrointestinal transit (GI) in time points of 0, 4, 8 and 11 day, respectively. Furthermore, intestinal gross and histological examinations were also recorded as visible monitors of ileus. The sera were sequentially collected after 8 h of overnight fasting. This collection was conducted in day 0, 4, 8 and 11. The sera were stored at −80 °C until analysis.
2.2 Chemicals and reagents
Vincristine was obtained from Zhejiang Hisun Chemical Co. Ltd. (Zhejiang, China) with the purity of 99.9%. N-(9-Fluorenylmethyloxycarbonl)-glycine (FMOC-glycine) and glibenclamide (internal standards for LC-MS), heptadecylic acid (internal standard for GC-MS), N-methyl-N-trimethylsilyl-trifluoroacetamide (MSTFA) and methoxyamine (MOX) were purchased from Sigma Aldrich Chemical Co., (St. Louis, MO, USA). Methanol, acetonitrile, pyridine and formic acid (HPLC grade) were purchased from Merck Company (Darmstadt, Germany). Distilled water was purified using a Milli-Q system from EMD Millipore Corporation (Billerica, MA, USA).2.3 GE and GI transit measurement
GE and GI transit were measured by a modified methodology described by P. Reynell and details are provided in the ESI.†,14 The animals were fasted for 24 h with water ad libitum until 2 h before the measurements. GI and GE were calculated by the following formula:| GI = A/B |
| GE = 1 − (amount of phenol red recorded after 20 min/amount of phenol red recorded after 0 min) |
2.4 GC-MS acquisition of serum samples and data processing
A 10 μL aliquot of serum sample was spiked with internal standard solution (100 μL of heptadecanoic acid in methanol, 5 μg mL−1) and vortex for 30 s. The mixture was shook for 15 min. After centrifugation (16![[thin space (1/6-em)]](https://www.rsc.org/images/entities/char_2009.gif) 000g, 10 min), an aliquot of 80 μL supernatant was derivatized using a two-step procedure.15 25 μL MOX (10 μg mL−1 in pyridine) was added to the vial and shook 90 min at 37 °C, followed by 120 μL MSTFA at 37 °C for 120 min. GC-MS analysis was accomplished on a Shimadzu QP2010 Ultra GC-MS system using an Rtx-5MS capillary column (30 m × 0.25 mm, 0.25 μm film thickness). The injector temperature was 270 °C and the split ratio was 50:1. Helium was used as the carrier gas with a constant flow rate of 1.0 mL min−1. The column temperature was initially kept at 80 °C for 2 min and then increased to 180 °C at 10 °C min−1, to 240 °C at 5 °C min−1 and to 290 °C at 25 °C min−1, held for 9 min. Electron impact ionization (70 eV) at full scan mode (m/z 10–1000) was used, with an acquisition rate of 20 spectra per second. The ion source temperature was set to 200 °C and the interface temperature was 260 °C. The solvent cut time was 5 min.
000g, 10 min), an aliquot of 80 μL supernatant was derivatized using a two-step procedure.15 25 μL MOX (10 μg mL−1 in pyridine) was added to the vial and shook 90 min at 37 °C, followed by 120 μL MSTFA at 37 °C for 120 min. GC-MS analysis was accomplished on a Shimadzu QP2010 Ultra GC-MS system using an Rtx-5MS capillary column (30 m × 0.25 mm, 0.25 μm film thickness). The injector temperature was 270 °C and the split ratio was 50:1. Helium was used as the carrier gas with a constant flow rate of 1.0 mL min−1. The column temperature was initially kept at 80 °C for 2 min and then increased to 180 °C at 10 °C min−1, to 240 °C at 5 °C min−1 and to 290 °C at 25 °C min−1, held for 9 min. Electron impact ionization (70 eV) at full scan mode (m/z 10–1000) was used, with an acquisition rate of 20 spectra per second. The ion source temperature was set to 200 °C and the interface temperature was 260 °C. The solvent cut time was 5 min.
2.5 UFLC-IT-TOF/MS acquisition of serum samples and data processing
An aliquot of 20 μL serum was thawed and spiked with 40 μL IS (20 μg mL−1 FMOC-glycine and glibenclamide in acetonitrile) and 100 μL acetonitrile. After vortex for 5 min, the mixture was centrifuged at 16000g for 20 min twice. In a typical LC-MS analysis, a 5 μL aliquot of the mixture was injected into a Phenomenex Kinetex C18 column (100 mm × 2.1 mm, 2.6 μm) held at 40 °C using a Shimadzu UFLC/MS-IT-TOF (Shimadzu, Japan). The mobile phase was consisted of 0.1% formic acid (A) and acetonitrile (B) using a gradient elution of 5–95% B over 20 min, and 95% B from 20 to 23 min, and 5% B from 23 to 30 min. The flow rate was set at 0.4 mL min−1. The mass spectrometric data was collected using a Shimadzu IT-TOF/MS (Shimadzu, Kyoto, Japan) equipped with an electrospray ionization source operating in both positive and negative ion mode. The scan ranges were m/z 100–1000 in MS and MS2 modes; the detector voltage was 1.6 kV; the ESI voltage was 4.5 kV in positive ion mode and −3.5 kV in negative ion mode; the ion source and heat block were maintained at 200 °C; the nebulizing gas flow rate was 1.5 L min−1; the drying gas flow was 0.1 MPa, and the ion accumulation time was 30 ms. LC-MS solution 3.60 software (Shimadzu) with formula predictor was used for system controlling, data acquisition and chemical formulas prediction.
2.6 Data handing and chemometrics analyses
The acquired raw GC-MS and LC-MS data were processed by Profiling Solution (Shimadzu, Japan) for peak resolution and alignment using reported parameters.16 Three-dimensional data sets consisting of marched ion features with peak retention times, m/z value and corresponding intensities were generated. The ions presenting in at least 80% of either group with less than 30% relative standard deviation (RSD) in quality control (QC) samples were retained and normalized to the sum of all peak areas of each sample for principal component analysis (PCA) modeling.Orthogonal projection to latent structures discriminant analysis (OPLS-DA) was carried out after Pareto scaling for equal metabolite weighting in the SIMCA-P 13.0 software package (Umetrics. Umea, Sweden). The variables with a variable importance in the projection (VIP) > 1 were subjected to nonparametric Wilcoxon–Mann–Whitney test using SPSS software in order to find the changed metabolites with statistical significance (p < 0.05) between the models and controls in each time points. Then, absolute fold change analysis (FC) was conducted to screen features with absolute FC > 1.2.
Identification of the metabolites based on GC-MS data was firstly performed by searching the NIST database installed in the Shimadzu QP2010 Ultra GC-MS system. Metabolites with a similarity of more than 80% were finally verified by available reference compounds. Metabolites in LC-MS was identified by four steps: (1) quasi-molecular ion was judged by molecule ions, adduct ions and (de)-protonate molecule ions; (2) Formula Predictor (Shimadzu, Japan) was used for metabolites prediction; (3) MS/MS experiments were conducted to get the structure information; (4) database search.17 Discriminative ions were identified based on accurate molecular weights, molecular formula and MS/MS fragmentation proposed by the online Human Metabolome database (http://www.hmdb.ca/), Lipidmaps database (http://www.lipidmaps.org/) and Massbank (http://www.massbank.jp/). Finally, commercial standards were adopted to support the metabolites identification.
Heat-map was constructed using MultiExperiment View V4.6.1 (http://www.tm4.org). Statistical correlations were determined by Pearson's correlation analysis. For pseudo-kinetics analysis, time dependent first principle component based on PCA analysis and absolute fold change curves for individual metabolites were established. Tmax was obtained from the actual measured values. AUC was calculated by the GraphPad Prism 5. Metabolite relationships were derived from KEGG (http://www.kegg.jp/), SMPDB (http://www.smpdb.ca/) and existing literatures.
3 Results and discussion
3.1 Establishment of the VCR induced paralytic ileus model
The intestinal gross anatomy and histological structure results are shown in Fig. S-1.† Ileus after VCR treatment developed stepwise from day 0 to 8 while recovered at day 11. The most serious ileus symptom was observed at day 8 with empty rectum and ileum and impacted faeces filled colon. For histological examination, lymphoid infiltration and decreased villus thickness presented mild in day 4 and marked in day 8 and none in day 0 and 11.Levels of GI and GE are typical parameters for ileus diagnose. Compared to controls of day 4 and 8, GI and GE values in models were down-regulated, respectively (Fig. S-2A and B,† p < 0.05, calculated by Student's t-test) and their decrease peaked at day 8, while recovered at 11 day.
Body weight profiles of controls and models during the modeling are shown in Fig. S-2D.† A significant decrease was observed in the models, while an increase in controls after day 4. This result was consistent with the pathological study and GI/GE measurements. It indicates that the artificial modeling of paralytic ileus induced by VCR was successful on day 8 and that pathological condition was recovered after injection of 11 day.
3.2 Method validation for metabolomics approach
The data for system repeatability and stability of the proposed methods are listed in Table S-1.† Seven aliquots of a random sample were continuously injected to evaluate the repeatability. Stable retention times (Rt) and peak areas for forty metabolites in seven batches of serum samples were observed with the coefficient of variation (CV) less than 0.05 and 0.40. To validate the stability of the established method, an in-house QC sample was prepared by pooling an equal volume of each sample and injected every 10 samples during the whole sample analysis.18–20 The validation data acquired from the QC sample also showed good system stability. The CV of peak areas and Rt of metabolites were 0.07–0.29 and 0.01–0.04.3.3 Pseudo-kinetics analysis
In this study, we established a pseudo-kinetics approach to reveal more sensitive biomarkers along the disease development. The illustration of the strategy was shown in Fig. 1.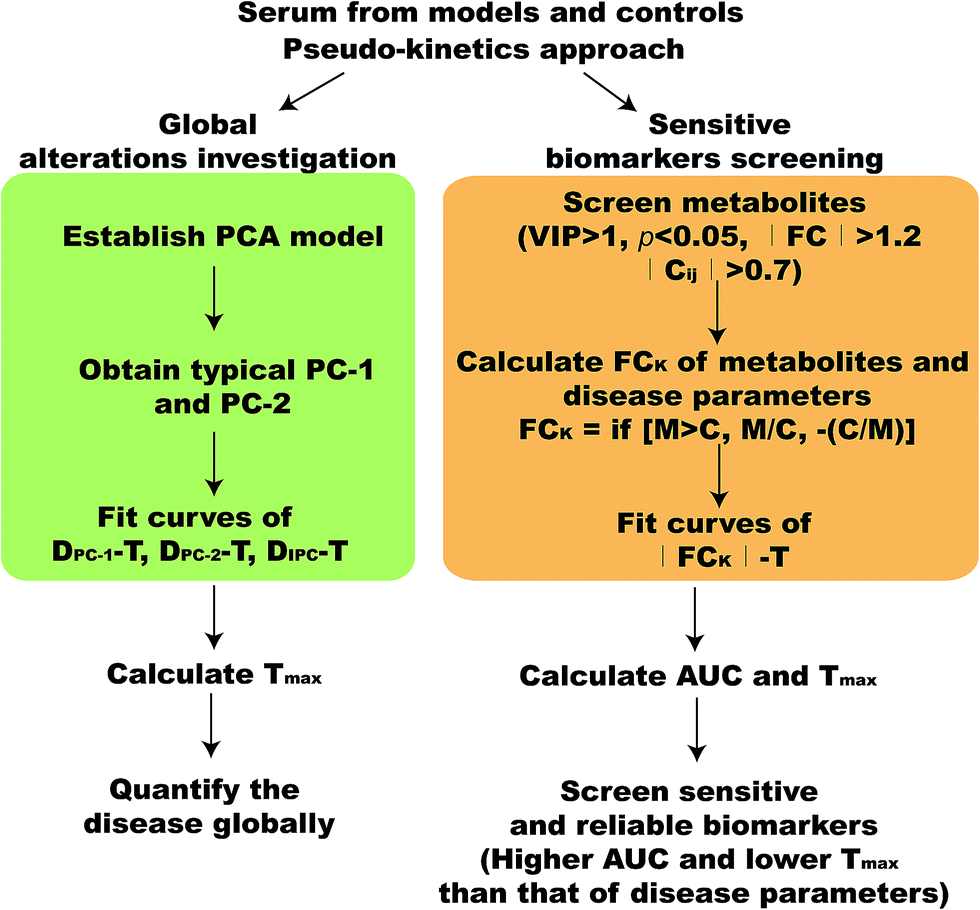 | ||
| Fig. 1 Scheme of pseudo-kinetics approach for time-series metabolomics investigation. | ||
![[C with combining macron]](https://www.rsc.org/images/entities/i_char_0043_0304.gif) (Mi represents models; is the average of controls; i represents individuals in model group) in PC-1 (DPC-1), PC-2 (DPC-2) and integrated PCs (DIPC) were fitted in Fig. 2A and B, respectively, which indicated metabolic shifts in different PCs.
(Mi represents models; is the average of controls; i represents individuals in model group) in PC-1 (DPC-1), PC-2 (DPC-2) and integrated PCs (DIPC) were fitted in Fig. 2A and B, respectively, which indicated metabolic shifts in different PCs.
 | ||
| Fig. 2 Global time-series analysis of paralytic ileus induced by VCR. (A) PCA trajectory plot is generated by centering PCA scores of model and control group at day 0, 4, 8 and 11; (B) time dependent curves of DPC-1 DPC-2 and DIPC. | ||
Tmax, curve peak time, is a widely used kinetic parameter to demonstrate the rate of variation. In Fig. 2B, Tmax of DIPC and DPC-1 is 8. It indicates the maximum variation derived from ileus modeling along PC-1 and integrated PCs presented at day 8, which is corresponding to the gross pathology. While Tmax of DPC-2 is 4, it represents metabolic shifts derived from ileus in the time points of day 4 also play important roles in clarifying the development of ileus. It is suspect that more susceptible metabolites to modeling presented peak variations at day 4 prior to the ileus of day 8. Thus, Tmax of DIPC DPC-1 and DPC-2 provides an accurate way to present the time point of maximum metabolic variations during the disease or toxicity globally.
 | ||
| Fig. 3 Metabolite profiling and features selection of three time points. (A–C) OPLS-DA score plots of model and control group at day 4, 8 and 11; (D–F) validation of the OPLS-DA models at day 4, 8 and 11 using a permutation test; (G–I) 3D-volcano plots (VIP values, log2(fold change), −log10(p-values)) of metabolites from model and control groups at day 4, 8 and 11; red dots represent metabolites have significant difference in their levels between model and control group, with a cutoff VIP > 1, p < 0.05, absolute FC > 1.2. | ||
To describe the dynamic variation trends, the average fold changes (FCKs) of the 39 metabolites and 2 ileus parameters were calculated (Table 1; FCk = If [Mi > , Mi/, −/Mi]; Mi represents models; is the average of controls; i represents individuals in model group) and time dependent absolute FCK curves of 39 metabolites and 2 ileus parameters were fitted. Area under the curve (AUC), a popular kinetic parameter, is integrated to quantify the degree of variation. In this study, AUCs of FCK (GE) represented the integration of discrimination derived from modeling characterized by GE values. Hence, they were efficient thresholds to screen metabolites with higher AUC than that of GI and GE values as sensitive biomarkers. Tmax can represent peak time of metabolic variation quantitatively. Tmaxs of GI and GE were 8. This indicated the intestinal injury peaked in day 8. Thus, metabolites with lower Tmax were praecox biomarkers for predicting the disease.
| Model | Metabolites | Average AUC | Tmax (day) | Average FCk | |||
|---|---|---|---|---|---|---|---|
| 0 d | 4 d | 8 d | 11 d | ||||
| LC-MS | Docosahexaenoic acid (DHA) | 24.89* | 4 | 1.21 | −3.04 | −2.25 | −1.62 |
| LC-MS | Glycocholic acid (GCA) | 46.05* | 4 | 1.07 | 5.94 | 4.78 | 2.28 |
| LC-MS | L-Acetylcarnitine | 23.81* | 4 | 1.11 | 2.75 | 2.34 | −1.60 |
| GC-MS | L-Glutamine | 23.67* | 4 | 1.02 | 3.27 | 1.89 | −1.29 |
| GC-MS | L-Serine | 13.93 | 4 | 1.21 | 1.45 | 1.01 | −1.45 |
| LC-MS | LysoPC(18:2) | 11.82 | 4 | 1.02 | 1.15 | 1.02 | −1.07 |
| LC-MS | LysoPC(O-16:0/0:0) | 14.25 | 4 | 1.03 | 1.41 | 1.31 | −1.31 |
| LC-MS | PG(20:1(11Z)/0:0) | 13.49 | 4 | 1.04 | 1.41 | 1.16 | −1.14 |
| GC-MS | Pyroglutamic acid | 13.22 | 4 | 1.02 | 1.34 | 1.14 | −1.22 |
| GC-MS | Uric acid | 12.95 | 4 | 1.01 | −1.26 | −1.19 | −1.15 |
| GC-MS | Citric acid | 20.09* | 8 | 1.04 | −2.00 | −2.34 | −1.21 |
| GC-MS | Linoleic acid | 15.49* | 8 | 1.05 | −1.47 | −1.66 | −1.13 |
| GC-MS | L-Tryptophan | 13.56 | 8 | 1.05 | −1.21 | −1.36 | −1.24 |
| LC-MS | LysoPC(17:0) | 14.51 | 8 | 1.02 | −1.26 | −1.60 | −1.22 |
| LC-MS | LysoPE(18:0) | 13.64 | 8 | 1.03 | 1.15 | 1.44 | 1.29 |
| LC-MS | MG(18:1(9Z)/0:0/0:0) | 13.92 | 8 | 1.04 | −1.31 | −1.34 | −1.27 |
| GC-MS | Oleic acid | 15.67* | 8 | 1.05 | −1.51 | −1.71 | −1.03 |
| GC-MS | Palmitelaidic acid | 24.56* | 8 | 1.14 | −1.91 | −3.33 | −1.99 |
| GC-MS | Palmitic acid | 14.85 | 8 | 1.11 | −1.24 | −1.65 | −1.26 |
| LC-MS | PE(P-16:0/0:0) | 14.25 | 8 | 1.03 | 1.25 | 1.53 | 1.22 |
| LC-MS | Propenoylcarnitine | 27.30* | 8 | 1.03 | 1.73 | 3.87 | 3.18 |
| LC-MS | SAM | 18.83* | 8 | 1.15 | −1.62 | −2.06 | −1.89 |
| LC-MS | 3-Hydroxy-octadecenoylcarnitine | 40.46* | 11 | 1.04 | 3.53 | 4.09 | 6.63 |
| GC-MS | 4-Hydroxy-L-proline | 14.58 | 11 | 1.01 | −1.30 | −1.43 | −1.57 |
| GC-MS | Butyric acid | 17.13* | 11 | 1.02 | 1.17 | 1.92 | 2.46 |
| GC-MS | D-Glutamic acid | 12.12 | 11 | 1.17 | 1.04 | 1.06 | −1.27 |
| LC-MS | HETE | 14.98* | 11 | 1.24 | 1.36 | 1.34 | 1.46 |
| GC-MS | L-Aspartic acid | 15.05* | 11 | 1.08 | −1.15 | −1.58 | −1.84 |
| GC-MS | L-Lysine | 12.64 | 11 | 1.01 | 1.19 | 1.12 | −1.29 |
| GC-MS | L-Threonine | 12.33 | 11 | 1.06 | 1.03 | −1.14 | −1.40 |
| GC-MS | L-Tyrosine | 13.23 | 11 | 1.09 | −1.17 | −1.25 | −1.33 |
| LC-MS | LysoPC(14:0) | 11.64 | 11 | 1.01 | −1.05 | −1.05 | 1.16 |
| LC-MS | LysoPC(17:1) | 13.97 | 11 | 1.09 | 1.29 | 1.20 | −1.62 |
| LC-MS | LysoPC(19:0) | 17.44* | 11 | 1.02 | −1.51 | −1.65 | −2.39 |
| LC-MS | LysoPC(22:5) | 15.61* | 11 | 1.19 | 1.03 | −1.63 | −2.27 |
| LC-MS | LysoPC(O-15:0/0:0) | 13.02 | 11 | 1.05 | −1.17 | −1.20 | 1.36 |
| LC-MS | LysoPE(16:0) | 11.94 | 11 | 1.02 | −1.03 | 1.14 | 1.19 |
| LC-MS | LysoPE(16:1) | 11.92 | 11 | 1.04 | 1.00 | 1.14 | 1.23 |
| LC-MS | Taurocholic acid (TCA) | 23.40* | 11 | 1.03 | 1.69 | 2.09 | −4.84 |
| GI | 14.86 | 8 | 1.02 | −1.31 | −1.68 | 1.13 | |
| GE | 21.65 | 8 | 1.00 | −2.04 | −2.85 | 1.01 | |
Compared with AUC and Tmax of GI and GE values, four sensitive biomarkers with higher AUC (p < 0.05, calculated by Student's t-test) and lower Tmax (p < 0.05, calculated by non-parameter test) were screened including docosahexaenoic acid, glycocholic acid, glutamine and acetyl-carnitine (Fig. 4A–D). In addition, the asterisk labeled metabolites listed in Table 1, such as palmitelaidic acid and propenoyl carnitine, represented higher AUCs than that of GI and GE values (p < 0.05), which contributed to the ileus mechanism.
 | ||
| Fig. 4 Absolute FCK time dependent curves of the four sensitive biomarkers and ileus parameters of GI and GE. | ||
Furthermore, receiver-operating characteristic (ROC) analysis was further conducted with their AUC calculations (Table S-5†) to investigate the discriminative abilities of the four biomarkers. With all samples, AUC of ROC curves were more than 0.8 and the sensitivities were higher than 0.7. They could be suggested that four biomarkers have abilities to diagnose ileus. Collectively, docosahexaenoic acid, glycocholic acid, glutamine and acetyl-carnitine screened by pseudo-kinetics approach were sensitive and reliable biomarkers during the process of ileus.
3.4 Biomarkers of paralytic ileus induced by VCR
VCR injected to rats can mimic clinical features of paralytic ileus. In order to understand the occurrence and development of ileus, metabolic signatures were investigated at the system level by employing pseudo-kinetics approach. Additionally, pathway concerned with VCR treatment was summarized in Fig. S-4.†The elevation of acetyl-carnitine was a prominent feature before ileus peak. Carnitine plays a vital role in cellular energy and transportation of fatty acids. It can be increased by oxidative stress and heavy weight loss.25 In addition, the amount of docosahexaenoic acid (DHA) was decreased in models prior to ileus. DHA, an important ω-3 fatty acid, can inhibit arachidonic acid metabolism to inflammatory eicosanoids and also can give rise to mediators that are less inflammatory. Down-regulations of DHA might induce inflammation.26 Therefore, alterations of carnitines and fatty acids before ileus suggest that oxidative stress and inflammation are vital factors for development of ileus. Notably, VCR can promote the release of inflammatory cytokines by modulating the cellular Ca2+ levels, free radical generation, TNF-α expression and myeloperoxidase activation, which further emphasize the inflammatory inducement in the process of ileus.27,28
Inflammation can promote the inflammatory destruction of the intestinal brush border. As a result, intestinal mucosa barrier protection is compromised and absorption function is disturbed.29 The accumulation of glutamine before ileus may attribute to the malabsorption for intestinal mucosa injury. Glutamine is the main respiratory substrate for enterocyte and plays a central role in colonocyte nutrition and integrity.30,31 In addition, glycocholic acid (GCA) and taurocholic acid (TCA) elevated significantly in the previous of ileus. They are products of cholesterol and involved in lipid intestinal absorption, energy homeostasis and inflammations. An accumulation of bile acids exacerbates experimental colitis.32 The increased conversion from cholesterol to GCA and TCA could be due to the damage of inflammation and resulted in an abnormal accumulation of toxic bile acids and thereby facilitated the pathological development of ileus. Therefore, inflammation may be a key factor for the formation of paralytic ileus.
Similarly, alterations of carnitines (propenoyl-carnitine), free fatty acids (linoleic, oleic, palmitelaidic and palmitic acids) and lipids (LysoPCs, LysoPEs and MGs) presented in the peak of ileus. Decreased lipid metabolism can increase the activations of pro-inflammatory transcription factor NF-κB and decrease the anti-inflammatory transcription factor PPAR-γ.26 In addition, amounts of L-tryptophan and L-proline were decreased in the peak of ileus. Tryptophan catabolism is a main pathway in acute intestinal inflammation. Specially, indoleamine-2,3-dioxygenase (IDO), the first enzyme in tryptophan catabolism, is up-regulated by pro-inflammatory stimuli, such as the cytokines IFN-γ and TNF-α.33 Moreover, tryptophan is known to protect the gastric mucosa from NSAID induced intestinal damage.34 Proline is an important amino acid in collagen. The decrease of proline is indicative of decreased collagen levels in the gastrointestinal tissue.35 Accordingly, inflammation and inflammatory mucosa injury exacerbates the intestinal lesion and paralytic ileus.
Furthermore, short chain fatty acids (SCFA), like butyrate, increased in models significantly after ileus. The SCFA are normally produced by the gut bacteria via the fermentation of complex carbohydrates such as fiber and starches. Butyrate provides energy to the intestinal cell wall and promotes epithelial cell growth.36 The increase of the microbiota-related metabolite suggests that gut bacterial ecology plays an important role during the recovery of ileus. In addition, tricarboxylic acid cycle (TAC) intermediates, such as malate, succinate, citrate and 2-oxoglutarate, were deceased at the time points of day 8 and 11. This observation suggests hyperactive energy metabolism may contribute to recovery of gastrointestinal motility.
Collectively, it is reasonable to speculate that VCR-treatment induced intestinal inflammation and mucosa injury are praecox and substantial molecular mechanism of paralytic ileus. Subsequently, abnormal energy metabolism and gut microbiota may reverse the ileus development. These findings will contribute to find the characteristic metabolic changes associated with the paralytic ileus. However, further study is needed to clarify the mechanism of change in these biomarkers, limitation of indications and extrapolation for application in humans.
4 Conclusions
In this article, to extract dynamic information of paralytic ileus induced by VCR, a pseudo-kinetics approach based on integration of absolute fold changes along the time points was proposed. A distance based discriminative trajectory was applied to assess global metabolic alterations during ileus progress. Individually, considering integral advantages along time progress, AUC and Tmax of absolute FCk–time curve were integrated as complementary thresholds to screen sensitive biomarkers, other than multivariate projection methods. Compared with typical parameters of ileus, four sensitive biomarkers with higher AUC and low Tmax were identified as praecox and substantial indicators with abilities to predict ileus. On this base, mucosa injury and intestinal inflammation were speculated as key factors to facilitate the development of ileus after VCR treatment. Collectively, our proposed pseudo-kinetics approach is efficient to screen sensitive features of dynamic metabolism related to disease development.Acknowledgements
This study was financially supported by the Natural Science Foundation of China (No. 81274108, 81302733, 81430082 and 81573385), the Natural Science Foundation of Jiangsu Province (No. BK20131310), the research project of Chinese Ministry of education (No. 113036A), the Research Projection Innovative Research Team, the Program for New Century Excellent Talents in University (No. NCET-13-1036), a Project Founded by the Priority Academic Program Development of Jiangsu Higher Education Institutions (PAPD).References
- J. Nicholson, J. Connelly and E. Holmes, Nat. Rev. Drug Discovery, 2002, 1, 153–161 CrossRef CAS PubMed.
- G. J. Patti, O. Yanes and G. Siuzdak, Nat. Rev. Drug Discovery, 2012, 13, 263–269 CAS.
- T. Fu, Eng. Appl. Artif. Intell., 2011, 24, 164–181 CrossRef.
- A. K. Smilde, J. A. Westerhuis, H. C. Hoefsloot, S. Bijlsma and C. M. Rubingh, Metabolomics, 2010, 6, 3–17 CrossRef CAS PubMed.
- J. Wang, P. Liu, M. Shen, S. Nahavandi and A. Kouzani, Comput. Meth. Programs Biomed., 2013, 11, 629–641 CrossRef PubMed.
- K. Wang, S. K. Ng and G. J. Mclachlan, BMC Bioinf., 2012, 13, 1–14 CrossRef PubMed.
- T. Johan, H. Elaine and L. Torbjorn, J. Proteome Res., 2007, 6, 469–479 CrossRef PubMed.
- S. Wold, N. Kettaneh and H. Friden, Chemom. Intell. Lab. Syst., 1998, 44, 331–340 CrossRef CAS.
- W. Zhang, L. Zhou, P. Yin, J. Wang, X. Lu, X. Wang, J. Chen, X. Lin and G. Xu, Sci. Rep., 2014 DOI:10.1038/srep08984.
- I. S. Johnson, H. F. Wright, G. H. Svoboda and J. Vlantis, Cancer Res., 1960, 20, 1016–1022 CAS.
- R. Bohannon, D. Miller and H. Diamond, Cancer Res., 1963, 23, 613–621 CAS.
- S. Swain and J. Arezzo, Clin. Adv. Hematol. Oncol., 2008, 6, 455–467 Search PubMed.
- E. Roca, E. Bruera, P. Politi, M. Barugel and L. Cedaro, Cancer Treat. Rep., 1985, 69, 149–151 CAS.
- P. Reynell and G. Spray, J. Physiol., 1956, 131, 452–462 CrossRef CAS.
- W. B. Dunn, D. Broadhurst, P. Begley and I. Wilson, Nat. Protoc., 2011, 6, 1061–1083 Search PubMed.
- H. G. Gika, G. A. Theodoridis, R. S. Plumb and I. D. Wilson, J. Pharm. Biomed. Anal., 2014, 87, 12–25 CrossRef CAS PubMed.
- J. Chen, X. Zhao and G. Xu, Anal. Chem., 2008, 80, 1280–1289 CrossRef CAS PubMed.
- H. G. Gika, G. A. Theodoridis, M. Earll and I. D. Wilson, Bioanalysis, 2012, 18, 2239–2247 CrossRef PubMed.
- S. Naz, M. Vallejo, A. García and C. Barbas, J. Chromatogr. A, 2014, 1353, 99–105 CrossRef CAS PubMed.
- W. B. Dunn, I. D. Wilson, A. W. Nicholls and D. Broadhurst, Bioanalysis, 2012, 18, 2249–2264 CrossRef PubMed.
- S. Wiklund, E. Johansson, L. Sjostrom, E. J. Mellerowicz, U. Edlund, J. P. Shockcor, J. Gottfries, T. Moritz and J. Trygg, Anal. Chem., 2008, 80, 115–122 CrossRef CAS PubMed.
- J. Romaguera, L. Medeiros, F. Hagemeister, L. Fayad, M. Rodriguez, B. Pro, A. Younes, P. Mclaughlin, A. Goy, A. Sarris, N. Dang, F. Samaniego, H. M. Brown, H. K. Gagneja and F. Cabanillas, Radiother. Oncol., 2003, 97, 586–591 Search PubMed.
- H. Park, J. Kim, K. Song and K. Seo, J. Vet. Sci., 2015, 16, 127–130 CrossRef PubMed.
- A. A. Ernst, M. L. Haynes, T. G. Nick and S. J. Weiss, Am. J. Emerg. Med., 1999, 17, 70–72 CrossRef CAS PubMed.
- V. Calabrese, A. M. Giuffrida Stella, M. Calvani and D. A. Butterfield, J. Nutr. Biochem., 2006, 17, 73–88 CrossRef CAS PubMed.
- P. C. Calder, Mol. Nutr. Food Res., 2008, 52, 885–897 CAS.
- A. S. Jaggi and N. Singh, Eur. J. Pharmacol., 2010, 648, 102–109 CrossRef CAS PubMed.
- A. Muthuraman and N. Singh, J. Nat. Med., 2011, 5, 480–487 CrossRef PubMed.
- R. K. Linskens, X. W. Huijsdens, P. H. Savelkoul, C. M. Vendenbrouckegrauls and S. G. Meuwissen, Scand. J. Gastroenterol., Suppl., 2011, 36, 29–40 CrossRef.
- J. M. Rhoads and G. Wu, Amino Acids, 2009, 37, 111–122 CrossRef CAS PubMed.
- M. E. Evans, D. P. Jones and T. R. Ziegler, Am. J. Physiol.: Gastrointest. Liver Physiol., 2005, 289, 388–396 CrossRef PubMed.
- X. Zhou, L. Cao, C. Jiang, Y. Xie, X. Cheng, Y. Qi, L. Sun, G. Wang and P. Hao, Nat. Commun., 2014 DOI:10.1038/ncomms5573.
- A. L. Mellor and D. H. Munn, Nat. Rev. Immunol., 2004, 4, 762–774 CrossRef CAS PubMed.
- P. C. Konturek, S. J. Konturek, K. Cellinski, M. Slomka, H. Cichoz-Lach, W. Bielanski and R. J. Reiter, J. Pineal Res., 2010, 48, 318–323 CrossRef CAS PubMed.
- K. Takeuchi, M. Ohishi, S. Ota, K. Suzumura, H. Naraoka, T. Ohata, J. Seki, Y. Miyamae, M. Honma and T. Soga, J. Proteome Res., 2013, 12, 1399–1407 CrossRef CAS PubMed.
- M. Watanabe, S. M. Houten, C. Mataki, M. A. Christoffolete, B. W. Kim, H. Sato, N. Messaddeq, J. W. Harney, O. Ezaki, T. Kodama, K. Schoonjans and J. Auwerx, Nature, 2006, 439, 484–489 CrossRef CAS PubMed.
Footnote |
| † Electronic supplementary information (ESI) available: Gastrointestinal transit (GI) and gastric emptying (GE) measurement. Table S-1. The stability and repeatability of the proposed method. Table S-2. Parameters of OPLS-DA models based on the different time points in GC-MS and LC-MS. Table S-3. Metabolites identified by GC-MS. Table S-4. Metabolites identified by LC-MS. Table S-5. Sensitivity and specificity of ROC curves based on four biomarkers. Fig. S-1. Scheme and histology results of the animal experiment in the present study. Fig. S-2. Gastric emptying, gastrointestinal transit, urea nitrogen/creatinine ratio and body weight profiles during the model periods. Fig. S-3. Pearson's correlations of metabolites and ileus parameters. Fig. S-4. Altered metabolic pathways during ileus. See DOI: 10.1039/c6ra12641c |
| This journal is © The Royal Society of Chemistry 2016 |