Photoelectrochemical properties of Ti-doped hematite nanosheet arrays decorated with CdS nanoparticles

Xin Xie, Kui Li and Wei-De Zhang*
School of Chemistry and Chemical Engineering, South China University of Technology, 381 Wushan Road, Guangzhou 510640, People's Republic of China. E-mail: zhangwd@scut.edu.cn; Fax: +86-20-8711-4099; Tel: +86-20-8711-4099

Received 9th May 2016 , Accepted 27th July 2016

First published on 28th July 2016


Abstract

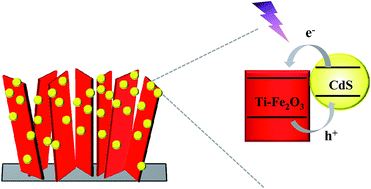
Hematite (α-Fe2O3), with a relatively narrow bandgap (2.0–2.2 eV), is well-suited for potential application as a photoanode in photoelectrochemical (PEC) cells. Unfortunately, it suffers from severe bulk carrier recombination and low conductivity. This study provides a way to overcome these shortages by constructing a novel electrode system comprised of vertically aligned Ti-doped hematite nanosheet arrays decorated with cadmium sulfide nanoparticles (Ti-Fe2O3/CdS). Ti doping improves the conductivity of hematite and simultaneously extends the spectral responsive range. The incorporation of CdS nanoparticles further facilitates the charge separation and transfer process. Subsequently, the fabricated Ti-Fe2O3/CdS electrode achieves 6-fold enhancement of photocurrent density with respect to pristine Fe2O3 and excellent operation stability. Meanwhile, an obvious negative shift of photocurrent onset potential by 500 mV is observed.

1. Introduction

Photoelectrochemical (PEC) water splitting using semiconductor electrodes offers a promising, but challenging approach to harvest solar energy in the form of storable chemical energy.1–4 Hematite (α-Fe2O3), an n-type semiconductor material, has demonstrated its potential application in photocatalysis and photoelectrochemistry due to its proper optical band gap (2.0–2.2 eV), excellent chemical stability, abundance on the earth, and low cost.5–8 Nevertheless, the poor conductivity restricted by the short diffusion length of holes (2–4 nm) in hematite results in severe bulk carrier recombination and thus largely restricts its practical applications.9–13 One feasible method for alleviating these limitations is to build host-guest Fe2O3-based heterostructures. For instance, Fe2O3/Fe2TiO5,14,15 Fe2O3/TiO2,16 Fe2O3/NiO,17 Fe2O3/g-C3N4,18 Fe2O3/ZnFe2O4 (ref. 19) heterostructures have been reported to display significantly improved separation efficiency of photogenerated electron–hole pairs and enhanced PEC properties compared to the pristine hematite. To date, various nanostructures have been extensively investigated as host materials. Among the nanostructures employed, vertically aligned nanosheet arrays on the conducting substrate have been highlighted as the most desirable scaffold nanostructures due to their multiple features, including efficient electron transportation, enhanced light harvesting and enlarged surface area for loading guest materials, compared to their bulk counterparts, which undoubtedly maximized synergistic effect of host and guest materials.20 However, because hematite has intrinsically poor conductivity, the PEC performance of Fe2O3 is still poor. Available experimental evidence demonstrates that incorporation of titanium could improve the electrical conductivity of hematite mainly by changing carrier density,21,22 electronic structure23 and/or crystal size.24 In this study, Ti-doped hematite nanosheet arrays were used as host scaffold material.

On the other hand, cadmium sulfide (CdS) is considered to be an ideal guest material on hematite nanosheet arrays due to its relatively narrow band gap of 2.4 eV that allows efficient light absorption25 and excellent match of the energy band positions with those of Fe2O3 for PEC water splitting. Such thermodynamically favored state enables photogenerated electrons to transfer from the conduction band of CdS to that of Fe2O3, thus promoting charge separation at the interface of Fe2O3 and CdS. Moreover, CdS can be inexpensively synthesized. Previous reports have suggested that the Fe2O3/CdS heterostructures could be used as high-performance solar-driven photocatalyst for pollutant degradation and PEC detection of chemical species.26–29 Nonetheless, to the best of our knowledge, there is no relevant report that combines CdS with Ti-doped Fe2O3 nanosheet arrays as photoanode materials to develop PEC cells.

In this work, vertically aligned Ti-doped hematite nanosheet arrays are demonstrated as conducting host scaffolds to load CdS nanoparticles to form a heterostructure composite anode for efficient PEC water splitting. The optimal PEC activity of Ti-Fe2O3/CdS nanosheet arrays as a photoanode has been systematically analyzed. This study not only unveils these novel Ti-Fe2O3/CdS nanostructures' great potential as photoanodes for the PEC water splitting, but also offers a feasible strategy to boost the PEC performance based on structural design.

2. Experimental section

2.1. Synthesis of samples

Fabrication of the Fe2O3 nanosheet arrays is realized by electrodeposition followed by annealing at elevated temperature, using fluorine-doped tin-oxide (FTO) substrate, platinum electrode and saturated Ag/AgCl electrode as working electrode, counter electrode and reference electrode, respectively. The electrodeposition was carried out at 0.644 V versus Ag/AgCl at 70 °C for 10 min in aqueous solution containing 0.010 M (NH4)2Fe(SO4)2 and 0.040 M CH3COOK. After electrodeposition, the films were rinsed with deionized water and heated at 500 °C for 1 h in N2. Titanium treatment was performed by drop-casting tetrabutyl titanate solution onto the as-prepared Fe2O3 films prior to thermal treatment in 750 °C for 10 min.30 CdS nanoparticles were directly grown on the obtained Fe2O3 and Ti-Fe2O3 by putting the films in aqueous solution containing 2 mM Cd(Ac)2 and 2 mM thiourea, followed by sealing in an autoclave at 140 °C for 2 h. The obtained CdS-coated photoanodes were dried and sintered at 400 °C for 30 min in N2.

2.2. Characterization

The as-synthesized samples were characterized by X-ray diffractometer (XRD, X' Pert MPD Pro), X-ray photoelectron spectroscopy (XPS, ESCALAB 250XI, Thermo), field emission scanning electron microscopy (FE-SEM, Merlin Compact, Carl Zeiss) and UV-vis diffuse reflectance spectroscopy (DRS, Hitachi U3010).

2.3. PEC measurements

PEC measurements were carried out on an electrochemical workstation (CHI660C, Chenghua, Shanghai) with a three-electrode configuration in aqueous solution containing 0.50 M Na2S and 0.50 M Na2SO3. The fabricated films on FTO, a platinum electrode and a saturated Ag/AgCl electrode served as working electrode, counter electrode and reference electrode, respectively. AM 1.5G solar simulator (Oriel model 91192) was used as the light source with an output intensity of 100 mW cm−2. The area of the working electrode exposed to the electrolyte was fixed at 0.25 cm2 by nonconductive epoxy coating. The linear sweep voltammograms were swept from −1.1 to 0.6 V versus Ag/AgCl both in the dark and under irradiation. A potential of 0.2 V versus Ag/AgCl was applied for the current density–time transient response testing. Mott–Schottky analysis was conducted from −1.0 to 0.2 V versus Ag/AgCl under dark condition and the electrochemical impedance spectra (EIS) were recorded in a frequency range of 0.01 to 105 Hz at open circuit voltages.

3. Results and discussion

XRD patterns of the samples are depicted in Fig. 1. The diffraction peaks of Fe2O3 can be well-indexed to the rhombohedral phase (JCPDS 33-0664). Compared to Fe2O3, the (104) and (110) peaks of Ti-Fe2O3 slightly shift to lower angles (Fig. 1B), indicating the lattice expansion of Fe2O3 when introducing Ti atoms.31,32 This result confirms that Ti atoms are successfully embedded in the lattice of hematite. In addition, no peaks corresponding to TiO2 are observed in the Ti-Fe2O3 sample, suggesting that Ti atoms are embedded in the lattice of hematite rather than forming a new phase. When the CdS nanoparticles are introduced onto hematite nanosheet surface, a new peak at 2θ = 41.6° can be observed in the patterns of the Fe2O3/CdS and Ti-Fe2O3/CdS samples, corresponding to (111) plane of CdS (JCPDS 43-0985), which confirms that CdS nanoparticles have been successfully synthesized. In contrast to strong and sharp diffraction peaks, the broad diffraction peaks of CdS in this work suggest that small CdS crystals could be obtained.
image file: c6ra11978f-f1.tif
Fig. 1 (A) XRD patterns of (a) Fe2O3, (b) Ti-Fe2O3, (c) Fe2O3/CdS, and (d) Ti-Fe2O3/CdS nanosheet arrays. (B) Magnification of XRD patterns of Ti-Fe2O3 and Fe2O3 in 25–45°.

XPS was employed to investigate the environment of Ti in the Fe2O3. As shown in Fig. 2A, Ti signal is detected in the Ti-Fe2O3 sample. The peaks are assigned to Ti 2p1/2 and Ti 2p3/2. The high resolution XPS spectrum of Ti 2p (Fig. 2B) reveals that the peak of Ti 2p3/2 at binding energy of 458.4 eV shows a shift toward lower binding energy compared to the reported value of Ti4+ in pure TiO2 (458.5 eV), which might be related to the creation of oxygen vacancies and Ti3+ defects. The Ti to Fe ratio in the Ti-Fe2O3 electrode is about 0.03 according to XPS analysis. Representative STEM mapping of Ti-Fe2O3 nanosheet shows the spatial distribution of Fe, O and Ti, confirming the uniform distribution of Ti in the Ti-Fe2O3 (Fig. 2C).


image file: c6ra11978f-f2.tif
Fig. 2 XPS spectra of Ti-Fe2O3 (A) survey and (B) Ti 2p, (C) representative STEM mapping of the Ti-Fe2O3 nanosheets.

The morphological features of all the samples were characterized by FESEM (Fig. 3). As presented in Fig. 3A, Fe2O3 sample consists of vertically aligned nanosheet arrays with thickness varying from 50 to 100 nm. No additional deposits or obvious differences in morphology could be distinguished after Ti doping (Fig. 3B). Both Fe2O3 and Ti-Fe2O3 nanosheets display smooth surface. Deposition of CdS causes the surface roughening. Small CdS nanoparticles with sizes around 50 nm are compactly coated onto the surfaces of Fe2O3 and Ti-Fe2O3 nanosheets (Fig. 3C and D). A rough surface is favorable since it enlarges the surface area of nanosheets and leads to an improved charge transfer at the electrode/electrolyte interface.


image file: c6ra11978f-f3.tif
Fig. 3 SEM images of (A) Fe2O3, (B) Ti-Fe2O3, (C) Fe2O3/CdS and (D) Ti-Fe2O3/CdS nanosheet arrays.

Because the optical absorption properties play an important role in PEC applications, the samples were also characterized by UV-vis diffuse reflectance spectroscopy. Fig. 4 shows the comparison of the DRS among Fe2O3, Ti-Fe2O3, Fe2O3/CdS and Ti-Fe2O3/CdS films. It is observed that all the samples respond to the visible light. Fe2O3 film exhibits a broad absorption with the absorption edge at approximately 620 nm. In comparison to the Fe2O3, Ti-Fe2O3 film exhibits much higher absorption intensity. Moreover, the absorption edge of the Ti-Fe2O3 obviously shifted to a longer wavelength, indicating the narrowing of the band gap occurs when introducing Ti atoms. This narrowing could be attributed to the creation of additional energy level which is more positive than the conduction band of Fe2O3 as a result of Ti doping. Such similar phenomenon is also found in other Ti-doped hematite materials.33–35 After being deposited with CdS nanoparticles, both Fe2O3/CdS and Ti-Fe2O3/CdS show an enhanced absorption and extended absorption edge. The superior light absorption ability of the Ti-Fe2O3/CdS sample is also beneficial to the improvement of PEC response.


image file: c6ra11978f-f4.tif
Fig. 4 UV-vis diffuse reflectance spectra of Fe2O3, Ti-Fe2O3, Fe2O3/CdS and Ti-Fe2O3/CdS samples.

The photoelectrochemical performance of the as-prepared photoanodes was investigated using current density–potential (JV) characteristic (Fig. 5A) and current density–time (Jt) transient response testing (Fig. 5B). Fig. 5A shows JV curves of Fe2O3, Fe2O3/CdS, Ti-Fe2O3, and Ti-Fe2O3/CdS samples conducted both in the dark and under illumination. Because there is no significant distinction among the JV curves recorded in the dark, only the dark current density curve of the Fe2O3 sample is presented as a representative. As illustrated in Fig. 5, the Fe2O3 electrode prepared in this work delivers considerably low photocurrent density less than 0.5 mA cm−2 at 0.2 V versus Ag/AgCl. After coupling with CdS nanoparticles, the photocurrent density shows great enhancement in the whole potential range. Obviously, the introduction of CdS boosts the light absorption, as shown in Fig. 4, and the type-II band alignment between Fe2O3 and CdS benefits the separation of photogenerated electron–hole pairs. In addition, the CdS nanoparticles enlarge the surface area of the composite photoanode, which is beneficial to charge transfer at the electrode/electrolyte interface and thus the higher current density. It is also found that doping Fe2O3 with Ti leads to notable increase in photocurrent density. At 0.2 V versus Ag/AgCl, the photocurrent density of Ti-Fe2O3 reaches 1.5 mA cm−2, which is more than 3-fold higher than that of pristine Fe2O3. The larger photocurrent can be attributed to the improvement of light harvesting and the enhancement of electrical conductivity derived from the incorporation of Ti dopants into hematite nanostructure. As a result, Ti-Fe2O3/CdS shows the maximum photocurrent density giving value of 2.7 mA cm−2 at 0.2 V vs. Ag/AgCl, which is more than 6-fold higher than that of pristine Fe2O3 film and about 2- and 3-fold higher than that of Ti-Fe2O3 and Fe2O3/CdS. It is noteworthy that the onset potentials of the photocurrent shift cathodically for both Fe2O3/CdS and Ti-Fe2O3/CdS after CdS nanoparticles are attached, which would benefit the PEC water splitting at lower voltage. The negative shift of the onset potentials demonstrates more efficient interfacial charge transfer that avoid hole accumulating at the electrode surface and thus decreases surface charge recombination.36 Beyond that, all the samples are prompt in generating reproducible response to light on–off cycles, indicating a quick charge transport process can be achieved (Fig. 5B). When exposing to 1800 s illumination, the Ti-Fe2O3/CdS electrode shows excellent stability with up to 94% retention of its initial photocurrent density.


image file: c6ra11978f-f5.tif
Fig. 5 (A) JV curves and (B) Jt curves of (a) Ti-Fe2O3/CdS, (b) Ti-Fe2O3, (c) Fe2O3/CdS and (d) Fe2O3 nanosheet arrays.

To understand the origin of the different PEC responses, Mott–Schottky (MS) plot and electrochemical impedance spectroscopy (EIS) measurements were carried out. The positive slopes in Fig. 6A indicate that the Fe2O3, Fe2O3/CdS, Ti-Fe2O3, and Ti-Fe2O3/CdS are all n-type semiconductors with electrons as majority carriers. The carrier density is linearly proportional to conductivity.37 Enhanced conductivity would prolong the lifetime of the charge carriers and reduce the recombination of electron–hole pairs, thereby improving the PEC performance. Obtained from the Mott–Schottky equation,38–40 the calculated electron densities of Fe2O3, Fe2O3/CdS, Ti-Fe2O3, and Ti-Fe2O3/CdS were 8.55 × 10¹⁹, 2.23 × 10²⁰, 3.74 × 10²⁰, 8.36 × 10²⁰, respectively. Apparently, the electron densities of the samples comply with the orders in PEC measurement. Ti-Fe2O3 films achieved higher carrier density than the pristine Fe2O3. This is direct evidence to support that the Ti dopant serves as electron donor to increase the electron density of Fe2O3. In addition, the electron density of Ti-Fe2O3/CdS is higher than that of Ti-Fe2O3. This is associated with the formation of a CdS enveloping layer which enhances charge carrier separation and transfer. The flatband potential at electrode/electrolyte interface were also estimated by the X-intercepts of the linear region in the Mott–Schottky plots. As displayed in Fig. 6A, deposition of CdS nanoparticles leads to negative shift of flatband potential, which is in good agreement with the onset potential in JV curves. The negative shift of flatband potential and increased electron density of the Ti-Fe2O3/CdS electrode are favorable for the enhancement of PEC performance.


image file: c6ra11978f-f6.tif
Fig. 6 (A) Mott–Schottky plots and (B) electrochemical impedance spectra (Nyquist plots) of Fe2O3, Ti-Fe2O3, Fe2O3/CdS and Ti-Fe2O3/CdS samples.

EIS is used to characterize charge transfer properties at electrode/electrolyte interface (Fig. 6B). The radius of the arc in the EIS Nyquist plots reflects the interfacial charge transfer resistance.41 It is obvious that the Ti-Fe2O3/CdS electrode possesses the lowest interfacial charge transfer resistance, indicating the highest charge separation and transfer efficiency. The arc radius of Fe2O3/CdS is smaller than that of the pristine Fe2O3, proving that the decoration of CdS nanoparticles has accelerated the charge transfer process due to the type II band alignment between Fe2O3 and CdS. Moreover, the smaller interfacial charge transfer resistance of Ti-Fe2O3/CdS than that of Fe2O3/CdS implies that Ti dopant played an important role in promoting the charge separation and transfer process.

Based on the aforementioned analysis, the origin of the remarkable PEC performance of the Ti-Fe2O3/CdS electrode was proposed and displayed in Scheme 1. Employing vertically aligned nanosheet arrays of Fe2O3 offers advantages of efficient electron transportation, enhanced light harvesting and high surface area for the deposition of CdS. Ti doping into the hematite promotes the conductivity and simultaneously extends the spectral responsive range of hematite. The introduction of CdS nanoparticles leads to increasing surface roughness and larger surface area, which is not only conducive to light absorption, but also beneficial to accelerate the interfacial charge transfer. Furthermore, the matched energy band positions of CdS with those of Ti-Fe2O3 induce the formation of a Ti-Fe2O3/CdS heterojunction, which allows for the better separation of the photogenerated electron–hole pairs. Briefly, under illumination, both Ti-Fe2O3 and CdS can be photoexcited to generate electron–hole pairs. Due to the type II alignment between Ti-Fe2O3 and CdS, the excited electrons in the conduction band of CdS can easily transport to that of Ti-Fe2O3 and subsequently transfer to the Pt counter electrode under the assistance of applied voltage to produce hydrogen by reducing water (2H+ + 2e → H2). That is, the Ti-Fe2O3 scaffold acts as electron trap to promote charge separation. Simultaneously, the holes remaining in the valence band of Ti-Fe2O3 can efficiently inject to those of CdS and then be consumed by the hole scavengers (S2−) at electrode/electrolyte interface. Thus, the photogenerated electron–hole pairs are effectively separated, and accordingly hindering their recombination. All the PEC measurements provide evidences that the Ti-Fe2O3/CdS electrode shows an enhanced PEC activity due to the synergistic effect of CdS, Ti dopant, and Fe2O3.


image file: c6ra11978f-s1.tif
Scheme 1 Schematic of the Ti-Fe2O3/CdS photoanode.

4. Conclusion

In summary, a novel electrode comprised of vertically aligned Ti-doped hematite nanosheet arrays decorated with cadmium sulfide (CdS) nanoparticles (Ti-Fe2O3/CdS) was fabricated. The Ti-Fe2O3/CdS electrode was demonstrated as an effective photoanode for PEC water splitting. The introduction of Ti dopant into the hematite not only results in the improvement of conductivity but also contributes to the enhancement of spectral responsive range. Loading CdS nanoparticles onto the surface of Ti-Fe2O3 nanosheets leads to efficient separation of photogenerated electrons and holes. Compared to pristine hematite electrode, the Ti-Fe2O3/CdS electrode shows an increased photocurrent density to more than 6-fold at 0.2 V versus Ag/AgCl, and the onset potential of the photocurrent shifted cathodically by 500 mV. The Ti-Fe2O3/CdS electrode also displays high stability. The significant improvement of PEC performance of the Ti-Fe2O3/CdS film can be ascribed to enhanced light absorption and increased charge carrier density as well as effective separation and transfer of the photogenerated electron–hole pairs. The work demonstrates an efficient way to fabricate Fe2O3-based photoanodes with 3D nanostructures and high performance for photoelectrochemical water splitting.

Acknowledgements

This work was financially supported by Guangdong Natural Science Foundation (2014A030311039).

References

  1. Q. Yu, X. G. Meng, T. Wang, P. Li and J. H. Ye, Adv. Funct. Mater., 2015, 25, 2686–2692 CrossRef CAS.
  2. L. F. Xi, P. D. Tran, S. Y. Chiam, P. S. Bassi, W. F. Mak, H. K. Mulmudi, S. K. Batabyal, J. Barber, J. S. C. Loo and L. H. Wong, J. Phys. Chem. C, 2012, 116, 13884–13889 CAS.
  3. K. Sivula, F. L. Formal and M. Grätzel, ChemSusChem, 2011, 4, 432–449 CrossRef CAS PubMed.
  4. Y. J. Lin, G. B. Yuan, S. Sheehan, S. Zhou and D. W. Wang, Energy Environ. Sci., 2011, 4, 4862–4869 CAS.
  5. Y. C. Ling, G. M. Wang, D. A. Wheeler, J. Z. Zhang and Y. Li, Nano Lett., 2011, 11, 2119–2125 CrossRef CAS PubMed.
  6. Y. G. Xu, L. Q. Jing, X. Chen, H. Y. Ji, H. Xu, H. P. Li, H. M. Li and Q. Zhang, RSC Adv., 2016, 6, 3600–3607 RSC.
  7. M. Li, J. J. Deng, A. W. Pu, P. P. Zhang, H. Zhang, J. Gao, Y. Y. Hao, J. Zhong and X. H. Sun, J. Mater. Chem. A, 2014, 2, 6727–6733 CAS.
  8. H. H Niu, S. W. Zhang, Q. Ma, S. X. Qin, L. Wan, J. Z. Xu and S. D. Miao, RSC Adv., 2013, 3, 17228–17235 RSC.
  9. Y. F. Xu, H. S. Rao, B. X. Chen, Y. Lin, H. Y. Chen, D. B. Kuang and C. Y. Su, Adv. Sci., 2015, 2, 1500049 CrossRef.
  10. Y. Liu, Y. X. Yu and W. D. Zhang, Electrochim. Acta, 2012, 59, 121–127 CrossRef.
  11. D. H. Taffa, I. Hamm, C. Dunkel, I. Sinev, D. Bahnemanncd and M. Wark, RSC Adv., 2015, 5, 103512–103522 RSC.
  12. J. S. Yang, W. H. Lin, C. Y. Lin, B. S. Wang and J. J. Wu, ACS Appl. Mater. Interfaces, 2015, 7, 13314–13321 CAS.
  13. K. Sivula, R. Zboril, F. L. Formal, R. Robert, A. Weidenkaff, J. Tucek, J. Frydrych and M. Grätzel, J. Am. Chem. Soc., 2010, 132, 7436–7444 CrossRef CAS PubMed.
  14. J. J. Deng, X. X. Lv, J. Y. Liu, H. Zhang, K. Q. Nie, C. H. Hong, J. O. Wang, X. H. Sun, J. Zhong and S. T. Lee, ACS Nano, 2015, 9, 5348–5356 CrossRef CAS PubMed.
  15. W. T Qiu, Y. C. Huang, B. Long, H. B. Li, Y. X. Tong and H. B. Ji, Chem.–Eur. J., 2015, 21, 19250–19256 CrossRef PubMed.
  16. D. Barreca, G. Carraro, A. Gasparotto, C. Maccato, M. E. A. Warwick, K. Kaunisto, C. Sada, S. Turner, Y. Gönüllü, T. P. Ruoko, L. Borgese, E. Bontempi, G. V. Tendeloo, H. Lemmetyinen and S. Mathur, Adv. Mater. Interfaces, 2015, 2, 1500313 CrossRef.
  17. W. Q. Fan, C. Zhang, H. Y. Bai, X. Q. Yu and W. D. Shi, Eur. J. Inorg. Chem., 2014, 3608–3613 CrossRef CAS.
  18. Y. Liu, Y. X. Yu and W. D. Zhang, Int. J. Hydrogen Energy, 2014, 39, 9105–9113 CrossRef CAS.
  19. K. J. McDonald and K. S. Choi, Chem. Mater., 2011, 23, 4863–4869 CrossRef CAS.
  20. M. Zhoua, X. W. Lou and Y. Xie, Nano Today, 2013, 8, 598–618 CrossRef.
  21. Z. L. Wang, G. J. Liu, C. M. Ding, Z. Chen, F. X. Zhang, J. Y. Shi and C. Li, J. Phys. Chem. C, 2015, 119, 19607–19612 CAS.
  22. G. M. Wang, Y. C. Ling, D. A. Wheeler, K. E. N. George, K. Horsley, C. Heske, J. Z. Zhang and Y. Li, Nano Lett., 2011, 11, 3503–3509 CrossRef CAS PubMed.
  23. C. X. Kronawitter, I. Zegkinoglou, S. H. Shen, P. Liao, I. S. Cho, O. Zandi, Y. S. Liu, K. Lashgari, G. Westin, J. H. Guo, F. J. Himpsel, E. A. Carter, X. L. Zheng, T. W. Hamann, B. E. Koel, S. S. Mao and L. Vayssieres, Energy Environ. Sci., 2014, 7, 3100–3121 CAS.
  24. M. H. Lee, J. H. Park, H. S. Han, H. J. Song, I. S. Cho, J. H. Noh and K. S. Hong, Int. J. Hydrogen Energy, 2014, 39, 17501–17507 CrossRef CAS.
  25. Y. Liu, Y. D. Cui, F. Y. Huang and X. Z. Yang, RSC Adv., 2016, 6, 16668–16672 RSC.
  26. A. Kudo and Y. Miseki, Chem. Soc. Rev., 2009, 38, 253–278 RSC.
  27. Y. Shi, H. Y. Li, L. Wang, W. Shen and H. Z. Chen, ACS Appl. Mater. Interfaces, 2012, 4, 4800–4806 CAS.
  28. J. Tang, J. Li, Y. Y. Zhang, B. Kong, Yiliguma, Y. Wang, Y. Z. Quan, H. Cheng, A. M. Al-Enizi, X. G. Gong and G. F. Zheng, Anal. Chem., 2015, 87, 6703–6708 CrossRef CAS PubMed.
  29. S. W. Zhang, W. Q. Xu, M. Y. Zeng, J. X. Li, J. Z. Xu and X. K. Wang, Dalton Trans., 2013, 42, 13417 RSC.
  30. R. Franking, L. Li, M. A. Lukowski, F. Meng, Y. Z. Tan, R. J. Hamers and S. Jin, Energy Environ. Sci., 2013, 6, 500–512 CAS.
  31. R. R. Prabhakar, N. Mathews, K. B. Jinesh, K. R. G. Karthik, S. S. Pramana, B. Varghese, C. H. Sowc and S. Mhaisalkar, J. Mater. Chem., 2012, 22, 9678 RSC.
  32. H. Uchiyama, M. Yukizawa and H. Kozuka, J. Phys. Chem. C, 2011, 115, 7050–7055 CAS.
  33. Y. Liu, D. P. Wang, Y. X. Yu and W. D. Zhang, Int. J. Hydrogen Energy, 2012, 37, 9566–9575 CrossRef CAS.
  34. N. Uekawa, M. Watanabe and K. Kaneko, J. Chem. Soc., Faraday Trans., 1995, 91, 2161–2166 RSC.
  35. S. Kumari, A. P. Singh, Sonal, D. Deva, R. Shrivastav, S. Dass and V. R. Satsangi, Int. J. Hydrogen Energy, 2010, 35, 3985–3990 CrossRef CAS.
  36. W. X. Ouyang, Y. X. Yu and W. D. Zhang, Phys. Chem. Chem. Phys., 2015, 17, 14827–14835 RSC.
  37. S. H. Shen, C. X. Kronawitter, D. A. Wheeler, P. H. Guo, S. A. Lindley, J. G. Jiang, J. Z. Zhang, L. J. Guo and S. S. Mao, J. Mater. Chem. A, 2013, 1, 14498 CAS.
  38. Y. C. Ling, G. M. Wang, J. Reddy, C. C. Wang, J. Z. Zhang and Y. Li, Angew. Chem., Int. Ed., 2012, 51, 4074–4079 CrossRef CAS PubMed.
  39. P. Wang, D. G. Wang, J. Lin, X. L. Li, C. Peng, X. Y. Gao, Q. Huang, J. Q. Wang, H. J. Xu and C. H. Fan, ACS Appl. Mater. Interfaces, 2012, 4, 2295–2302 CAS.
  40. R. H. Gonc-alves, B. H. R. Lima and E. R. Leite, J. Am. Chem. Soc., 2011, 133, 6012–6019 CrossRef CAS PubMed.
  41. K. Zhao, X. Q. Yan, Y. S. Gu, Z. Kang, Z. M. Bai, S. Y. Cao, Y. C. Liu, X. H. Zhang and Y. Zhang, Small, 2016, 12, 245–251 CrossRef CAS PubMed.

This journal is © The Royal Society of Chemistry 2016
Click here to see how this site uses Cookies. View our privacy policy here.