Insight into the inhibition mechanism of kukoamine B against CpG DNA via binding and molecular docking analysis†
Xinchuan Zhenga,
Ning Wanga,
Yongjun Yanga,
Yingchun Chenb,
Xin Liu*a and
Jiang Zheng*a
aMedical Research Center, The First Affiliated Hospital, Third Military Medical University, Chongqing 400038, China. E-mail: zhengj99219@163.com; triplestars@163.com
bDepartment of Medicinal Chemistry, College of Pharmacy, Third Military Medical University, Chongqing, 400038, China. E-mail: ycchenhuaxi@aliyun.com
First published on 5th September 2016
Abstract
Kukoamine B (KB) was found to inhibit the over-production of pro-inflammatory cytokines induced by immunostimulatory CpG DNA, thus being considered as a valuable candidate for the development of anti-sepsis drugs. With the goal of elucidating the mechanism of inhibition of CpG DNA by KB, dual polarization interferometry and isothermal titration calorimetry were used to measure the kinetic and thermodynamic parameters of KB–CpG DNA interaction, and molecular docking was employed to predict the binding mode. The significant binding of KB to CpG DNA led to a conformational change of the CpG DNA layer on the biosensor chip surface and produced a dissociation equilibrium constant (KD) of 4.82 × 10⁻⁷ M. The thermodynamic profile elucidated two-site binding, a strong binding of the first site and weaker binding of the second one, which was driven by enthalpy and entropy. Further, docking results suggested that KB formed a close contact with the core sequence of CpG DNA. Taken together with these results, we gained insight into the inhibition mechanism of KB against CpG DNA through direct binding measurement and in silico simulation. KB could bind the primary structure of CpG DNA, thereby interfering with the interaction of CpG DNA with Toll-like receptor 9 (TLR9) and the immunestimulatory effect.
Introduction
Sepsis is a life-threatening complication of infection. It arises from the host response to infection and leads to tissue damage and organ dysfunction.1 As one of the oldest syndromes, sepsis is currently estimated to affect 19 million or even more people worldwide each year.2 Numerous therapeutic strategies have emerged during the past few decades, but it is depressing that there is no ideal and specific anti-sepsis therapies in clinical practice.3As we know, bacteria are the most common cause of sepsis, but the pathogenesis of sepsis is driven by the host response, not the invading pathogenic microorganisms.4 Many bacterial components termed as pathogen-associated molecular patterns (PAMP) can initiate the systemic inflammatory response. The most commonly known PAMP is lipopolysaccharide (LPS) produced by Gram-negative bacteria. It is now well known that bacterial CpG DNA, another PAMP from both Gram-positive and negative bacteria, plays an important role in triggering sepsis like LPS.5 The bacterial CpG DNA contains an abundance of unmethylated CpG motifs which are essential for the immune stimulatory capacity. It is recognized by Toll-like receptor 9 (TLR9) and induces excessive production of pro-inflammatory cytokines.6 Moreover, it was found to act synergistically with LPS and increase the toxic effect of LPS.7 Due to its stimulation of immune cells, some researches have been carried out to evaluate the bacterial CpG DNA as a biomarker for diagnosis of sepsis.8 More importantly, previous studies have shown that the inhibition of bacterial CpG DNA-induced inflammatory response is advantageous to the treatment of sepsis.9,10 Therefore, it is worth investigating the therapies targeting bacterial CpG DNA for the management of sepsis.
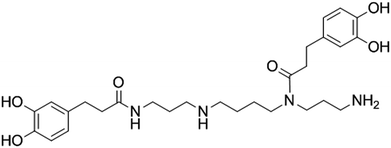
Kukoamine B (KB, Fig. 1) is a natural spermine alkaloid from the root bark of Lycium chinense. It was found to exhibit anti-inflammatory and neuroprotective activities.11–13 Notably, our studies disclosed that KB is able to bind CpG DNA and block its interaction with macrophages, thus resulting in the inhibition of immunostimulatory CpG DNA in vitro and in vivo.14 These results promoted us to explore the mechanism responsible for the inhibitory activity of KB against CpG DNA since the single-stranded stimulatory CpG DNA is the structural basis of bacterial CpG DNA recognition by TLR9 and has been widely used to mimic the activity of bacterial CpG DNA.15–18 Herein we measured the kinetic and thermodynamic properties of KB binding with CpG DNA using dual polarization interferometry (DPI) and isothermal titration calorimetry (ITC). Further, we performed molecular docking to reveal the binding mode of KB–CpG DNA interaction. These findings would be a step toward the structure modification of KB and new anti-sepsis drug development.
Results and discussion
Binding kinetics of KB to CpG DNA
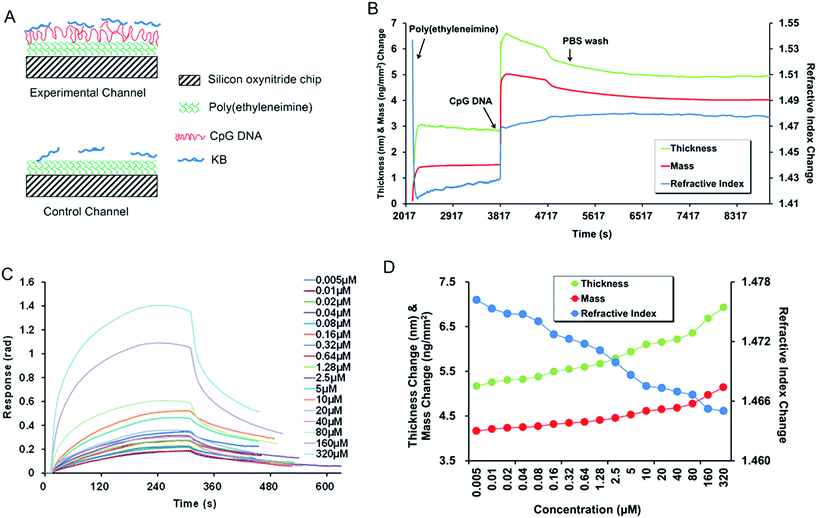
The immobilization profile of CpG DNA on the surface of a poly(ethyleneimine) functionalised chip was observed by DPI (shown in Fig. 2B). CpG DNA was electrostatically deposited onto the chip via poly(ethyleneimine) linker. The initial deposition of CpG DNA was extremely fast. The layer thickness was elevated sharply to 6.6 nm during the first two minutes and decreased to 6 nm at the end of the injection of CpG DNA. The final thickness of CpG DNA layer stayed at 5 nm after a consecutive wash of working fluid. The same profile of change in mass was shown as that of thickness, whereas the refractive index (correlates to density) increased steadily from 1.428 to 1.478 suggesting the decrease in the dimension of CpG DNA layer during the immobilization process. Since CpG DNA formed a stable layer, the conformational changes can be seen upon the binding with increasing concentrations of KB (Fig. 2C). Further, the changes in thickness, mass and refractive index upon the binding of KB were recorded accordingly. As shown in Fig. 2D, the concentration-dependent increases in thickness from 5 to 6.9 nm and mass from 4.1 to 5.1 ng mm−2 and decrease in refractive index from 1.478 to 1.465, which reflected the increase in the dimension of CpG DNA layer during the binding process, indicated the electrostatic interaction between CpG DNA and KB. This result correlated well with the studies of interfacial structure and composition of single-stranded oligonucleotides in DPI determination.19,20 The binding and disassociation curves of different concentrations of KB (0.005 to 320 μM) bound to CpG DNA were recorded individually to generate affinity constant. The calculated dissociation equilibrium constant (KD) was 4.82 × 10⁻⁷ M, association rate constant (kass) was 8.05 × 10³ M−1 s−1, and dissociation rate constant (kdiss) was 3.88 × 10⁻³ s−1. These data produced from DPI are in magnitude the same as that from resonance mirror biosensor.14 Additionally, KB only induced a very weak response which was due to the nonspecific interaction in the control poly(ethyleneimine) layer. The thickness of poly(ethyleneimine) layer increased by only 0.066 nm, and mass and refractive index decreased by 0.18 ng mm−2 and 0.0067, respectively, thus indicating that the dimension changes of poly(ethyleneimine) layer were relatively small and excluding the possibility of nonspecific binding of KB to the surface.Further, a control experiment involving an irrelevant CpG DNA (5′-GGGGGACGATCGTCGGGGGG-3′) was also carried out with DPI. The responses upon binding of KB (0.005 to 20 μM) were recorded (Fig. 3). The highest concentration of KB is 20 μM because the CpG DNA layer has been saturated by KB binding at this concentration. It was found that the thickness of control CpG DNA layer increased from 5.7 to 6.5 nm, mass increased from 4.4 to 4.8 ng mm−2, and refractive index decreased from 1.470 to 1.465. The binding affinity (KD) reduced about fourteen times to 7.04 × 10⁻⁶ M.
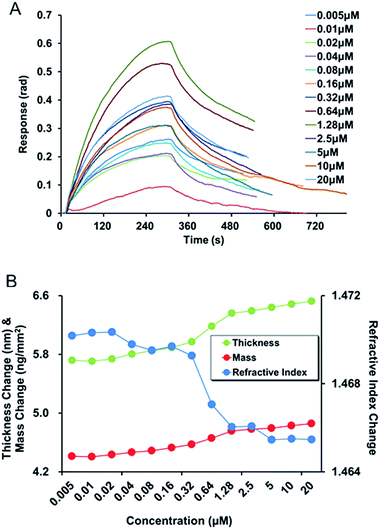 | ||
| Fig. 3 Affinity of KB for control CpG DNA. (A) Binding and disassociation curves of KB binding to control CpG DNA; (B) the conformational changes of control CpG DNA layer upon the binding of KB. | ||
Unlike the large decrease in thickness with increase in refractive index which is due to the intercalation of small molecules such as ethidium bromide into the double-stranded DNA via hydrophobic interaction, the conformational changes of KB observed in DPI implied that the electrostatic interaction primarily contributed to the interaction of KB with CpG DNA.19,21,22 This is an expectable result for the interaction of amine group with negative charges on phosphate group when considering that KB has a positively charged spermine backbone. This result favours the theoretical study of interaction between spermine and DNA, and we can further conclude that the primary amines as well as the secondary amines of KB form the hydrogen bonds with the sugar-phosphate backbone of CpG DNA.23
Binding thermodynamics of KB to CpG DNA
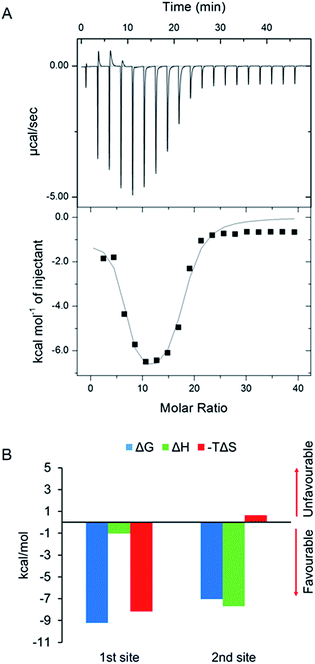
While DPI illuminated the conformational change during the binding process, ITC provided a deeper insight into the nature of interaction. Two molecules with the same affinity constant may have different thermodynamic signatures and this reflects different interactions, so it is of great significance to get better understanding of binding behaviour through the thermodynamic profile. The thermodynamic parameters of KB–CpG DNA interaction were presented in Table 1. The raw data of heat peaks and optimally fitted binding isotherms depicted a biphasic binding mode that comprised two phases, a rapid initial phase and a relatively slower second phase. The top panel of Fig. 4A showed the raw data of exothermic peaks and the bottom panel showed the binding isotherm by plotting the integrated curve of heat peaks against the molar ratio of KB. It can be seen that the first three titrations bound primarily to one site and the subsequent six titrations primarily the other site, whilst the last nine titrations had very weak binding as the binding site has been saturated. As for the first binding site, the KB–CpG DNA interaction produced a KA1 of 5.68 × 10⁶ M−1 (the reciprocal term KD1 = 1.76 × 10⁻⁷ M) with favourable (negative) binding enthalpy (ΔH1 = −1.043 kcal mol−1) and entropy (−TΔS1 = −8.169 kcal mol−1). From the thermodynamic factors, the binding was supposed to be based on hydrophobic effect, and relatively, the hydrogen bonding interaction did not contribute significantly to the binding affinity. The second interaction with lower KA2 of 1.48 × 10⁵ M−1 (KD2 = 6.75 × 10⁻⁶ M) had a favourable enthalpic effect (ΔH2 = −7.71 kcal mol−1) while also resulting in an unfavourable entropic contribution (−TΔS2 = 0.659 kcal mol−1) to binding, indicating that the binding was dominated by hydrogen bonding interaction with a conformational change that resulted in a reduced affinity, namely the enthalpy gain improved by hydrogen bond was markedly compensated by the entropy loss resulted from the loss of conformational degrees of freedom (Fig. 4B). Comparing with DPI, ITC not only can get the binding affinity but also more details about the binding behaviors. It was clear that the interaction between KB and CpG DNA had two non-identical binding phases which had two different KD values. DPI could not clearly distinguish the two phases, so it got an integrated KD value which is less than that of the first phase and greater than that of the second phase of ITC.| Site | n | KA (M−1) | ΔH (kcal mol−1) | ΔS (cal mol−1 deg−1) |
|---|---|---|---|---|
| I | 5.87 ± 0.585 | 5.68 ± 7.98 × 10⁶ | −1.043 ± 0.95 | 27.4 |
| II | 11.3 ± 1.02 | 1.48 ± 0.752 × 10⁵ | −7.71 ± 0.999 | −2.21 |
ITC uncovered more details that there were two independent binding sites involving two different thermodynamic profiles. The fact that KA1 was larger than KA2 reflected a negative cooperativity between the two binding events. The first interaction was driven by entropy as it had a favourable ΔH and ΔS, and ΔS were much larger than ΔH. The entropically favoured binding was primarily due to the hydrophobic interaction. In the meanwhile, the second interaction driven by enthalpy exhibits a favourable ΔH, indicating the formation of hydrogen bond, and unfavourable ΔS that involved conformational change. Generally this binding profile referred to high polarity as well as flexibility of the chemical structure of small molecules. The hydrogen bond significantly improved the ΔH value but it did not lead to the increase in affinity because of the unexpected compensating entropic effects. This result emphasizes the fact that incorporation of interplay between enthalpy and entropy should be taken into consideration in the structure optimization of KB since the affinity requires both favourable enthalpy and entropy changes.
Docking simulation of KB with CpG DNA
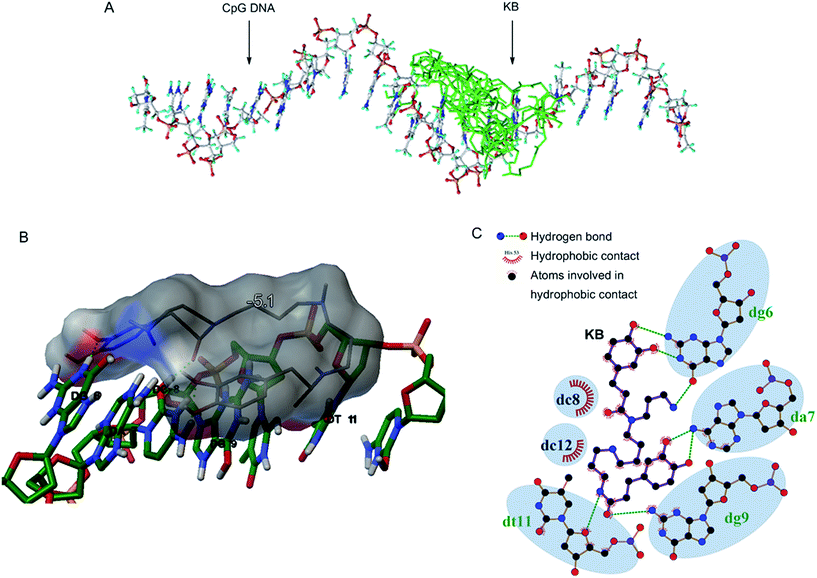
The superposition of all docked poses of KB in the binding site of CpG DNA was presented in Fig. 5A. Each docking mode was evaluated and it was found that KB could bind the primary structure of CpG DNA (Table 2). The representative pose of KB with the lowest binding free energy (−5.1 kcal mol−1) was displayed in Fig. 5B and the according two-dimensional interaction diagram was shown in Fig. 5C. As can be seen from the predicted binding conformations of preferred orientation (Fig. 5B), KB was in close contact, including hydrogen bonding interaction, with Base 6 to 11 (GACGTT) of CpG DNA. The interactions between atoms involved in the close contact as well as hydrogen bond were shown as wireframe sphere. In the planar view, the bases of CpG DNA that interacted with KB were labelled and made prominent by transparent blue colour. It was clearly identifiable that the hydrogen bonding interactions, shown as green dotted lines in Fig. 5C, were formed between KB and Base 6 (G), 7 (A), 9 (G) and 11 (T). Furthermore, KB interacted with Base 8 (C) and 12 (C) via hydrophobic contacts. These findings support the proposal that the binding of KB to the core sequence of CpG DNA is responsible for the anti-inflammatory activity of KB. The docking simulation supported the result of ITC. The binding of KB to CpG DNA was driven by entropy which is due to the hydrophobic interaction and by enthalpy which is due to the hydrogen bonding interaction, respectively. Taking these results together we suppose that the hydrophobic interaction between CpG DNA and benzene of KB is responsible for the first binding, and the hydrogen bond between CpG DNA and the hydroxy and primary amine groups of KB for the second one. This result also correlated well with the findings from DPI that KB could bind the core sequence of CpG DNA, as the irrelevant CpG DNA of which the core sequence was replaced had a much lower affinity for KB.| Mode | Binding free energy (kcal mol−1) | Interaction with bases |
|---|---|---|
| 1 | −5.1 | Base 6, 7, 8, 9, 11, 12 |
| 2 | −4.5 | Base 4, 6, 7, 8, 9, 10, 11 |
| 3 | −4.5 | Base 8, 9, 10, 11, 12 |
| 4 | −4.4 | Base 6, 7, 8, 9, 10, 11 |
| 5 | −4.4 | Base 4, 5, 6, 7, 8, 9 |
| 6 | −4.4 | Base 6, 7, 8, 9, 10, 11 |
| 7 | −4.4 | Base 6, 7, 8, 9, 10, 11, 12 |
| 8 | −4.3 | Base 5, 6, 7, 8, 9 |
| 9 | −4.3 | Base 6, 7, 8, 9, 10 |
According to Pan et al.'s study, the nitrogenous groups of Base 5, 6 and 8 in CPG DNA directly interacted with Arg 337 and Lys 338 in TLR9 via hydrogen bond, and in a larger contact area, Base 3 to 12 were found to be in close contact with Glu 287, Arg 311, Val 312, Ser 316, Thr 334, Leu 336, Arg 337, Asn 340, Lys 367, Arg 397, and Trp 447.24 When the conformations of KB and CpG DNA as well as TLR9 were merged together, it can be seen that the site of CpG DNA for TLR9 recognition and KB binding was located in the same domain (Fig. 6A), thus suggesting that the interaction between CpG DNA and TLR9 could be interfered upon the binding of KB to CpG DNA.
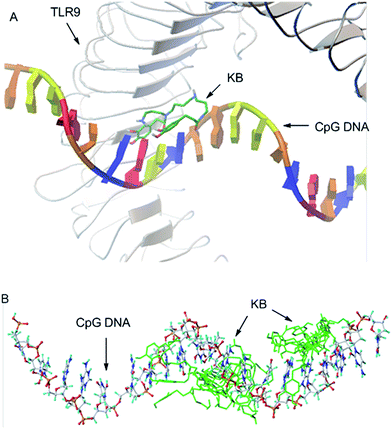 | ||
| Fig. 6 The merged conformations of KB, CpG DNA and TLR9 (A) and predicted poses of KB bound to the entire CpG DNA (B). | ||
We have also performed a docking simulation involving a large search space of 48 × 36 × 52 angstrom (Å) that included the entire structure of CpG DNA and found that, within the ten docked conformations, six turned out that KB could get close contact with the core sequence (Fig. 6B), particularly Base 9 to 11, of CpG DNA and produced similar poses to those of docking with smaller search space (18 × 20 × 30 Å) under the same docking protocol. This confirmed that the sequence of GACGTT is the predominant binding site for KB. Taken together with the previous data that GACGTT is the optimal CpG motif for the initiation of TLR9 signalling, the virtual docking results not only are in agreement with the binding test, but also confirm our hypothesis that KB could occupy the core sequence, Base 6 to 11 (GACGTT), which is responsible for TLR9 recognition and immunostimulation of CpG DNA.25
It is known that the structure optimization focusing on binding affinity may, sometimes, not lead to a successful drug due to the unfavourable thermodynamic signatures of different compounds with identical affinities, the thermodynamic information, therefore, becomes more important in drug design. Our findings here provided a useful hint that to overcome the enthalpy–entropy compensation by optimal placement of hydrogen bond donors and non-polar groups on KB as a function of the binding mode of KB is a promising way for optimization and is worth of further investigation.
Experimental
Materials and methods
KB was prepared according to our previously reported method, and its structure was confirmed by ESI-MS analysis (Fig. S1†) and exceeded 98% purity.10 The CpG DNA (5′-TCCATGACGTTCCTGACGTT-3′) and control CpG DNA (5′-GGGGGACGATCGTCGGGGGG-3′) were synthesized by Sangon Biotech Co., Ltd. (Shanghai, China). Poly(ethyleneimine) was purchased from Sigma-Aldrich Shanghai Trading Co., Ltd. (Shanghai, China). Phosphate buffer solution (PBS) was obtained from Boster Bioengineering Co., Ltd. (Wuhan, China). Pure water was produced by Milli-Q Advantage A10 Water Purification System (EMD Millipore Corporation, Massachusetts, USA).Dual polarization interferometry (DPI)
Real-time analysis of binding kinetics was performed using AnaLight Bio200 DPI biosensor equipped with a laser of wavelength 632.8 nm (Farfield Group Ltd., Crewe, UK). The method was slightly modified from the previous one.19,20 The internal temperature was maintained at 20 °C. A silicon oxynitride chip with hydrophilic and negatively charged surface (Farfield Group, UK) was mounted in DPI system and perfused by PBS running buffer at 50 μL min−1. Following the check of the refractive index of PBS and thickness of chip base by use of 80% ethanol and pure water, poly(ethyleneimine) solution (0.01 mg mL−1 in PBS) was injected over the chip surface at 100 μL min−1 until the response reached a steady state. The flow rate was then reduced to 5 μL min−1 and maintained for 10 minutes to generate a poly(ethyleneimine) layer. Once the response stabilized, CpG DNA solution (2 mg mL−1 in PBS) was injected over the poly(ethyleneimine) surface at 100 μL min−1. When the response approached a plateau, the flow rate was reduced to 5 μL min−1 and maintained for 10 minutes until a steady response was attained. The CpG DNA layer was perfused by PBS at 50 μL min−1 and then challenged with increasing concentrations of KB (two-fold serial dilutions ranging from 0.005 to 320 μM) at the same flow rate. The total volume of injection of KB was 250 μL. As a control to exclude the possibility of nonspecific binding of KB to the surface, KB was also directly injected over the poly(ethyleneimine) surface without the deposition of CpG DNA. A refractive index increment of 0.175 cm3 g−1 was used for the calculation of the dimensions of CpG DNA according to the previous study.26Isothermal titration calorimetry (ITC)
The microcalorimetry experiment was carried out on MicroCal Auto-iTC200 (GE Healthcare, Pittsburgh, USA). CpG DNA was dissolved at a concentration of 0.02 mM in PBS and loaded into the sample cell at a temperature of 25 °C (T = 298.15 K). KB was prepared at a concentration of 4 mM in the same buffer and filled into the syringe. The titration of PBS with KB was firstly carried out as a control to confirm that there was no reaction between the buffer and KB. Nineteen titrations of CpG DNA with KB were performed by injecting 0.5 μL of KB for the first titration and 2 μL for the following titrations at an interval of 150 seconds. Other experimental parameters were set as default. The released heat was measured by ITC and presented as the exothermic peaks plotted versus the time course. Data analysis was performed with Origin 7.0 using two sets of sites binding model to extract the calorimetric data including the binding stoichiometry (n), association equilibrium constant (KA) and changes in enthalpy (ΔH) and entropy (ΔS) as well as Gibbs free energy (ΔG = ΔH − TΔS).Molecular docking
The three-dimensional structure of CpG DNA was retrieved from the homology model of TLR9 extracellular domain–CpG DNA complex, of which CpG DNA was generated in B-form using standard helix parameters.24 The chemical structure of KB was drawn and geometrically optimized with SYBYL-X 2.0. The energy minimization was performed using Powell algorithm and Tripos force field with Gasteiger–Huckel charges. Following the addition of polar hydrogens and merging of non-polar hydrogens as well as count of torsions, the PDBQT molecular structure files of CpG DNA and KB were prepared, respectively, with AutoDockTools 1.5.6.27 A grid map that included the core sequence, Base 5 to 11 (TGACGTT), of CpG DNA with a size of 18 × 20 × 30 Å and a centre of 67.3 × 74.2 × 92.5 points was created with AutoDockTools. Finally, AutoDock Vina was used to perform the docking simulation.28 The docked conformations of KB were ranked by the predicted binding free energy (affinity) values given in kcal mol−1 and the molecular interactions between KB and CpG DNA were shown using AutoDockTools. The two-dimensional interaction diagram of KB bound to CpG DNA was analysed and shown by LigPlot+.29Conclusions
In summary, we got an insight into the chemical mechanism for the inhibitory effect of KB on CpG DNA using molecular binding and docking methods. Combined with our previous in vitro and in vivo results,14 it is proposed that KB binds the core sequence of CpG DNA, thereby blocking the CpG DNA–TLR9 interaction and inhibiting the inflammatory response. The current studies strengthen the confidence that KB could be used as a hopeful lead compound for anti-sepsis drug development.Acknowledgements
This work was supported by National Scientific and Technology Major Project for New Drugs Innovation from Ministry of Science and Technology of China (2014ZX09102001-011), Chongqing Graduate Student Research Innovation Project from the Chongqing Education Committee (CYB14093), and Clinical Research Innovation Fund from The First Affiliated Hospital, Third Military Medical University, China (SWH2013QN06).Notes and references
- D. Annane, E. Bellissant and J. M. Cavaillon, Lancet, 2005, 365, 63–78 CrossRef CAS.
- D. C. Angus and T. van der Poll, N. Engl. J. Med., 2013, 369, 840–851 CrossRef CAS PubMed.
- J. L. Vincent, J. P. Mira and M. Antonelli, Lancet Respir. Med., 2016, 4, 237–240 CrossRef PubMed.
- F. B. Cerra, Crit. Care Clin., 1985, 1, 591–607 CAS.
- T. Sparwasser, T. Miethke, G. Lipford, K. Borschert, H. Hacker, K. Heeg and H. Wagner, Nature, 1997, 386, 336–337 CrossRef CAS PubMed.
- G. Hacker, V. Redecke and H. Hacker, Immunology, 2002, 105, 245–251 CrossRef CAS PubMed.
- J. S. Cowdery, J. H. Chace, A. K. Yi and A. M. Krieg, J. Immunol., 1996, 156, 4570–4575 CAS.
- O. Rasid and J. M. Cavaillon, Future Microbiol., 2016, 11, 293–314 CAS.
- L. Wang, W. Jiang, G. Ding, H. Cao, Y. Lu, P. Luo, H. Zhou and J. Zheng, Int. Immunopharmacol., 2007, 7, 646–655 CrossRef CAS PubMed.
- X. Liu, X. C. Zheng, Y. P. Long, H. W. Cao, N. Wang, Y. L. Lu, K. C. Zhao, H. Zhou and J. A. Zheng, Int. Immunopharmacol., 2011, 11, 110–120 CrossRef CAS PubMed.
- W. T. Qin, X. Wang, W. C. Shen and B. W. Sun, Exp. Ther. Med., 2015, 9, 725–732 CAS.
- X. L. Hu, L. P. Guo, Q. Song, Q. Zhang, Y. Chen, J. Wang, W. H. Meng and Q. C. Zhao, Neurochem. Int., 2015, 87, 66–76 CrossRef CAS PubMed.
- X. L. Hu, Y. X. Niu, Q. Zhang, X. Tian, L. Y. Gao, L. P. Guo, W. H. Meng and Q. C. Zhao, Environ. Toxicol. Pharmacol., 2015, 40, 230–240 CrossRef CAS PubMed.
- X. Liu, X. C. Zheng, N. Wang, H. W. Cao, Y. L. Lu, Y. P. Long, K. C. Zhao, H. Zhou and J. A. Zheng, Br. J. Pharmacol., 2011, 162, 1274–1290 CrossRef CAS PubMed.
- Z. K. Ballas, W. L. Rasmussen and A. M. Krieg, J. Immunol., 1996, 157, 1840–1845 CAS.
- T. Sparwasser, E. S. Koch, R. M. Vabulas, K. Heeg, G. B. Lipford, J. W. Ellwart and H. Wagner, Eur. J. Immunol., 1998, 28, 2045–2054 CrossRef CAS PubMed.
- T. Sparwasser, T. Miethke, G. Lipford, A. Erdmann, H. Hacker, K. Heeg and H. Wagner, Eur. J. Immunol., 1997, 27, 1671–1679 CrossRef CAS PubMed.
- D. Broide, J. Schwarze, H. Tighe, T. Gifford, M. D. Nguyen, S. Malek, J. Van Uden, E. Martin-Orozco, E. W. Gelfand and E. Raz, J. Immunol., 1998, 161, 7054–7062 CAS.
- J. Wang, X. W. Xu, Z. X. Zhang, F. Yang and X. R. Yang, Anal. Chem., 2009, 81, 4914–4921 CrossRef CAS PubMed.
- X. B. Zhao, F. Pan, P. Coffey and J. R. Lu, Langmuir, 2008, 24, 13556–13564 CrossRef CAS PubMed.
- L. H. Pope, M. C. Davies, C. A. Laughton, C. J. Roberts, S. J. Tendler and P. M. Williams, J. Microsc., 2000, 199, 68–78 CrossRef CAS PubMed.
- L. Strekowski and B. Wilson, Mutat. Res., 2007, 623, 3–13 CrossRef CAS PubMed.
- B. G. Feuerstein, N. Pattabiraman and L. J. Marton, Proc. Natl. Acad. Sci. U. S. A., 1986, 83, 5948–5952 CrossRef CAS.
- X. C. Pan, J. J. Yue, G. F. Ding, B. Li, X. Liu, X. C. Zheng, M. C. Yu, J. Li, W. W. Jiang, C. Wu, J. Zheng and H. Zhou, J. Biol. Chem., 2012, 287, 30596–30609 CrossRef CAS PubMed.
- S. Bauer, C. J. Kirschning, H. Hacker, V. Redecke, S. Hausmann, S. Akira, H. Wagner and G. B. Lipford, Proc. Natl. Acad. Sci. U. S. A., 2001, 98, 9237–9242 CrossRef CAS PubMed.
- L. Lee, A. P. Johnston and F. Caruso, Biomacromolecules, 2008, 9, 3070–3078 CrossRef CAS PubMed.
- M. F. Sanner, J. Mol. Graphics Modell., 1999, 17, 57–61 CAS.
- O. Trott and A. J. Olson, J. Comput. Chem., 2010, 31, 455–461 CAS.
- R. A. Laskowski and M. B. Swindells, J. Chem. Inf. Model., 2011, 51, 2778–2786 CrossRef CAS PubMed.
Footnote |
| † Electronic supplementary information (ESI) available: ESI-MS spectrum of KB. See DOI: 10.1039/c6ra11646a |
| This journal is © The Royal Society of Chemistry 2016 |

