
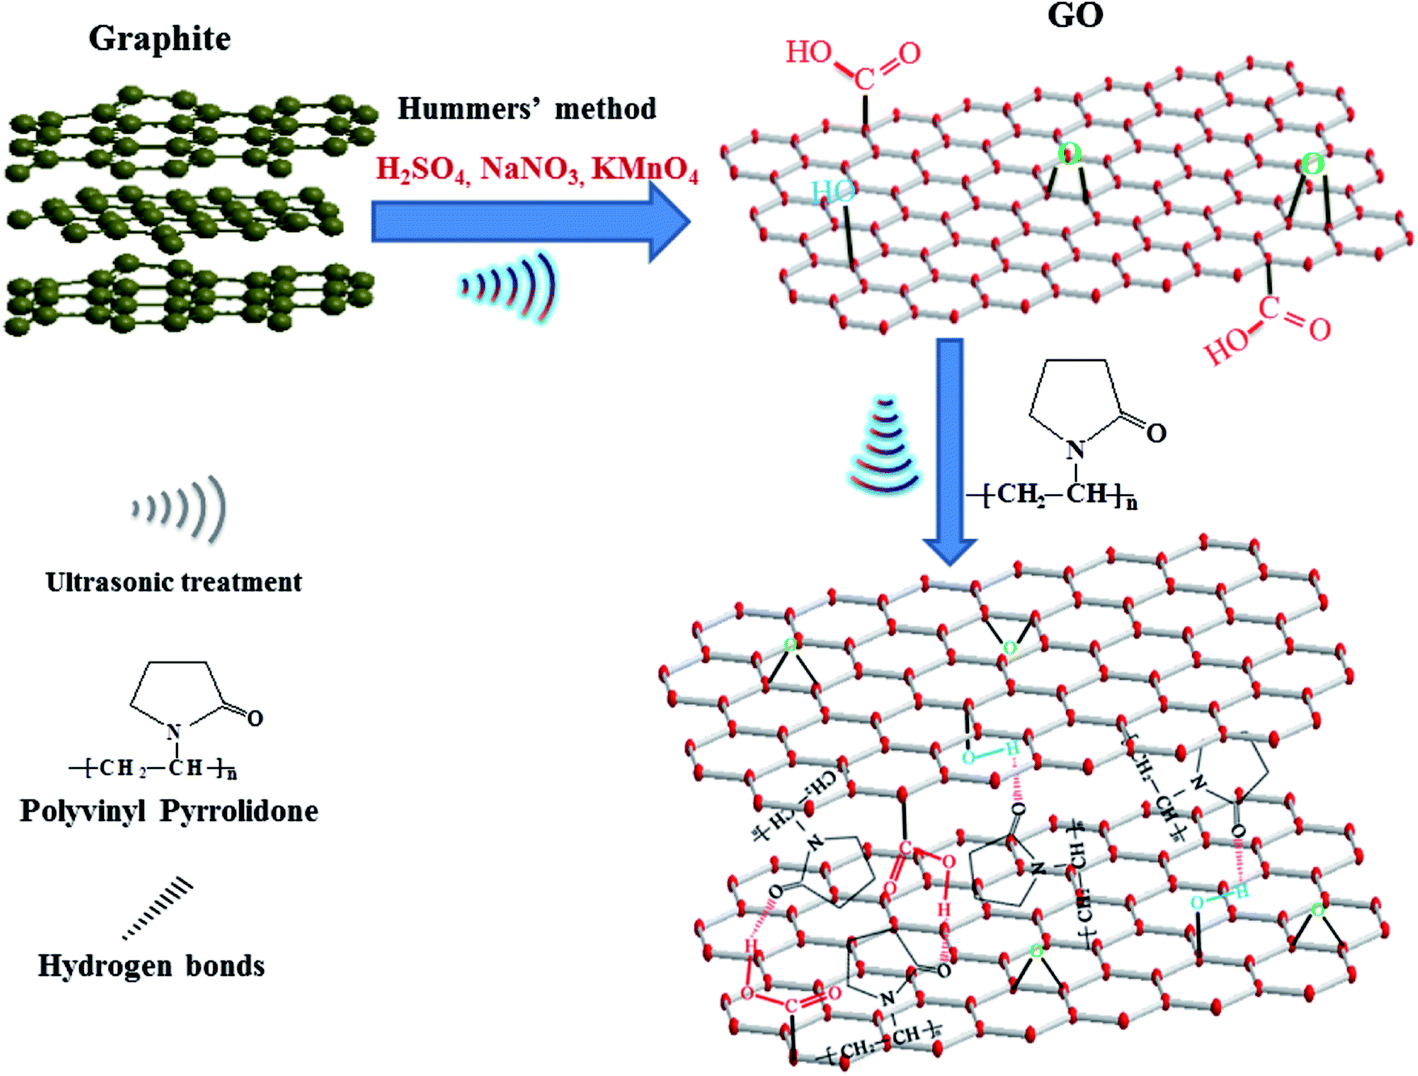
Polyvinyl pyrrolidone modified graphene oxide for improving the mechanical, thermal conductivity and solvent resistance properties of natural rubber
Xumin Zhanga,
Jingyi Wangbc,
Hongbing Jia*a,
Biao Yina,
Lifeng Dingd,
Zhaodong Xue and
Qingmin Jif
aKey Laboratory for Soft Chemistry and Functional Materials of Ministry of Education, Nanjing University of Science and Technology, Nanjing 210094, China. E-mail: polymernjust@gmail.com; Tel: +86 25 84303329
bJiangsu Key Laboratory of Advanced Structural Materials and Application Technology, Nanjing Institute of Technology, Nanjing 211167, China
cCollege of Material Engineering, Nanjing Institute of Technology, Nanjing 211167, China
dDepartment of Chemistry, Xi'an Jiaotong-Liverpool University, Suzhou 215123, China
eKey Laboratory of C & PC Structures of Ministry of Education, Southeast University, Nanjing 210096, China
fHerbert Gleiter Institute of Nanoscience, Nanjing University of Science and Technology, Nanjing 210094, China
First published on 31st May 2016
Abstract
Polyvinyl pyrrolidone (PVP) was applied to modify graphene oxide (GO) to obtain PVP modified GO (PGO). The PGO/natural rubber (NR) nanocomposites were fabricated by mixing a PGO aqueous dispersion with NR latex, followed by coagulation and vulcanization. The structure of PGO was characterized using atomic force microscopy, solid state 13C NMR, Fourier transform infrared spectroscopy, Raman spectra and X-ray photoelectron spectroscopy. The interaction between GO and PVP molecules as well as the effects of PGO on the mechanical properties, thermal conductivity and solvent resistance properties of the NR matrix were thoroughly studied. The results revealed that PVP molecules might interact with GO via hydrogen bonds. With the addition of PGO, the tensile strength, tear strength and thermal conductivity as well as solvent resistance of the PGO/NR nanocomposites increased. The PGO/NR nanocomposite with 5 phr (parts per hundred rubber) PGO had an 81%, 159%, 30% increase in tensile strength, tear strength, thermal conductivity and a 46% decrease in solvent uptake, respectively, compared with pristine NR.
1 Introduction
Natural rubber latex (NR), a renewable polymeric material obtained from the bark of the rubber tree, contains the milky colloidal material cis-1,4-polyisoprene. It exhibits remarkable properties, such as high elasticity, good film-forming ability and high resilience, which enables it to have wide applications in the automotive, laboratory, and medical industries.1 In most applications of NR, fillers are added to get substantial improvements in strength and stiffness. Recently, nano-fillers have been extensively studied to prepare rubber nanocomposites due to their superior performance.2 Among these different nano-fillers, graphene oxide (GO) has recently attracted a significant attention as a promising candidate for rubber reinforcement owing to its excellent thermal, mechanical, barrier properties as well as its large specific surface, cost-effective and easy processing properties.3–7 Because of the polar groups (hydroxyl, epoxy groups and carboxyl groups) on the surface, GO exists great reinforcement to polar rubber. For example, Wang et al. reported that 3 phr (parts per hundred rubber) GO could largely improve the tensile strength and thermal conductivity of carboxylated acrylonitrile butadiene rubber (XNBR) by more than 370% and 40%, respectively.4However, the dispersion of GO in NR matrix is more difficult due to the weaker interfacial interaction between polar GO and non-polar NR,3 causing poor reinforcement to NR. For instance, Zhao et al. found that the tensile strength of GO/NR increased monotonically with increasing GO loading up to 0.5 phr GO and then showed a decrease, and the maximum tensile strength had only a 40% increment compared with that of pristine NR.8 Xing et al. prepared graphene/NR nanocomposites by a modified latex mixing method combined with in situ chemical reduction of GO, and they found that a low content of graphene (only 0.5 phr) could increase the tensile strength of NR, and the maximum tensile strength had only a 48% increment compared with that of pristine NR.9 Dong et al. reported that fatigue resistance of NR could be reversely proportional to the GO content as well.10 In spite of the progress mentioned above, the successful incorporation of well-dispersed GO into NR as well as the improvement of interfacial interaction between GO and NR are still yet to be addressed.
Polyvinyl pyrrolidone (PVP) is an amphiphilic polymer with hydrophilic and lipophilic groups on the backbone, which has been reported to be able to disperse the single layer graphene in solvents and in water successfully.11–13 In our previous report, we prepared reduced GO (RGO) stable dispersion through chemical reduction of GO in the presence of PVP, and fabricated PRGO/NR nanocomposites through latex compounding. The PRGO was remarkably effective in improving the thermal conductivity and solvent resistant of NR. Nevertheless, the tensile strength of NR nanocomposite had only 23% increment compared with pristine NR, and decreased when PRGO surpassed 3 phr. However, to the best of our knowledge, it has not been reported yet in the literature the fabrication of PVP-modified GO/NR rubber nanocomposites through latex compounding.
In this article, we report a novel, facile and low-cost approach to modify GO with PVP, by taking advantage of the hydrogen bonds between GO and PVP.14 The PVP modified GO (PGO) was incorporated into NR latex by a latex hetero-coagulation method. The mechanical properties, dynamic mechanical properties, thermal conductivity as well as solvent resistance properties of the PGO/NR nanocomposites were studied. All results are discussed in the following sections.
2 Experimental
2.1 Materials
NR latex (solid content is 60 wt%) was obtained from Shanghai Nessen International Trading Co. Ltd., China. PVP (K30,![[M with combining macron]](https://www.rsc.org/images/entities/i_char_004d_0304.gif) n = 40
n = 40![[thin space (1/6-em)]](https://www.rsc.org/images/entities/char_2009.gif) 000), natural graphite powder (particle size ≤ 30 μm, purity ≥ 99.85%), sulfuric acid (H2SO4, 98%), sodium nitrate (NaNO3), potassium permanganate (KMnO4), hydrogen peroxide (H2O2, 30%), hydrochloric acid (HCl, 37%), and sodium chloride (NaCl) with analytical grade were purchased from Sinopharm Chemical Reagent Co. Ltd., China. Curing agents including sulfur, zinc oxide (ZnO), stearic acid (SA), 2,2′-dithio-dibenzothiazole (DM) and antioxidant poly(1,2-dihydro-2,2,4-trimethyl-quinoline) (RD) with industry grade were kindly provided by Nanjing Jinsanli Rubber Plastic Co. Ltd., China.
000), natural graphite powder (particle size ≤ 30 μm, purity ≥ 99.85%), sulfuric acid (H2SO4, 98%), sodium nitrate (NaNO3), potassium permanganate (KMnO4), hydrogen peroxide (H2O2, 30%), hydrochloric acid (HCl, 37%), and sodium chloride (NaCl) with analytical grade were purchased from Sinopharm Chemical Reagent Co. Ltd., China. Curing agents including sulfur, zinc oxide (ZnO), stearic acid (SA), 2,2′-dithio-dibenzothiazole (DM) and antioxidant poly(1,2-dihydro-2,2,4-trimethyl-quinoline) (RD) with industry grade were kindly provided by Nanjing Jinsanli Rubber Plastic Co. Ltd., China.
2.2 Preparation of PGO
GO aqueous suspension with a concentration of 1 mg mL−1 was prepared through 1 h ultrasonic treatment of graphite oxide according to Hummers' method.15 Then, PVP with a ratio of 3:1 to GO was added to the GO suspension. The PGO aqueous suspension was finally obtained after 2 h ultrasonic treatment. To facilitate the following characterization and tests, the PGO solid was separated from suspension through centrifugation at 10000 rpm for 30 min, followed by several times deionized water washing. After that, the PGO powder was obtained by drying in a vacuum oven at 60 °C.
2.3 Preparation of PGO/NR nanocomposites
Different amount of PGO aqueous dispersion was added into NR latex under vigorous stirring for 15 min, followed by coagulation with formic acid solution. The resulting solids were filtrated and washed repeatedly with deionized water and then dried in a vacuum oven. Afterwards, the addition of the curing agents was carried out in an LN-120 open two-roll mill (LINA machinery Industrial Co. Ltd., China) at room temperature. The formulation of the composite was given as follows: NR 100 phr, sulfur 2.5 phr, ZnO 5 phr, SA 2 phr, DM 1 phr, RD 2 phr, PGO, variable. A series of PGO/NR nanocomposites containing 0, 1, 2, 3, 4 and 5 phr PGO were prepared by compression molding at 143 °C and 15 MPa for the optimal curing time with mold dimension of 150 mm × 100 mm × 1 mm. For comparison, GO/NR nanocomposites were also prepared by the identical procedure. These nanocomposites were abbreviated as “PGOx” or “GOx” below. The x denoted original GO loading (phr) in the nanocomposites.2.4 Characterization
Atomic force microscope (AFM) images were taken by a Nanoscope III D Multimode scanning probe microscope (Bruker Corporation, Switzerland) in a tapping mode. The PGO/or GO dispersion was spin-coated onto a freshly exfoliated mica substrate at 2000 rpm and dried at room temperature.The differential scanning calorimetry (DSC) analyses of the compounds were conducted in a 200F3 DSC (Netzsch Corporation, Germany) at a heating/cooling rate of 10 °C min−1 with a temperature range of 25 °C to 200 °C for two times. The glass transition temperature (Tg) was obtained from the heat flow of the second heating cycle.
Fourier transform infrared spectra (FTIR) were collected on a FTIR-8400S spectrometer (Shimadzu Corporation, Japan) in a transmission mode of KBr pellets with wavenumber range from 400 cm−1 to 4000 cm−1. Scan resolution is 4 cm−1.
Solid state nuclear magnetic resonance (NMR) spectroscopy was performed with a Bruker Avance III NMR spectrometer (Bruker Corporation, Switzerland) operating at 400 MHz and 100 MHz for 1H and 13C respectively. The magic angle spin (MAS) rate of the sample tube for the NMR measurement was 10 kHz. The spectra were recorded from a single pulse experiment using high power decoupling. The π/2 pulse width for 13C was 6 μs with a 3 μs width decoupling pulse for 1H. The number of scans for acquisition of spectra was 5000.
Raman spectra were recorded with an inVia-H31894 Raman spectrometer (Renishaw Corporation, Britain) by an argon-ion laser at an excitation wavelength of 514.5 nm.
X-ray photoelectron spectroscopy (XPS) measurements were carried out using a Phi Quantera II XPS (Ulvac-Phi Co. Ltd., Japan).
X-ray diffraction (XRD) pattern was performed using a D8-Advanced X-ray Diffractometer (Bruker Corporation, Switzerland) with Cu Kα radiation (λ = 0.154 nm) under a voltage of 40 kV and a current of 40 mA. The samples were scanned between the scattering angles (2θ) of 5° to 45° with a scanning rate of 3° min−1.
The morphologies of the freeze-fractured and the tear-fractured surfaces of the nanocomposites were observed by a JSM-6380LV scanning electron microscope (SEM) (JEOL Corporation, Japan).
The tensile and tear tests were measured on a universal testing machine (Shenzhen SANS Co. Ltd., China) at room temperature with a cross-head speed of 500 mm min−1 according to ASTM D-412 and ASTM D-624, respectively. The results were averaged based on five measurements.
The thermal conductivity of samples was calculated with the following eqn (1) according to ASTM E1461:
| λc = αcpρ | (1) |
The dynamic mechanical properties were measured with a Q800 dynamic mechanical analyzer (DMA) (TA Co. Ltd., USA) under a nitrogen atmosphere at a heating rate of 5 °C min−1 from −70 °C to 40 °C and a tensile mode at 1 Hz. The results were averaged based on three measurements.
The solvent resistance of the nanocomposites were tested in toluene at room temperature according to ISO 1817. The equilibrium solvent uptake (Qe) was calculated as following eqn (2):
 | (2) |
3 Results and discussion
3.1 Characterization of PGO
The morphology of GO and PGO have been analyzed by AFM, which are shown in Fig. 1. The GO sheet with the thickness of 1.27 nm is presented in Fig. 1(a). Compared to GO, PGO exhibits a higher characteristic thickness of about 3 nm (Fig. 1(b)). It is attributed to the adsorption of PVP molecules on the surface of GO. | ||
| Fig. 1 AFM images and the corresponding height profiles for (a) GO and (b) PGO. | ||
The change of Tg of PVP molecules on the surface of GO was used to investigate the PVP chain dynamics on the interface of PGO. The DSC curves of GO, PVP and PGO are shown in Fig. 2. It is found that the Tg of PGO is shifted to higher temperature of 66.8 °C compared to that of pure PVP, which indicates that the movement of PVP molecules is restrained due to the strong interaction between PVP chains and GO.
 | ||
| Fig. 2 DSC curves of GO, PVP and PGO. | ||
The FTIR spectra of GO, PVP and PGO are shown in Fig. 3. In the spectrum of GO, the broad peak at 3418 cm−1 results from the vibration of –OH, while sharp peaks at 1719, 1628, 1393, 1225 and 1055 cm−1 are attributed to the stretching vibration of C![[double bond, length as m-dash]](https://www.rsc.org/images/entities/char_e001.gif) O, stretching vibration of CC, O–H deformation vibration from C–OH, C–O stretching vibration from the C–OH, and stretching vibration of C–O–C, respectively.16 For PVP, a band at about 3545 cm−1 is assigned to the O–H stretching vibration, and two obvious peaks at 1670 and 1283 cm−1 are related to CO and C–N, respectively.17 In the spectrum of PGO, the adsorption peak for CO is red shifted to 1643 cm−1 and becomes narrower, which might be due to the hydrogen bond between CO of PVP and hydroxyl groups on the surface of GO (CO⋯H–O).14
O, stretching vibration of CC, O–H deformation vibration from C–OH, C–O stretching vibration from the C–OH, and stretching vibration of C–O–C, respectively.16 For PVP, a band at about 3545 cm−1 is assigned to the O–H stretching vibration, and two obvious peaks at 1670 and 1283 cm−1 are related to CO and C–N, respectively.17 In the spectrum of PGO, the adsorption peak for CO is red shifted to 1643 cm−1 and becomes narrower, which might be due to the hydrogen bond between CO of PVP and hydroxyl groups on the surface of GO (CO⋯H–O).14
 | ||
| Fig. 3 FTIR spectra of GO, PVP and PGO. | ||
Fig. 4 shows the 13C NMR spectra of GO, PVP and PGO. In the 13C NMR spectrum of GO, peaks at 131.9 ppm, 69.4 ppm and 59.3 ppm can be attributed to sp2 carbons, C*–OH and C*–O–C, respectively.18 As for PVP, four peaks appear at 173.7, 40.0, 29.4 and 16.4 ppm, corresponding to C*O, C*–N, C*–C(O) and C*–C, respectively.19 In the case of PGO, there are four sharp peaks at 174.3, 39.5, 28.5 and 15.1 ppm and an abroad peak at about 115.4 ppm. Compared with PVP, the peaks of C*–N, C*–C(O) and C*–C of PGO shift to high field by 0.5, 0.9 and 1.3 ppm, respectively, and peak at 115.4 ppm comes from the combination the peaks of GO. Generally speaking, interactions will lead to a lower-field shift of PVP carbon atoms in 13C spectrum due to the lower electron density.19 However, in the present work, the signals at 40.0, 29.4 and 16.4 ppm of pure PVP shift to 39.5, 28.5 and 15.1 ppm, respectively. It may be due to the shielding effect of magnetic field induced by π-electron circulation of GO.20 The result suggests that the PVP molecules might have been adsorbed on the basal plane of GO. The peak of C*O shifts to low field by 0.6 ppm, indicating that the PVP molecules have interaction with GO by hydrogen bonds, which agrees well with the FTIR result.
 | ||
| Fig. 4 13C NMR spectra of GO, PVP and PGO. | ||
The Raman spectra of GO and PGO are presented in Fig. 5. Raman spectrum of GO exhibits two prominent peaks at 1357 cm−1 and 1595 cm−1, respectively. The peak at 1357 cm−1 corresponds to the D-band (the vibration of sp3 hybridized carbon and defects on the edges of GO), while the peak at 1595 cm−1 is assigned as the G-band (the vibration of sp2 hybridized carbon in the graphite lattice).3 As for PGO, the D-band shifts from 1357 cm−1 to 1348 cm−1, while the G-band has almost no shift. It also supports the result of the hydrogen bonds between PVP and GO, which is consistent with FTIR and NMR results. The intensity ratio of D-band and G-band (ID/IG) increases from 1.92 to 2.27 (Fig. 5), which indicates more disordered structures on the basal plane of PGO due to the adsorption of PVP molecules.
 | ||
| Fig. 5 Raman spectra of GO and PGO. | ||
In order to further understand the interactions between PVP and GO, XPS has been employed to detect the surface chemical changes of GO. As shown in Fig. 6, only C1s and O1s peaks are seen in the XPS spectrum of GO (Fig. 6(a)), while N1s peak is clear in the XPS spectrum of PGO. For clarity, XPS spectrum of C1s has been fitted by multiple Gaussians. It can be seen that four peaks at 284.6, 286.5, 287.4 and 288.5 eV in the C1s of GO spectrum (Fig. 6(b)) are attributed to C–C, C–O, CO and O–CO, respectively.21 Compared with GO, the C1s spectrum of PGO (Fig. 6(c)) shows a new peak at 285.8 eV. This peak is ascribed to the carbon atom (C–N) at PVP.13 The C1s peak for the CO (287.4 eV) of GO shifts to higher binding energy (288.1 eV), implying the decrease of electron density, which probably due to the hydrogen-bond formation between PVP and GO. Meanwhile, the N1s peak of PGO shifts to higher binding energy (401.3 eV) compared with that of PVP (399.6 eV),22 which also supports the result of the hydrogen bonds between PVP and GO.23 The proposed schematic of interaction between PVP and GO is shown in Fig. 7.
 | ||
| Fig. 6 (a) XPS spectra of GO and PGO and high-resolution XPS spectra of C1s for (b) GO and (c) PGO, and (d) N1s for PGO. | ||
 | ||
| Fig. 7 Proposed schematic of interaction between PVP and GO. | ||
3.2 Dispersion of PGO in NR matrix
XRD patterns of GO/NR and PGO/NR nanocomposites studied in this work are illustrated in Fig. 8(a) and (b). It is clear that all samples show a broad diffraction peak at about 20°, which owes to the amorphous phase of NR matrix. There is an extra small diffraction peak at 2θ = 26.7° in the XRD patterns of GO/NR nanocomposites when the filler content exceeds 3 phr GO (Fig. 8(a)), suggesting the existence of ordered GO structure in NR matrix. It may be due to the re-stacking of GO in moulding process which is thermodynamically favored and facilitated by moulding pressure.7 However, there are no diffraction peaks apart from a broad diffraction peak at 20° in PGO/NR nanocomposites (Fig. 8(b)), which indicates that PGO could be dispersed well in NR matrix. It suggests that the modification of GO by PVP can prevent GO from restacking during the moulding process, which leads to a better dispersion of PGO in NR matrix. | ||
| Fig. 8 XRD patterns of (a) GO/NR and (b) PGO/NR nanocomposites. SEM images of freeze-fractured surfaces for (c) GO5 and (d) PGO5. | ||
To further study the dispersion of filler in the matrix, the freeze-fractured surfaces of GO5 and PGO5 are observed with SEM images. For GO5 (Fig. 8(c)), the GO aggregates are clearly observed (denoted by red arrows), which indicates a poor dispersion of GO in NR matrix. However, the PGO are uniformly dispersed throughout the matrix without obvious aggregation, indicating that dispersion of PGO in NR matrix is superior to that of GO. In addition, the fractured surface of PGO5 shows blurry, typical crinkled and rippled (Fig. 8(d)), which provides that the PGO has good compatibility with NR matrix.
3.3 Mechanical properties
The typical stress–strain curves of GO/NR and PGO/NR nanocomposites are illustrated in Fig. 9, and tensile modulus at 100% elongation (M100), tensile modulus at 300% elongation (M300), tensile strength, elongation at break and tear strength of these nanocomposites are summarized in Table 1. With the addition of GO, M100, M300, tensile strength and tear strength of GO/NR nanocomposites increase monotonically and then shows a decrease, which may due to the aggregation of GO. However, the M100, M300, tensile strength and tear strength of PGO/NR nanocomposites increase with the addition of PGO. It is attributed to the better dispersion of PGO in NR matrix. Taking PGO5 as an example, the tensile strength, M100, M300 and tear strength for PGO5 are significantly enhanced by 81%, 433%, 792% and 159%, respectively, compared with those of pristine NR. In Wu's research,16 GO modified by maleic anhydride grafted liquid polybutadiene could be dispersed homogeneously in NR matrix only up to 2.12 phr, meanwhile tensile strength, M300 and tear strength of modified GO/NR nanocomposite with 2.12 phr filler were increased by 40%, 109% and 85%, respectively, compared with pristine NR. Also, in our previous study,22 the maximum tensile strength of PVP modified RGO were increased by 23% compared with pristine NR. However, in the present work, 5 phr PGO can be dispersed well in NR matrix, and the effect of reinforcement is more significant. | ||
| Fig. 9 Typical stress–strain curves of (a) GO/NR and (b) PGO/NR nanocomposites. | ||
| Sample | M100 (MPa) | M300 (MPa) | Tensile strength (MPa) | Elongation at break (%) | Tear strength (kN m−1) |
|---|---|---|---|---|---|
| NR | 0.39 ± 0.09 | 1.25 ± 0.14 | 16.03 ± 0.69 | 681 ± 13 | 19.82 ± 0.63 |
| GO1 | 0.86 ± 0.05 | 2.70 ± 0.15 | 17.73 ± 0.82 | 610 ± 7 | 24.31 ± 0.90 |
| GO2 | 0.89 ± 0.03 | 3.89 ± 0.42 | 17.41 ± 0.99 | 547 ± 12 | 25.10 ± 0.24 |
| GO3 | 1.11 ± 0.09 | 5.15 ± 0.72 | 18.34 ± 0.65 | 550 ± 3 | 27.53 ± 0.32 |
| GO4 | 1.32 ± 0.02 | 6.42 ± 0.29 | 17.76 ± 0.18 | 505 ± 8 | 28.58 ± 0.27 |
| GO5 | 1.21 ± 0.05 | 5.71 ± 0.23 | 16.55 ± 0.34 | 474 ± 5 | 26.01 ± 0.37 |
| PGO1 | 0.90 ± 0.04 | 2.97 ± 0.21 | 19.71 ± 1.12 | 619 ± 28 | 31.27 ± 0.90 |
| PGO2 | 1.16 ± 0.06 | 4.70 ± 0.35 | 21.28 ± 0.60 | 559 ± 11 | 42.87 ± 0.69 |
| PGO3 | 1.33 ± 0.07 | 6.01 ± 0.50 | 24.37 ± 0.16 | 559 ± 21 | 41.60 ± 0.37 |
| PGO4 | 1.87 ± 0.06 | 8.42 ± 0.19 | 26.31 ± 0.34 | 538 ± 15 | 47.89 ± 0.61 |
| PGO5 | 2.08 ± 0.07 | 11.15 ± 0.34 | 28.94 ± 1.50 | 529 ± 23 | 51.36 ± 0.42 |
SEM is used to characterize the morphology of the tear-fractured surfaces of the nanocomposites. It is well known that the more tear line in fractured surface, the more energy could be dissipated in a tear process and the higher tear strength of the nanocomposites will be. The SEM micrographs of the tear-fractured surfaces of pristine NR, GO5 and PGO5 are shown in Fig. 10. For pristine NR (Fig. 10(a)), there is a smooth tear-fractured surface with few tear lines, which indicates poor tear strength. However, as shown in Fig. 10(b), the fracture surface of GO5 has more irregular tear paths, suggesting the greater tear strength. In the case of PGO5 (Fig. 10(c)), more tear paths with irregular branches are found. It supports that PGO5 has the highest tear strength. These fractured surface analyses results agree well with tear strength results in Table 1.
 | ||
| Fig. 10 SEM micrographs of the tear-fractured surfaces of (a) NR, (b) GO5 and (c) PGO5. | ||
3.4 Evaluation of network structures
To gain further insight into the reinforcement mechanism of PGO from the molecular level perspective, the tube model theory is used to analyze the rubber network microstructure.24 Based on the model, the constitutive equations are expressed as follows:
 | (3) |
 | (4) |
| λ′ = (λ − 1)E/E0 + 1 | (5) |
Fig. 11(a) shows the σM versus f(λ′) for GO/NR and PGO/NR nanocomposites. It is found that σM of all samples decrease sharply at small extension ratios (f(λ′) > 0.7), which is attributed to the Payne effect (a large nonlinear reduction of the stress with increasing strain).9 However, at high extension ratios (f(λ′) < 0.4), σM exhibits a large and abrupt upturn related to the rapidly increase of stress for all curves, which is associated to the strain-induced crystallization (SIC) in NR chains at high strain.25 It can be seen that for GO/NR and PGO/NR nanocomposites, the upturns related to the SIC of NR move to lower extension ratio with the increase of filler content (Fig. 11(a) arrow direction), and the shifting for PGO/NR nanocomposites is more significant compared with GO/NR nanocomposites, which suggests PGO is helpful to crystalline of NR at high strain.26 It has been reported that the more effective volume fraction of fillers, the lower strain for NR crystallization occurred and the more reinforcement of filler.27,28 Therefore, in our study, PGO have more effective filler volume fraction and better reinforcement to NR.
 | ||
| Fig. 11 (a) Mooney stress and (b) tube model parameters of GO/NR and PGO/NR nanocomposites. | ||
The parameters Ge and Gc in eqn (3) can be calculated from the slope and the y-axis interception of the linear part of intermediate deformation in Fig. 11(a), and the results are shown in Fig. 11(b). It is well known that the Ge may be contributed to the physical entanglements of NR chains on the surface of fillers, while Gc comes from the effective chemical crosslinks between rubber chains and filler. The parameters (Ge + Gc) represents the general crosslinks.29 For GO/NR nanocomposites, both the Ge and Gc increase with increasing GO content. It is because the polar functional groups on the surface of GO could take part in reaction.3 Therefore, more GO content is added in the system, more physical entanglement points and the effective chemical crosslinks are.
As for PGO/NR nanocomposites, both Ge and Gc are higher than those of unmodified GO/NR nanocomposites. PGO is better exfoliated and disperses well throughout the matrix, which provides with more effective filler volume fraction. Therefore, it provides more physical entanglement points and effective chemical crosslink points, leading to an increase in Ge and Gc, which can also answer for the enhanced mechanical properties of NR nanocomposites filled with PGO.
3.5 Dynamic mechanical properties
Dynamic mechanical analysis is used to provide insight into the influence of the fillers on the mechanical properties of the nanocomposites. Fig. 12(a) illustrates the temperature dependence of storage modulus (E′) of pristine NR, GO4 and PGO4. The E′, which reflects the elastic response of rubber, is a measure of the recoverable strain energy in the rubber.30 Both GO4 and PGO4 can bring remarkable enhancements in the E′. It is because the filler has high surface area and high modulus, resulting in an increase of the E′ of the nanocomposites.31 However, the E′ of PGO4 is lower than that of GO4, which may be ascribe to the plasticization of PVP. | ||
| Fig. 12 (a) E′ and (b) tanδ versus temperature for NR, GO4 and PGO4. | ||
In Fig. 12(b), the loss factor (tanδ) is plotted against temperature for pristine NR, GO4 and PGO4. The Tg of nanocomposites is determined from the peak of the tanδ versus temperature curve. In comparison with pristine NR, the Tg of GO4 shifts to lower temperature, because of the decrease in the fraction of polymer in the nanocomposite.31 The Tg of PGO4 has a further reduction, which could be attributed to the better dispersion of PGO and less fraction of polymer in the PGO/NR nanocomposite, compared with that of GO4.
The interface interaction between filler and NR can be demonstrated by a interaction parameter B, which is calculated using the equation below:22
 | (6) |
δf and tan δm are the tanδ peak value of the filled rubber and pristine rubber, respectively. The values of interaction parameters are represented in Fig. 12(b) inset. It is noted that the interaction parameter B of PGO4 is bigger (8.18) than that of GO4 (0.37). It indicates that PGO have better interaction with NR than GO.
3.6 Thermal conductivity
Fig. 13 shows the thermal conductivity of GO/NR and PGO/NR nanocomposites with various loadings of filler. As can been seen, the enhancement of thermal conductivity of GO/NR nanocomposites becomes weak after the filler content reaches 3 phr, which may result from the aggregation of GO. The thermal conductivity of the pristine NR is 0.112 W m−1 K−1, and the thermal conductivity of GO5 reaches 0.127 W m−1 K−1 with a 13% increment compared to that of pristine NR. In the case of PGO/NR nanocomposites, the thermal conductivity of the NR increases significantly with the increasing of PGO content. The thermal conductivity of PGO5 is further enhanced to 0.146 W m−1 K−1 by a 30% increment compared to that of pristine NR. In amorphous polymers, the mode of thermal conduction is primarily phonons.32,33 To improve the thermal transport in thermal conductive polymer, the phonon scattering or acoustic impedance mismatch at the interface between thermal conductive particles and polymeric matrix should be reduced.34 Due to the strong interfacial interaction between GO and XNBR matrix, the thermal conductivity of XNBR improved 40% with the addition of 4 phr GO (1.6 vol%).4 However, in our study, the polar GO has poor interfacial interaction with nonpolar NR, leading a high acoustic impedance mismatch and low thermal conductivity of GO/NR nanocomposite. After introduction of PVP, the interfacial interaction between GO and NR is enhanced (Section 3.2 SEM). In addition, PGO can be effectively exfoliated into a few layers, and the effective volume fraction of filler as well as the dispersion of GO in NR matrix improves. As a result, PGO forms a conductive path in NR with great interfacial adhesion between PGO and NR, which reduces the acoustic impedance mismatch,22 leading to improve thermal conductivity of rubber nanocomposites. | ||
| Fig. 13 Thermal conductivity of GO/NR and PGO/NR nanocomposites. | ||
3.7 Solvent resistance
The equilibrium solvent uptake (Qe) was used to discuss the solvent resistance of rubber nanocomposite,35 and the Qe curves of PGO/NR and GO/NR nanocomposites are shown in Fig. 14. It can be seen that the Qe value of GO/NR nanocomposites is obviously decreased with the addition of GO. The GO with ultrahigh aspect ratio acts as impenetrable barriers,36 and the free volume of rubber matrix reduces due to the tight adsorption of rubber chain by GO. Accordingly, the diffusion path of solvent becomes tortuous, causing a lower Qe value. The Qe value of PGO/NR nanocomposites is decreased more obviously compared to that of GO/NR nanocomposites. For example, the Qe value of PGO5 decreased by 46% and 17% compared to those of pristine NR and GO5, respectively. In our previous study, the Qe value of PRGO/NR nanocomposites decreased only 37% compared with pristine NR.22 It is due to strong interaction of PGO and NR and better dispersion of PGO in NR matrix, leading to higher effective volume fraction of filler and better solvent resistance of PGO/NR nanocomposites.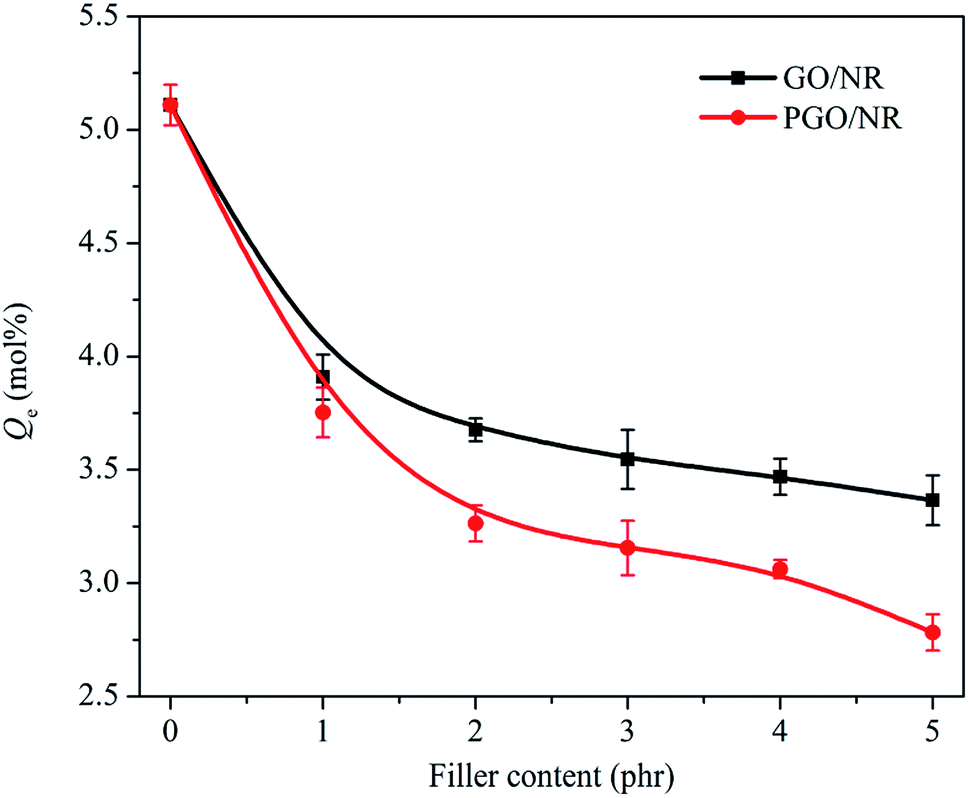 | ||
| Fig. 14 Equilibrium solvent uptake curves of GO/NR and PGO/NR nanocomposites. | ||
4 Conclusions
In summary, this study has shown a novel, facile approach to modified GO with PVP through a simplified polymeric adsorption method. PVP molecules could interact with GO via hydrogen bond, which enhanced the dispersion and compatibility of GO in NR matrix. PGO acted successfully as a reinforcement agent as well as a thermal conductivity improver in NR nanocomposites. The tensile strength, tear strength of PGO/NR nanocomposite with 5 phr PGO increased by 81%, 159%, compared with those of pristine NR, respectively. The thermal conductivity of PGO5 showed a 30% increment and the equilibrium solvent uptake decreased by 46% as well, compared with those of pristine NR.Acknowledgements
This work were financially supported by Key Research and Development Plan of Jiangsu Province with granted number BE2015158, Scientific Foundation of Nanjing Institute of Technology with granted number YKJ201508 and Priority Academic Program Development of Jiangsu Higher Education Institutions.References
- A. Mohamed, A. K. Anas, S. A. Bakar, T. Ardyani, W. M. W. Zin, S. Ibrahim, M. Sagisaka, P. Brown and J. Eastoe, J. Colloid Interface Sci., 2015, 455, 179–187 CrossRef CAS PubMed.
- L. Wu, P. Qu, R. Zhou, B. Wang and S. Liao, High Perform. Polym., 2015, 27, 486–496 CrossRef CAS.
- X. Liu, W. Kuang and B. Guo, Polymer, 2015, 56, 553–562 CrossRef CAS.
- J. Wang, H. Jia, Y. Tang, D. Ji, Y. Sun, X. Gong and L. Ding, J. Mater. Sci., 2013, 48, 1571–1577 CrossRef CAS.
- H. Kang, K. Zuo, Z. Wang, L. Zhang, L. Liu and B. Guo, Compos. Sci. Technol., 2014, 92, 1–8 CrossRef CAS.
- Y. Li, Q. Wang, T. Wang and G. Pan, J. Mater. Sci., 2012, 47, 730–738 CrossRef CAS.
- Z. Tang, X. Wu, B. Guo, L. Zhang and D. Jia, J. Mater. Chem., 2012, 22, 7492–7501 RSC.
- L. Zhao, X. Sun, Q. Liu, J. Zhao and W. Xing, J. Macromol. Sci., Phys., 2015, 54, 581–592 CrossRef CAS.
- W. Xing, J. Wu, G. Huang, H. Li, M. Tang and X. Fu, Polym. Int., 2014, 63, 1674–1681 CrossRef CAS.
- B. Dong, C. Liu, L. Zhang and Y. Wu, RSC Adv., 2015, 5, 17140–17148 RSC.
- A. S. Wajid, S. Das, F. Irin, H. S. T. Ahmed, J. L. Shelburne, D. Parviz, R. J. Fullerton, A. F. Jankowski, R. C. Hedden and M. J. Green, Carbon, 2012, 50, 526–534 CrossRef CAS.
- S. Yoon and I. In, J. Mater. Sci., 2011, 46, 1316–1321 CrossRef CAS.
- J. Zhang, G. Shen, W. Wang, X. Zhou and S. Guo, J. Mater. Chem., 2010, 20, 10824–10828 RSC.
- X. Chang, Z. Wang, S. Quan, Y. Xu, Z. Jiang and L. Shao, Appl. Surf. Sci., 2014, 316, 537–548 CrossRef CAS.
- W. S. Hummers and R. E. Offeman, J. Am. Chem. Soc., 1958, 80, 1339 CrossRef CAS.
- L. Wu, S. Liao, S. Zhang, X. Bai and X. Hou, Chin. J. Polym. Sci., 2015, 33, 1058–1068 CrossRef CAS.
- X. Li, H. Deng, Z. Li, H. Xiu, X. Qi, Q. Zhang, K. Wang, F. Chen and Q. Fu, Composites, Part A, 2015, 68, 264–275 CrossRef CAS.
- W. Cai, R. D. Piner, F. J. Stadermann, S. Park, M. A. Shaibat, Y. Ishii, D. Yang, A. Velamakanni, S. J. An, M. Stoller, J. An, D. Chen and R. S. Ruoff, Science, 2008, 321, 1815–1817 CrossRef CAS PubMed.
- T.-J. Oh, J.-H. Nam and Y. M. Jung, Vib. Spectrosc., 2009, 51, 15–21 CrossRef CAS.
- X. Liu, X. Pan, W. Shen, P. Ren, X. Han and X. Bao, J. Phys. Chem. C, 2012, 116, 7803–7809 CAS.
- N. Yan, G. Buonocore, M. Lavorgna, S. Kaciulis, S. K. Balijepalli, Y. Zhan, H. Xia and L. Ambrosio, Compos. Sci. Technol., 2014, 102, 74–81 CrossRef CAS.
- X. Zhang, J. Wang, H. Jia, S. You, X. Xiong, L. Ding and Z. Xu, Composites, Part B, 2016, 84, 121–129 CrossRef CAS.
- P. Jiang, S. Y. Li, S. S. Xie, Y. Gao and L. Song, Chemistry, 2004, 10, 4817–4821 CrossRef CAS PubMed.
- D. H. Fu, Y. H. Zhan, N. Yan and H. S. Xia, eXPRESS Polym. Lett., 2015, 9, 597–607 CrossRef CAS.
- D. Ponnamma, R. Ramachandran, S. Hussain, R. Rajaraman, G. Amarendra, K. T. Varughese and S. Thomas, Composites, Part A, 2015, 77, 164–171 CrossRef CAS.
- X. Wu, T. F. Lin, Z. H. Tang, B. C. Guo and G. S. Huang, eXPRESS Polym. Lett., 2015, 9, 672–685 CrossRef CAS.
- B. Ozbas, S. Toki, B. S. Hsiao, B. Chu, R. A. Register, I. A. Aksay, R. K. Prud'homme and D. H. Adamson, J. Polym. Sci., Part B: Polym. Phys., 2012, 50, 718–723 CrossRef CAS.
- J. R. Potts, O. Shankar, S. Murali, L. Du and R. S. Ruoff, Compos. Sci. Technol., 2013, 74, 166–172 CrossRef CAS.
- J. Wang, H. Jia, L. Ding and X. Xiong, Polym. Adv. Technol., 2015, 26, 1168–1175 CrossRef CAS.
- Y. Mao, S. Wen, Y. Chen, F. Zhang, P. Panine, T. W. Chan, L. Zhang, Y. Liang and L. Liu, Sci. Rep., 2013, 3, 1–7 Search PubMed.
- C. F. Matos, F. Galembeck and A. J. G. Zarbin, Carbon, 2014, 78, 469–479 CrossRef CAS.
- J. Shen, T. Li, Y. Long, N. Li and M. Ye, Soft Mater., 2013, 11, 326–333 CrossRef CAS.
- J. Wang, H. Jia, L. Ding, L. Zhu, X. Dai, X. Fei, F. Li and X. Gong, Polym. Compos., 2013, 34, 690–696 CrossRef CAS.
- Y. Hu, J. Shen, N. Li, H. Ma, M. Shi, B. Yan, W. Huang, W. Wang and M. Ye, Compos. Sci. Technol., 2010, 70, 2176–2182 CrossRef CAS.
- J. Abraham, H. J. Maria, S. C. George, N. Kalarikkal and S. Thomas, Phys. Chem. Chem. Phys., 2015, 17, 11217–11228 RSC.
- X. Zhang, J. Wang, H. Jia, S. You, X. Xiong, L. Ding and Z. Xu, Composites, Part B, 2015, 84, 121–129 CrossRef.
| This journal is © The Royal Society of Chemistry 2016 |