A modeling study by response surface methodology (RSM) on Sr(II) ion dynamic adsorption optimization using a novel magnetic ion imprinted polymer
Yan Liu*a,
Fangfang Liua,
Liang Ni*a,
Minjia Menga,
Xiangguo Mengb,
Guoxing Zhongb and
Jian Qiua
aSchool of Chemistry and Chemical Engineering, Jiangsu University, Zhenjiang 212013, China. E-mail: lyan@mail.ujs.edu.cn; Tel: +86 13775539306
bSchool of Biology and Chemical Engineering, Jiangsu University of Science and Technology, Zhenjiang 212003, China
First published on 23rd May 2016
Abstract
In this paper, response surface methodology (RSM) was successfully applied for the first time to optimize the dynamic adsorption conditions for the maximum removal of Sr(II) ion from aqueous solutions using Sr(II) ion imprinted polymers (Sr(II)-IIPs) as adsorbents. Sr(II)-IIPs based on the support matrix of magnetic SBA-15 (Fe3O4@SBA-15) were prepared by a surface imprinted technique and RAFT polymerization. The adsorbents can be separated from the fixed-bed column after adsorption by an external magnetic field. The effects of the operational parameters for maximizing Sr(II) removal were studied using Box–Behnken design (BBD) combined with RSM. A second-order quadratic model was built to predict the responses. The significance of the independent variables and their interactions was studied and tested by analysis of variance (ANOVA). The adequacy of the model was tested by the correlation between the experimental and predicted values of the responses. At optimum adsorption conditions, the Sr(II) adsorption capacity of Sr(II)-IIPs was found to be 22.12 mg g−1. Moreover, Sr(II)-IIPs exhibited an excellent dynamic selectivity of Sr(II) and could be easily regenerated by a dynamic desorption process with a desorption ratio of 99.2%.
1. Introduction
Ordered mesoporous materials, an intriguing type of porous material, have attracted rapidly growing attention in both academic and industrial areas due to their large surface area, high physico-chemical stability, uniform pore size and modifiable surface chemistry via functionalization.1 As an important family of mesoporous materials, many researchers have centered their interests on magnetic mesoporous materials because of their unique functionality and separability.2 The majority of researchers have focused on studies of the adsorption efficiency, functional stability and reusability aspects of these materials.3,4 However, one important point, selectivity, has not been greatly studied.Ion-imprinting polymers (IIPs) derived from molecularly imprinted polymers (MIPs) have attracted increasing attention because of their high selectivity and affinity for their target ions.5 However, IIPs prepared by conventional techniques have some inherent disadvantages.6 In order to overcome these drawbacks, surface ion polymers (SIPs) have emerged.7 Compared to traditional IIPs, the surface imprinted technique is more convenient to create IIPs with affinity sites through imprinting on the surface; these IIPs not only possess high selectivity but also avoid problems with mass transfer and binding kinetics.8,9
At present, most SIPs are prepared via free radical polymerization. The rate of chain propagation is usually rather difficult to control with regard to chain propagation and termination, leading to a broad size distribution of polymers.10 To address this problem, reversible addition–fragmentation chain transfer (RAFT) polymerization is arguably the most applicable technique among the various living/control radical polymerization techniques.11 RAFT polymerization is compatible with most vinyl monomers under mild reaction conditions, and the obtained polymers are end-capped by moieties derived from the RAFT agent.12
Strontium-90 (90Sr), one of the most abundant mid-low radionuclides in nuclear fission products, can accumulate in the human liver, lungs and kidneys through distribution along the food chain.13,14 90Sr has a long half-life (29 years) and has detrimental health effects on human beings. Sr(II) can easily replace Ca(II) in the human body and can cause anemia, leukemia, and other chronic illnesses.15 Hence, selective removal of strontium from radioactive waste is of vital necessity.
In most earlier studies, the adsorption capacity of Sr(II) was usually evaluated in batch adsorption mode.16,17 The adsorption capacity parameters obtained from batch experiments are useful in providing information about the effectiveness of a metal-adsorbent system. However, batch experimental data are often difficult to apply directly to fixed-bed adsorbers because isotherms cannot give accurate data for scaleup, since the flow column is not at equilibrium. Therefore, it is necessary to perform equilibrium studies using fixed-bed columns.18,19 In dynamic adsorption, solution continuously enters and leaves the column, where complete equilibrium is never established between the solute in solution and the amount adsorbed. After dynamic adsorption, the magnetic properties of the adsorbents allow separation from the fixed-bed column by simply applying a magnetic field.
In adsorption experiments, the adsorption capacity is dependent on many different parameters, such as adsorbent dosage, pH, initial ion concentration and temperature.20 Classical optimization studies use the one-factor-at-a-time approach, which is not only time-consuming but also does not reveal the influence of the interactions between the process variables and the dependent variables.21 As a solution, optimization studies can be carried out using response surface methodology (RSM). RSM is a useful statistical technique which has been applied in studies of complex variable processes.22–24 RSM employs multiple regression and correlation analyses as tools to assess the effects of two or more independent factors on the dependent variables. Numerous studies employing RSM have been reported for adsorption in batch experiments. Cakir et al.25 investigated the optimal conditions for static removal of strontium and uranium from aqueous solution. Murugesan et al.26 reported an RSM approach to predict the static adsorption capacity of lead(II) ion from aqueous solution. Ghaedi et al.27 investigated the optimal conditions for the static removal of methylene blue from aqueous solution. Cheng et al.28 evaluated the static adsorption capacity of copper through the application of RSM. However, there is no available information in the literature regarding the optimization of dynamic Sr(II) adsorption.
In this paper, a novel magnetic ion imprinted polymer prepared by a surface imprinted technique and RAFT polymerization was successfully applied to optimize the dynamic adsorption conditions for the maximum removal of Sr(II) ions from aqueous solution. The independent and cumulative effects of different operating parameters were investigated to achieve maximum adsorption capacity for dynamic adsorption of Sr(II) by Sr(II)-IIPs using RSM. To the best of our knowledge, this represents the first example of dynamic adsorption and RSM being employed to adsorb Sr(II). In addition, a second-order quadratic model was built and analysis of variance (ANOVA) was used to test the interactions. Furthermore, the dynamic selectivity and desorption of the Sr(II)-IIPs were also studied.
2. Experimental
2.1. Instruments
Fourier transmission infrared spectra (FT-IR, 4000 to 400 cm−1) were recorded on a NICOLET NEXUS 470 FT-IR apparatus (Nicolet, USA). The identification of the crystalline phase was performed using a Rigaku D/max-γB X-ray diffractometer (XRD) with monochromatized Cu Kα radiation. Thermogravimetric analysis (TGA) was carried out using a DSC/DTA-TG (STA 449C Jupiter, Netzsch, Germany) under flowing N2 (20 mL min−1) for the polymer decomposition study. The testing temperature was from room temperature to 800 °C, and the heating rate was 5 °C min−1. SEM was conducted on a JEOL JSM 6480 system; the samples were gold coated prior to analysis. TEM was carried out on a JEOL 2100 operating at 200 kV, and the samples were deposited from ethanolic solution onto holey-carbon copper grids. An ASAP2000 surface area and pore size analyzer (Micromeritics, USA) was used to measure the surface area and pore size distribution. Surface areas were calculated using the Brunauer–Emmett–Teller (BET) method over the range of p/p0 = 0.075 to 0.35, where a linear relationship is maintained. Pore size distributions were calculated using the Barrett–Joyner–Halenda (BJH) model applied to the desorption isotherm branch. Mesopore volumes were evaluated at p/p0 = 0.98. Magnetic measurement was carried out at room temperature using a vibrating sample magnetometer (VSM, 7300, Lakeshore). TAS-986 flame atomic adsorption spectrometry (FAAS) (Beijing, China) and inductively coupled plasma-atomic (optical) emission spectrometry (ICP-AES/ICP-OES) were combined to measure the concentrations of Sr(II) and other mental ions. A pHS-3C precision pH mV−1 meter (Shanghai Lida Instrument Factory, Shanghai, China) was used for pH adjustment.2.2. Chemicals and reagents
Pluronic P123, triblock poly-(ethylene oxide)–poly(propylene oxide)–poly(ethylene oxide), and (EO20PO70EO20, molecular weight 5800) were purchased from Sigma (USA). 3-(2-Aminoethylamino)propyltrimethoxysilane (AAPTS), N,N′-dicyclohexylcarbodiimide (DCC), ethylene glycol dimethacrylate (EGDMA), methacrylic acid (MAA) and 2,2′-azobisisobutyronitrile (AIBN) were purchased from the Aladdin Reagent Co., Ltd. (Shanghai, China). Tetraethyl orthosilicate (TEOS), acetic acid, acetonitrile (ACN), Fe(NO3)3·9H2O, Sr(NO3)2, Ca(NO3)2 and Ba(NO3)2 were obtained from Sinopharm Chemical Reagents Co. Ltd. (Shanghai, China). S-1-Dodecyl-S′-(α,α′-dimethyl-α′′-acetic acid)trithiocarbonate (TTCA)29 was prepared according to a literature method.Sr(II) stock solutions (1 g L−1) were prepared from Sr(NO3)2 using doubly distilled water (DDW) to give a final volume. The working solutions of the metals were obtained by appropriate dilution of the stock solutions. The stock solutions (1 g L−1) of Ca(II) and Ba(II) ions were prepared using their corresponding compounds. 0.1 mol L−1 HNO3 and 0.1 mol L−1 NH3·H2O were used to adjust the pH. All the chemicals used were of analytical grade.
2.3. Preparation of Sr(II)-IIPs
![[thin space (1/6-em)]](https://www.rsc.org/images/entities/char_2009.gif) :
:![[thin space (1/6-em)]](https://www.rsc.org/images/entities/char_2009.gif) 1, v/v) several times. Then, the solid was treated with 0.1 mol L−1 EDTA to completely leach the coordinated and non-coordinated Sr(II). Finally, the polymer was centrifuged with distilled water to neutralization and dried at 60 °C under vacuum. Thus, Sr(II)-IIPs were obtained. By comparison, non-imprinted polymer (NIP) was also prepared as a blank in parallel but without the addition of Sr(NO3)2.
1, v/v) several times. Then, the solid was treated with 0.1 mol L−1 EDTA to completely leach the coordinated and non-coordinated Sr(II). Finally, the polymer was centrifuged with distilled water to neutralization and dried at 60 °C under vacuum. Thus, Sr(II)-IIPs were obtained. By comparison, non-imprinted polymer (NIP) was also prepared as a blank in parallel but without the addition of Sr(NO3)2.2.4. Dynamic adsorption studies
The fixed-bed method was adopted for the dynamic adsorption of Sr(II) in water. This could not only improve the efficiency of the wastewater treatment, but also enabled control of the whole adsorption process via adjusting adsorbent dosage, pH, inlet ion concentration and adsorption temperature.The adsorption column was made from glass with a height of 20 cm and a diameter of 1 cm, as shown in Fig. 1. A small amount of quartz sand was placed at the bottom of the column, and then 50, 100 or 150 mg of Sr(II)-IIPs were placed in the column to obtain a bed height of the adsorbent (equiv. to 0.25, 0.5 and 0.75 cm bed depth). In order to rinse the adsorbent and equilibrate the particles, DDW was passed through the column before running experiments with Sr(II) solution. Then, feeding solutions with pH values of 4, 6 or 8 and initial concentrations of 10, 40 or 70 mg L−1 were transported using a peristaltic pump from the top of the column to the bottom at temperatures of 15, 25 or 35 °C with flow rates of 1.0 mL min−1. The effluents were collected at fixed time intervals until the effluent Sr(II) concentration was nearly equal to the influent concentration. The adsorbent could be conveniently separated from the fixed-bed column after adsorption by an external magnetic field.
2.5. Dynamic adsorption analysis
The breakthrough curves show the loading behavior of Sr(II) ions to be removed and are usually expressed in terms of adsorbed strontium ions concentration (Cad), inlet concentration (C0), outlet concentration (Ct) or normalized concentration, defined as the ratio of outlet concentration to inlet concentration (Ct/C0) as a function of time or volume of effluent for a given bed height. The desired breakthrough concentration was determined at 10% of the inlet concentration, and the time required to reach to the breakthrough point was known as the breakthrough time (tb). The flow through the tested column was continued until the concentration of adsorbate effluent approached C0, which indicated the exhaustion point (te).31The area under the breakthrough curve (Ac) obtained by integrating the adsorbed concentration Cad versus time t can be used to determine the quantity adsorbed, qtotal (mg g−1), for a given inlet concentration and flow rate given by:32
 | (1) |
 | (2) |
2.6. RSM
RSM, a combination of mathematical and statistical methods, is used to evaluate the effect of several factors and their interaction on system response. RSM is an important branch of experimental design and a critical technology in developing new processes, optimizing their performance, and improving the design and formulation of new products. RSM contains three steps: design of experiments, response surface modeling and optimization. In this research, a three level, four variable Box–Behnken design (BBD) was applied to determine the maximum Sr(II) adsorption capacity on a Sr(II)-IIPs bed.33Experimental data were fitted to a quadratic polynomial model and regression coefficients were obtained. The non-linear generated quadratic model used in the response surface was as follows:34
 | (3) |
2.7. Selectivity experiments
In order to further examine the recognition specificity of Sr(II)-IIPs for Sr(II) ion with respect to Ca(II) and Ba(II) ions, competitive dynamic adsorption experiments were carried out. Binary mixed solutions of Sr(II)/Ca(II) and Sr(II)/Ba(II) were prepared. The concentrations and pH of the two anions in the mixed solution were the same. 0.1 g Sr(II)-IIPs was packed into the column, and the dynamic adsorption experiment was conducted. After adsorption equilibrium was reached, the concentration of each anion in the supernatant was determined by ICP-AES. The distribution coefficient Kd and the selectivity coefficient k were given as follows:
 | (4) |
 | (5) |
2.8. Dynamic desorption experiments
An ideal adsorbent should not only possess high adsorption capability, but also show favorable desorption properties, which will significantly reduce the overall cost of the adsorbents. In this work, adsorbed Sr(II) ions were desorbed from the adsorbent by treatment with 0.05 mol L−1 EDTA solution until Sr(II) could not be detected. The effluent was collected at a fixed time interval, and the concentrations of Sr(II) ion in these effluents were determined.3. Results and discussion
3.1. Preparation of Sr(II)-IIPs
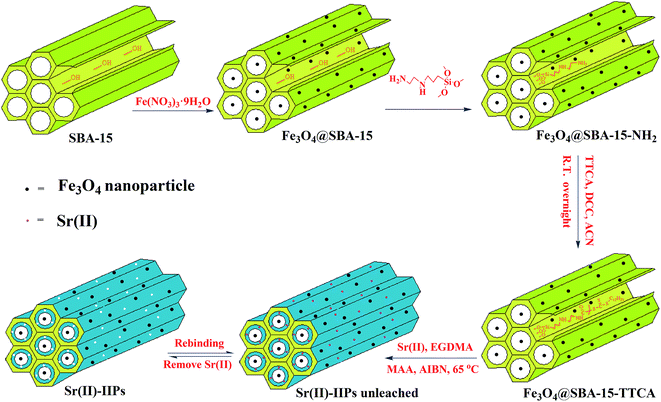
As shown in Scheme 1, the synthesis of Sr(II)-IIPs could be simply divided into four steps: (1) Fe3O4@SBA-15 was obtained by calcining SBA-15 and Fe(NO3)3·9H2O. (2) Fe3O4@SBA-15 was modified with AAPTS, introducing –NH2 onto the surface of Fe3O4@SBA-15 through a silanization reaction. (3) Fe3O4@SBA-15-NH2 was modified through amide coupling involving the carboxylic groups of the TTCA and the amine groups on the Fe3O4@SBA-15-NH2 surface. (4) Fe3O4@SBA-15-TTCA was placed into a polymerization solution composed of template (Sr(II)), monomer (MAA), crosslinker (EGDMA), and initiator (AIBN). The imprinted polymers were obtained on the external and internal surfaces of Fe3O4@SBA-15 through the chain propagation of the grafted RAFT agent under controlled radical polymerization. After polymerization, the chelated Sr(II) was removed by EDTA. Finally, a novel Sr(II) ion-imprinted polymer can be formed on the Fe3O4@SBA-15 surface through the chain propagation of the grafted RAFT agent under controlled radical polymerization with the surface imprinting technique.3.2. Characterization
![[double bond, length as m-dash]](https://www.rsc.org/images/entities/char_e001.gif) S stretching vibrations, respectively. Furthermore, the Sr(II)-IIPs (Fig. 2d) exhibited obvious absorption bands around 1712 cm−1, which is due to the C
S stretching vibrations, respectively. Furthermore, the Sr(II)-IIPs (Fig. 2d) exhibited obvious absorption bands around 1712 cm−1, which is due to the C![[double bond, length as m-dash]](https://www.rsc.org/images/entities/char_e001.gif) O stretching vibration of carboxyl groups. All of the above phenomena suggested that the Sr(II)-IIPs were successfully synthesized.
O stretching vibration of carboxyl groups. All of the above phenomena suggested that the Sr(II)-IIPs were successfully synthesized.
Fig. 4 showed the wide-angle XRD patterns of the corresponding samples. Six diffraction peaks for Fe3O4 can be indexed to (220), (311), (400), (422), (511) and (440), which match well with the database of magnetite in the JCPDS file (JCPDS card no. 19-0629). All peaks of Sr(II)-IIPs are almost the same as Fe3O4@SBA-15, which revealed that the surface-modified Fe3O4 particles did not lead to their phase changes.
 | ||
| Fig. 5 N2 adsorption–desorption isotherms and pore size distribution (inset) of Fe3O4@SBA-15, Sr(II)-IIP and NIP. | ||
| Samples | BET surface area (m2 g−1) | Pore size (nm) | Pore volume (cm3 g−1) |
|---|---|---|---|
| Fe3O4@SBA-15 | 479.5 | 5.6 | 1.239 |
| Sr(II)-IIP | 416.0 | 3.8 | 1.089 |
| NIP | 376.9 | 3.6 | 0.991 |
3.3. Experimental design for the adsorption studies
Dynamic adsorption experiments based on BBD were conducted to study the effect of the pre-selected four independent variables on the Sr(II) adsorption capacity of the Sr(II)-IIPs. The initial Sr(II) ion concentration, temperature, initial pH and adsorbent dosage were chosen as the variables based on previous experiments.18,19,21–23 Sr(II) adsorption capacity (qe) was selected as the experiment response. The coded levels of the variables as the low (−1), middle (0) and high (+1) levels of the factors, as well as the experimental design and the obtained results, are reported in Table 2.| Variables | Symbol | Factor code | Level of factors | ||
|---|---|---|---|---|---|
| −1 | 0 | +1 | |||
| pH | pH | XI | 4 | 6 | 8 |
| Temperature (°C) | T | XII | 15 | 25 | 35 |
| Initial concentration (mg L−1) | Co | XIII | 10 | 40 | 70 |
| Adsorbent dosage (mg) | m | XIV | 50 | 100 | 150 |
| Run | Coded levels | Observed adsorption capacity qe (mg g−1) | Predicted adsorption capacity qe (mg g−1) | Residual | |||
|---|---|---|---|---|---|---|---|
| XI | XII | XIII | XIV | ||||
| 1 | 4 | 35 | 40 | 100 | 5.38 | 6.06 | −0.68 |
| 2 | 8 | 15 | 40 | 100 | 6.34 | 5.87 | 0.48 |
| 3 | 4 | 25 | 40 | 150 | 2.86 | 2.49 | 0.38 |
| 4 | 6 | 25 | 40 | 100 | 14.64 | 14.82 | −0.18 |
| 5 | 6 | 15 | 70 | 100 | 18.06 | 17.49 | 0.57 |
| 6 | 6 | 25 | 10 | 150 | 8.89 | 9.35 | −0.47 |
| 7 | 8 | 35 | 40 | 100 | 7.07 | 7.35 | −0.28 |
| 8 | 6 | 35 | 40 | 50 | 18.69 | 18.05 | 0.64 |
| 9 | 6 | 25 | 40 | 100 | 15.19 | 14.82 | 0.37 |
| 10 | 6 | 35 | 70 | 100 | 20.55 | 20.13 | 0.42 |
| 11 | 6 | 25 | 40 | 100 | 15.04 | 14.82 | 0.23 |
| 12 | 6 | 15 | 40 | 50 | 14.05 | 14.32 | −0.27 |
| 13 | 4 | 25 | 70 | 100 | 7.00 | 7.29 | −0.29 |
| 14 | 8 | 25 | 40 | 150 | 4.65 | 4.35 | 0.30 |
| 15 | 4 | 25 | 10 | 100 | 0.58 | −0.29 | 0.87 |
| 16 | 4 | 15 | 10 | 100 | 3.46 | 3.39 | 0.07 |
| 17 | 6 | 35 | 10 | 100 | 11.25 | 11.88 | −0.63 |
| 18 | 8 | 25 | 70 | 100 | 8.68 | 9.28 | −0.60 |
| 19 | 6 | 25 | 40 | 100 | 14.41 | 14.82 | −0.41 |
| 20 | 4 | 25 | 40 | 50 | 4.34 | 4.70 | −0.36 |
| 21 | 6 | 15 | 40 | 150 | 13.35 | 13.73 | −0.38 |
| 22 | 6 | 35 | 40 | 150 | 14.69 | 14.16 | 0.53 |
| 23 | 6 | 25 | 70 | 50 | 19.54 | 19.28 | 0.26 |
| 24 | 6 | 15 | 10 | 100 | 9.88 | 10.36 | −0.48 |
| 25 | 8 | 25 | 40 | 50 | 6.17 | 6.61 | −0.44 |
| 26 | 8 | 25 | 10 | 100 | 2.03 | 1.49 | 0.54 |
| 27 | 6 | 25 | 40 | 100 | 14.80 | 14.82 | −0.02 |
| 28 | 6 | 25 | 10 | 50 | 10.79 | 10.63 | 0.16 |
| 29 | 6 | 25 | 70 | 150 | 15.71 | 16.07 | −0.36 |
| Qe = +11.06 + 0.70XI + 0.78XII + 2.87XIII − 0.84XIV − 0.22XIXII + 0.042XIXIII − 7.65 × 10⁻³XIXIV + 0.21XIIXIII − 0.61XIIXIV − 0.36XIIIXIV − 7.34XI2 + 0.51XII2 − 0.40XIII2 − 0.33XIV2 | (6) |
Eqn (6) enables a good visualization of the effects of each parameter and their interactions on the response. A positive sign in front of the terms indicates a synergistic effect, whereas a negative sign indicates an antagonistic effect.
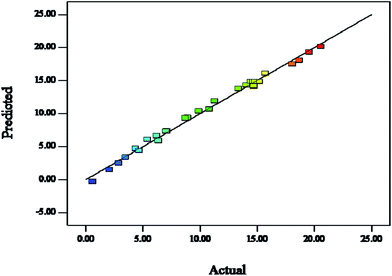
The significance and adequacy of the models were further justified through analysis of variance (ANOVA).37 The ANOVA for the quadratic model is listed in Table 3. The model F value of 158.69 and the probability > F of less than 0.0001 implied that this model was significant.38 The high value of the adjusted determination coefficient (Radj2 = 0.9875) implied the significance of the model parameters. This can be seen in Fig. 9 by comparing the measured values against the predicted responses. The data points were well distributed close to a straight line, which suggested that there was an excellent correlation between the experimental and predicted values of the response. The lack of fit measured the failure of the model to represent data in the experimental domain at points which are not included in the regression. The non-significant value of the lack of fit (more than 0.05) showed that the quadratic model was valid for the present study. The p-value was also used as a tool to check the significance of each coefficient; the smaller the p-value, the more significant the corresponding coefficient. In this case, the XI, XII, XIII, XIV, XIIXIV, XI2, XII2 and XIII2 factors were significant model terms, whereas XIXII, XIXIII, XIXIV, XIIXIII, XIIIXIV and XIV2 were insignificant to the response.
| Sources of variation | Sum of squares | Degrees of freedom | Mean square | F value | Probability > F | Comment |
|---|---|---|---|---|---|---|
| a R2 = 0.9937, Radj2 = 0.9875, adequacy precision = 44.533. | ||||||
| Model | 902.84 | 14 | 64.49 | 158.69 | <0.0001 | Significant |
| XI | 10.67 | 1 | 10.67 | 26.26 | 0.0002 | Significant |
| XII | 12.97 | 1 | 12.97 | 31.93 | <0.0001 | Significant |
| XIII | 177.2 | 1 | 177.2 | 436.05 | <0.0001 | Significant |
| XIV | 15.05 | 1 | 15.05 | 37.03 | <0.0001 | Significant |
| XIXII | 0.35 | 1 | 0.35 | 0.87 | 0.3669 | |
| XIXIII | 0.012 | 1 | 0.012 | 0.031 | 0.8635 | |
| XIXIV | 4.20 × 10⁻⁴ | 1 | 4.20 × 10⁻⁴ | 1.03 × 10⁻³ | 0.9748 | |
| XIIXIII | 0.31 | 1 | 0.31 | 0.77 | 0.395 | |
| XIIXIV | 2.72 | 1 | 2.72 | 6.68 | 0.0216 | Significant |
| XIIIXIV | 0.93 | 1 | 0.93 | 2.3 | 0.1518 | |
| XI2 | 627.58 | 1 | 627.58 | 1544.37 | <0.0001 | Significant |
| XII2 | 3.07 | 1 | 3.07 | 7.56 | 0.0157 | Significant |
| XIII2 | 1.89 | 1 | 1.89 | 4.65 | 0.049 | Significant |
| XIV2 | 1.27 | 1 | 1.27 | 3.13 | 0.0985 | |
| Residual | 5.69 | 14 | 0.41 | |||
| Lack of fit | 5.3 | 10 | 0.53 | 5.47 | 0.0578 | Not significant |
| Pure error | 0.39 | 4 | 0.097 | |||
| Total | 908.53 | 28 | ||||
3.3.2.1. Effect of adsorbent dosage. The effects of adsorbent dosage from 50 to 150 mg with pH 6.0, a flow rate of 1 mL min−1 and a feed concentration of 40 mg L−1 at 25 °C are shown in Fig. 10. A comparison between the plotted curves indicated that increasing the adsorbent dosage caused a reduction in the breakthrough and exhaustive times. As shown in Table 4, the adsorbent dosages influenced the Sr(II) adsorption capacities of 16.12, 14.78 and 13.38 mg g−1, which were recorded at 50, 100 and 150 mg, respectively. The decrease of the adsorbent dosage resulted in high adsorption capacity. The breakthrough curves became steep, and the adsorbent attained saturated adsorption more rapidly.
| Co (mg L−1) | m (mg) | pH | T (°C) | tb (min) | te (min) | Qtotal (mg) | Qe (mg g−1) |
|---|---|---|---|---|---|---|---|
| 40 | 50 | 6 | 25 | 5 | 37 | 0.806 | 16.12 |
| 40 | 100 | 6 | 25 | 19 | 62 | 1.478 | 14.78 |
| 40 | 150 | 6 | 25 | 26 | 83 | 2.007 | 13.38 |
| 40 | 100 | 4 | 25 | 5 | 20 | 0.467 | 4.67 |
| 40 | 100 | 6 | 25 | 16 | 74 | 1.562 | 15.62 |
| 40 | 100 | 8 | 25 | 8 | 26 | 0.667 | 6.67 |
| 10 | 100 | 6 | 25 | 24 | 86 | 0.481 | 4.81 |
| 40 | 100 | 6 | 25 | 14 | 65 | 1.493 | 14.93 |
| 70 | 100 | 6 | 25 | 12 | 47 | 1.911 | 19.11 |
| 40 | 100 | 6 | 15 | 14 | 61 | 1.413 | 14.13 |
| 40 | 100 | 6 | 25 | 22 | 71 | 1.716 | 17.16 |
| 40 | 100 | 6 | 35 | 28 | 80 | 2.052 | 20.52 |
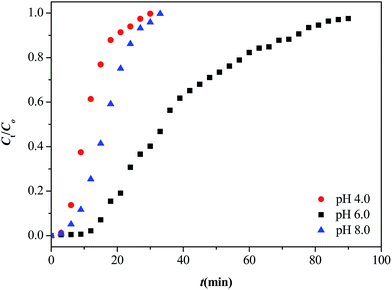
3.3.2.2. Effect of pH value. It is known that the pH of the solution is a significant factor affecting adsorption processes. The pH affected not only the surface charge of the adsorbent, but also the degree of ionization and speciation of the metal in solution. The breakthrough curves of Sr(II) at various pH values from 4 to 8 with an adsorbent dosage of 100 mg, a flow rate of 1 mL min−1 and an initial concentration of 40 mg L−1 at 25 °C are shown in Fig. 11. It can be easily seen that the dynamic adsorption efficiency of Sr(II) at pH 6 was greater than that pH 4 and 8. Increasing the pH value from 4 to 6 led to an increase of the Sr(II) adsorption capacity from 4.67 to 15.62 mg g−1. Then, the adsorption capacity decreased from 15.62 to 6.67 mg g−1 when the pH value was increased to 8. The main reasons were given as follows: at low pH values, the metal ion uptake was weakened due to the presence of H+ ions competing for the adsorption sites; at high pH values, Sr(II) could form monovalent ionic pairs (SrOH+, for example) before being adsorbed. Taking all reasons into consideration, pH 6.0 was the optimum pH in this work.
3.3.2.3. Effect of initial Sr(II) ion concentration. Studies of the effects of the variation of inlet Sr(II) concentration on the breakthrough characteristics were performed at pH 6.0, an adsorbent dose of 100 mg and a feed flow rate of 1 mL min−1 at 25 °C, as depicted in Fig. 12 and Table 4. It was clearly observed that the exhaustion time decreased with increasing initial Sr(II) concentration. When the initial Sr(II) concentration was increased from 10 to 70 mg L−1, tb and te decreased from 24 to 12 min and from 86 to 47 min, respectively. This was because the high influent concentration saturated the fiber bed more quickly. As shown in Table 4, the equilibrium adsorption capacity increased from 4.81 to 19.11 mg g−1 when the influent concentration increased from 10 to 70 mg L−1. As the feed concentration increased, the metal loading rate increased, which lead to a decrease in the adsorption zone.
 | ||
| Fig. 12 Effect of initial Sr(II) concentration on the breakthrough curve of Sr(II) adsorption on Sr(II)-IIP. | ||
3.3.2.4. Effect of temperature. The effect of temperature from 15 to 35 °C at pH 6 with an adsorbent dose of 100 mg at an initial Sr(II) concentration of 40 mg L−1 and a flow rate of 1.0 mL min−1 on the breakthrough curves can be seen in Fig. 13 and Table 4. When the temperature increased from 15 °C to 35 °C, tb and te increased from 14 to 28 min and from 61 to 80 min, respectively. The maximum adsorption capacities of the Sr(II)-IIPs bed at 15, 25 and 35 °C were 14.13, 17.16 and 20.52 mg g−1, respectively. This shows that the adsorption of Sr(II) was favored at high temperature.
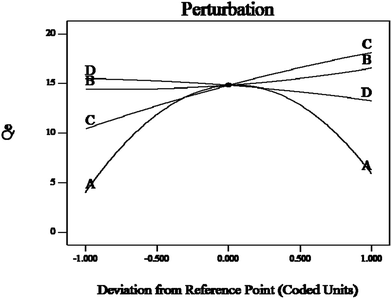
These results can be demonstrated by a perturbation plot (Fig. 14), which showed the comparative effects of all independent variables on the Sr(II) adsorption efficiency. The curve of the pH value (A) showed a sharp curvature; the maximum adsorption capacity was reached at pH 6. The equilibrium adsorption capacity of Sr(II) on the Sr(II)-IIPs bed increased with increasing initial Sr(II) concentration (B) and temperature (C), but decreased with increasing adsorbent dosage (D).
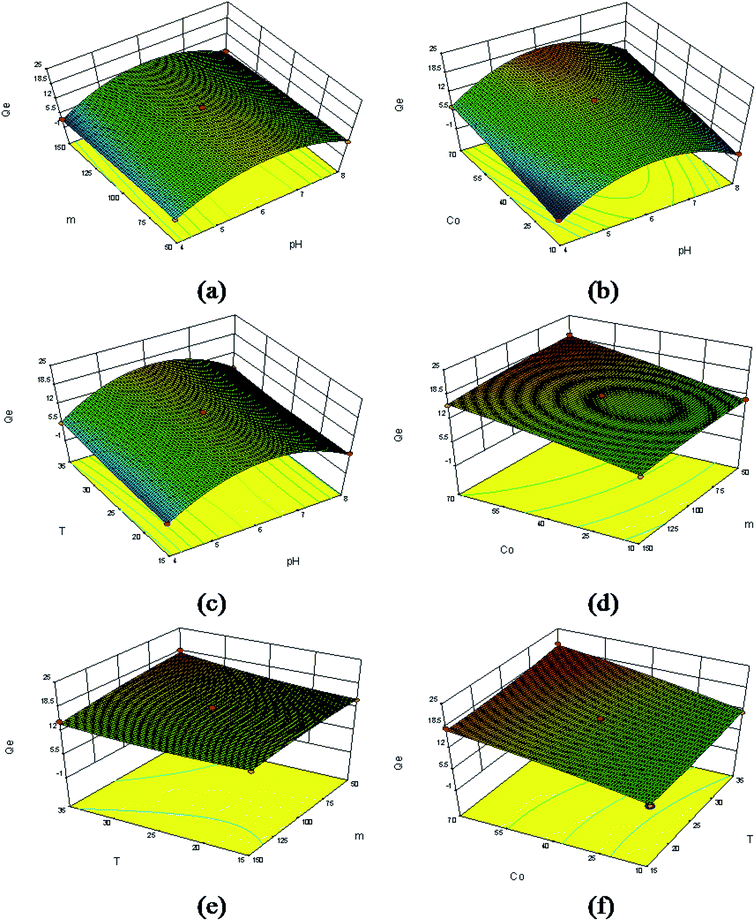
The combined effect of pH and adsorbent dose on Sr(II) adsorption is shown in Fig. 15a. This figure shows that the adsorption increased with increasing pH up to 4 to 6 and afterwards showed a slight decrease. The observed lower adsorption in acidic medium may be attributed to the partial protonation of the active groups and the competition of H+ with metal ions for adsorption sites on the Sr(II)-IIPs. A maximum Sr(II) adsorption is observed at pH 6.0 and an adsorbent dose of 50 mg.
Fig. 15b contains the response surface plot showing the effect of pH and initial Sr(II) ion concentration on Sr(II) adsorption. It was evident that the Sr(II) adsorption increased with initial Sr(II) concentration. This was because a greater mass of Sr(II) can be adsorbed when the initial Sr(II) concentration of the aqueous solution is increased. A maximum adsorption capacity of 21.43 mg g−1 was reached at pH 6.0 and 70 mg L−1 of Sr(II) concentration.
The three-dimensional effect of pH and temperature on the adsorption capacity with constant adsorbent dosage and initial Sr(II) ion concentration is depicted in Fig. 15c. It was evident that the adsorption increased with increasing pH up to 6 and showed a slight decrease afterwards. Increasing the temperature from 15 to 35 °C facilitated the removal of Sr(II) ions. This pattern of Sr(II) sorption may be explained by the higher temperature, which would enlarge the pore size of the sorbents, allowing Sr(II) to enter the pores more easily. A maximum adsorption capacity was noted at pH 6.0 and 35 °C.
Fig. 15d shows the interactive influence of adsorbent dose and initial concentration on Sr(II) adsorption. It is evident that the Sr(II) adsorption increased with initial concentration and decreased with increasing dose within the experimental range. This may be because all the active sites were entirely exposed and utilized at lower adsorbent doses, and only some of the active sites were exposed and occupied by Sr(II) at higher adsorbent doses. A maximum adsorption of Sr(II) was determined at 70 mg L−1 initial concentration and an adsorbent dose of 50 mg.
The plot for the combined effect of adsorbent dose and temperature (Fig. 15e) suggested that the Sr(II) adsorption decreased with increasing dose and increased with increasing temperature. A maximum adsorption of Sr(II) was reached at 35 °C and an adsorbent dose of 50 mg.
Fig. 15f displays the dependence of the sorption on both initial Sr(II) ion concentration and temperature. A maximum adsorption capacity of 20.13 mg g−1 was obtained at 35 °C and an initial Sr(II) ion concentration of 70 mg L−1 by fixing the initial pH as 6 and the adsorbent dose as 100 mg. The Sr(II) adsorption increased with both initial Sr(II) ion concentration and temperature within their respective experimental ranges.
3.4. Selectivity studies
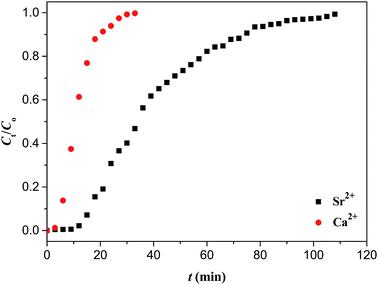
In order to examine the recognition specificity of Sr(II)-IIPs for Sr(II) ion with respect to Ca(II) and Ba(II) ion, competitive adsorption experiments were performed. Fig. 16 and 17 display the dynamic adsorption curves of Sr(II)-IIPs for Sr(II) ion with Ca(II) and Ba(II) ion, respectively.It can be observed from Fig. 16 that solutions of Sr(II) ion and Ca(II) ion with the same concentration (40 mg L−1) flowed through the column packed with Sr(II)-IIPs particles, respectively. The exhaustion times were 74 and 20 min for Sr(II) ion and Ca(II) ion, respectively. This fact showed that Sr(II)-IIPs had obvious combination selectivity for Sr(II) ions. A similar conclusion can also be found from Fig. 17. The reason for these findings was that the cavities imprinted by Sr(II) were unmatched to other ions in the size, shape and spatial arrangement of the combining sites.
3.5. Dynamic desorption
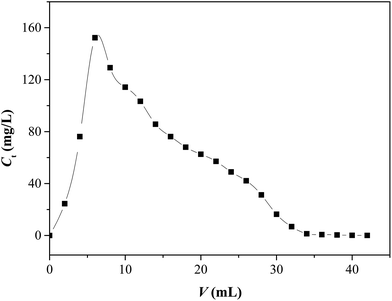
An aqueous solution of EDTA with a concentration of 0.05 mol L−1 was used as the eluent. The eluent was made to pass through the column packed with Sr(II)-IIPs containing bound Sr(II) ion in a saturated state, and the dynamic desorption experiment was conducted. The dynamic desorption curve is presented in Fig. 18.It can be seen in Fig. 18 that the desorption curve was cuspidal and showed no trailing, indicating that the template ion combined in the packed column was easy to wash off.40 The Sr(II) concentration of the eluent reached a maximum value at V = 6.0 mL and then decreased with the volume of eluent. The desorption ratios were calculated to reach 98.6% and 99.2% at 32 and 42 mL, respectively. This implied that the recovery of Sr(II)-IIPs was feasible and very convenient.
4. Conclusion
The objective of the present study was to determine and optimize the Sr(II) dynamic adsorption capacity of a new Sr(II) ion imprinted polymer. Sr(II)-IIPs were successfully synthesized by a surface imprinted technique combined with RAFT polymerization. Response surface methodology based on four variable Box–Behnken designs was employed to determine the relationship between the factors and the adsorption capacity of the sorbent. The adsorbents could be conveniently separated from the fixed-bed column after adsorption by the external magnetic field. The model predicted values of the response variable were in good agreement with the experimentally determined values (R2 = 0.9937, Radj2 = 0.9875). The optimum sorption conditions for the dynamic removal of Sr(II) were evaluated as adsorbent dose 50.02 mg, pH 6.08, temperature 35 °C and initial Sr(II) concentration 70.0 mg L−1. Under these optimum conditions, the maximum dynamic adsorption capacity of Sr(II) ion was found to be 22.12 mg g−1. Furthermore, the Sr(II)-IIPs had an excellent dynamic selectivity for Sr(II) and good eluting performance, with a dynamic desorption efficiency up to 99.2%.Acknowledgements
This work was financially supported by the National Natural Science Foundation of China (No. 21207051, 21576124), PhD Programs Foundation of Ministry of Education of China (No. 20123227120015), Natural Science Foundation of Jiangsu Province (BK20150483), a China Postdoctoral Science Foundation funded project (No. 2012M511220), a special financial grant from the China Postdoctoral Science Foundation (2014T70488), Natural Science Fund for Colleges and Universities in Jiangsu Province (No. 15KJB550003), Society Development Fund of Zhenjiang (No. SH2012021, SH2013110), and Programs of Senior Talent Foundation of Jiangsu University (No. 15JDG024).References
- B. Lebeau, A. Galarneau and M. Linden, Chem. Soc. Rev., 2013, 42, 3661–3662 RSC.
- J. Liu, S. Z. Qiao and Q. H. Hu, Small, 2011, 7, 425–443 CrossRef CAS PubMed.
- Z. Wu and D. Zhao, Chem. Commun., 2011, 47, 3332–3338 RSC.
- L. T. Gibson, Chem. Soc. Rev., 2014, 43, 5173–5182 RSC.
- X. Du, H. Zhang, X. Hao and G. Guan, ACS Appl. Mater. Interfaces, 2014, 6, 9543–9549 CAS.
- C. Branger, W. Meouche and A. Margaillan, React. Funct. Polym., 2013, 73, 859–875 CrossRef CAS.
- X. Cai, J. Li, Z. Zhang, F. Yang, R. Dong and L. Chen, ACS Appl. Mater. Interfaces, 2013, 6, 305–313 Search PubMed.
- R. He, W. Li, D. Deng, W. Chen, H. Li, C. Wei and Y. Tang, J. Mater. Chem. A, 2015, 3, 9789–9798 CAS.
- H. Hou, D. Yu and G. Hu, Langmuir, 2015, 31, 1376–1384 CrossRef CAS PubMed.
- Y. Li, X. Li, C. Dong, Y. Li, P. Jin and J. Qi, Biosens. Bioelectron., 2009, 25, 306–312 CrossRef CAS PubMed.
- R. Nicolaÿ, Macromolecules, 2011, 45, 821–827 CrossRef.
- G. Moad, E. Rizzardo and S. H. Thang, Aust. J. Chem., 2012, 65, 985–1076 CrossRef CAS.
- B. Ma, S. Oh, W. S. Shin and S. J. Choi, Desalination, 2011, 276, 336–346 CrossRef CAS.
- Q. Li, H. Liu, T. Liu, M. Guo, B. Qing, X. Ye and Z. Wu, Chem. Eng. J., 2010, 157, 401–407 CrossRef CAS.
- M. Wang, L. Xu, J. Peng, M. Zhai, J. Li and G. Wei, J. Hazard. Mater., 2009, 171, 820–826 CrossRef CAS PubMed.
- T. Wen, X. Wu, M. Liu, Z. Xing, X. Wang and A. W. Xu, Dalton Trans., 2014, 43, 7464–7472 RSC.
- X. Li, W. Mu, X. Xie, B. Liu, H. Tang, G. Zhou, H. Wei, Y. Jian and S. Lou, J. Hazard. Mater., 2014, 264, 386–394 CrossRef CAS PubMed.
- D. Zhang, C. Zhang and P. Zhou, J. Hazard. Mater., 2011, 186, 971–977 CrossRef CAS PubMed.
- Y. N. Hu, H. Y. Wang, G. P. Cao, C. Meng and W. K. Yuan, Desalination, 2011, 279, 54–60 CrossRef CAS.
- M. Meng, Z. Wang, L. Ma, M. Zhang, J. Wang, X. Dai and Y. Yan, Ind. Eng. Chem. Res., 2012, 51, 14915–14924 CrossRef CAS.
- K. P. Singh, S. Gupta, A. K. Singh and S. Sinha, J. Hazard. Mater., 2011, 186, 1462–1473 CrossRef CAS PubMed.
- S. Dutta, A. Bhattacharyya, A. Ganguly, S. Gupta and S. Basu, Desalination, 2011, 275, 26–36 CrossRef CAS.
- A. Özer, G. Gürbüz, A. Calimli and B. K. Körbahti, Chem. Eng. J., 2009, 146, 377–387 CrossRef.
- M. A. Ahmad and R. Alrozi, Chem. Eng. J., 2010, 165, 883–890 CrossRef CAS.
- P. Cakir, S. Inan and Y. Altas, J. Hazard. Mater., 2014, 271, 108–119 CrossRef CAS PubMed.
- A. Murugesan, T. Vidhyadevi, S. S. Kalaivani, K. V. Thiruvengadaravi, L. Ravikumar, C. D. Anuradha and S. Sivanesan, Journal of Water Process Engineering, 2014, 3, 132–143 CrossRef.
- M. Ghaedi and S. N. Kokhdan, Spectrochim. Acta, Part A, 2015, 136, 141–148 CrossRef CAS PubMed.
- R. Cheng, G. Li, C. Cheng, P. Liu, L. Shi, Z. Ma and X. Zheng, Chem. Eng. J., 2014, 252, 150–158 CrossRef CAS.
- J. T. Lai, D. Filla and R. Shea, Macromolecules, 2002, 35, 6754–6756 CrossRef CAS.
- D. Y. Zhao, J. L. Feng, Q. S. Huo, N. Melosh, G. H. Fredrikson, B. F. Chmelka and G. D. Stucky, Science, 1998, 279, 548–552 CrossRef CAS PubMed.
- K. Y. Foo and B. H. Hameed, Chem. Eng. J., 2012, 203, 81–87 CrossRef CAS.
- X. Luo, Z. Deng, X. Lin and C. Zhang, J. Hazard. Mater., 2011, 187, 182–189 CrossRef CAS PubMed.
- M. A. A. Aziz, A. A. Jalil, S. Triwahyono and M. W. A. Saad, Chem. Eng. J., 2015, 260, 757–764 CrossRef CAS.
- J. B. Jentzer, M. Alignan, C. Vaca-Garcia, L. Rigal and G. Vilarem, Food Chem., 2015, 166, 561–567 CrossRef CAS PubMed.
- S. Dai, M. C. Burleigh, Y. Shin, C. C. Morrow, C. E. Barnes and Z. Xue, Angew. Chem., Int. Ed., 1999, 38, 1235–1239 CrossRef CAS.
- M. V. Lombardo, M. Videla, A. Calvo, F. G. Requejo and G. J. A. A. Soler-Illia, J. Hazard. Mater., 2012, 223, 53–62 CrossRef PubMed.
- M. Mourabet, A. El Rhilassi, H. El Boujaady, M. Bennani-Ziatni, R. El Hamri and A. Taitai, J. Saudi Chem. Soc., 2015, 19, 603–615 CrossRef.
- J. N. Sahu, J. Acharya and B. C. Meikap, Bioresour. Technol., 2010, 10, 1974–1982 CrossRef PubMed.
- H. Zhu, Y. Fu, R. Jiang, J. Yao, L. Xiao and G. Zeng, Ind. Eng. Chem. Res., 2014, 53, 4059–4066 CrossRef CAS.
- B. Gao, J. Du and Y. Zhang, Ind. Eng. Chem. Res., 2013, 52, 7651–7659 CrossRef CAS.
| This journal is © The Royal Society of Chemistry 2016 |


