Photodeformable microspheres from an azo molecule containing a 1,4,3,6-dianhydrosorbitol core and cinnamate peripheral groups

Bo Tang, Yuqi Zhou, Zhiyuan Xiong and Xiaogong Wang*
Department of Chemical Engineering, Laboratory of Advanced Materials (MOE), Tsinghua University, Beijing, P. R. China. E-mail: wxg-dce@mail.tsinghua.edu.cn; Fax: +86-10-62770304; Tel: +86-10-62796171

Received 3rd May 2016 , Accepted 29th June 2016

First published on 30th June 2016


Abstract

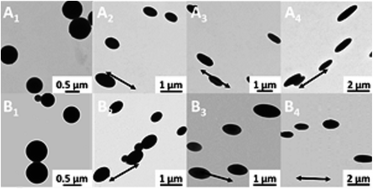
Microspheres formed from an azo molecule containing a 1,4,3,6-dianhydrosorbitol core and cinnamate peripheral groups are fabricated by the solvent-induced self-assembly in an aqueous dispersion. The effect of the initial concentration on the microsphere formation is elucidated by investigations with light scattering and TEM observation. Photoinduced deformation along the light polarization direction is demonstrated for the microspheres in the solid state upon the irradiation with a linearly polarized light. The deformation occurs at a much faster rate compared with that of azo polymer microspheres under the same light irradiation condition.


Azo molecules and polymers can show various photoresponsive properties owing to the transcis photoisomerization of azobenzene moieties, which have been widely investigated in recent years.1–3 Among them, azo polymers have been intensively investigated for their photoresponsive functions and possible applications, such as optical data-storage, surface patterning, liquid crystal elastomer actuators and others.1,2 One of the most interesting photoresponsive properties of azo polymers is photoinduced surface-relief-grating (SRG) formation through mass transport.1d,e,4 Distinct from their high molecular weight counterparts, amorphous molecular materials (also named molecular glass) have recently been developed as a new medium to contain azo chromophores for optical and photonic applications.3 These low-molecular-weight organic compounds, showing glass-transition behaviour similar to amorphous polymers, possess some unique advantages as photoresponsive materials. The azo amorphous molecular materials usually form SRGs with a much faster rate in comparison with those of the azo polymers.3 An azo molecular glass (IAC-4) with the fast SRG-forming characteristics has been synthesized, which contains a core of 1,4,3,6-dianhydrosorbitol moiety and two push–pull type azo chromophores as the inner part.5 The periphery of IAC-4 is functionalized with four cinnamate groups, which can undergo [2 + 2] photo-cycloaddition reaction upon UV light irradiation. Owing to its high efficiency to form SRGs, quasi-crystal surface-relief structures with rotation symmetry as high as 60-fold has been feasibly fabricated on IAC-4 films by using the dual-beam multiple exposure technique.5

Polymer microspheres have been widely explored for different applications.6 More specifically, azo polymer microspheres have been fabricated from polydispersed amphiphilic homopolymers and random copolymers.2d,7 The colloidal spheres are obtained by gradually adding deionized water into the solutions of the polymers in polar organic solvent, such as N,N-dimethylformamide (DMF) and tetrahydrofuran (THF). One unique photoresponsive property of the microspheres is the photoinduced deformation along the polarization direction of the linearly polarized light.7 Upon the light irradiation, the colloidal spheres in the solid state can be significantly stretched along the light polarization direction to give ellipsoidal and rodlike particles.7 Investigations have shown that these self-assembling behaviour and photoresponsive properties are quite general for different amphiphilic azo polymers.2d On the other hand, it is still unclear whether such approach can be used to fabricate photoresponsive microspheres from ordinary azo molecules. The azo molecules with the well-defined structures can be used as a desirable type of materials to gain the deep understanding of the self-assembling mechanism. Moreover, the microspheres fabricated from the azo molecules are expected to possess a much faster deformation rate compared with those of the azo polymer microspheres. However, to our knowledge, no systematic study of this specific topic has been reported yet.

This study investigated self-assembly of IAC-4 to form colloidal spheres in dispersions and their photoinduced deformation behaviour in detail. IAC-4 was selected as a representative azo molecule not only because its fast photoresponsive property, but also because it does not contain typical hydrophilic groups like that existing in a surfactant. As shown by Scheme 1, the assembly was induced by gradually adding deionized water into a solution of IAC-4 in THF. The self-assembling process and aggregates formed in the dispersions were investigated by dynamic light scattering (DLS) and transmission electronic microscopy (TEM). As discussed below, the initial concentration of IAC-4 in THF shows a significant effect on the assembling process. Microspheres with uniform sizes were obtained by this method. When irradiated with a linearly polarized laser beam (488 nm, 100 mW cm−2), the microspheres in solid state are stretched along the polarization direction of the light to give ellipsoidal and rodlike particles. A much faster photo-deformation rate was observed for the microspheres compared with that of azo polymer microspheres.


image file: c6ra11401f-s1.tif
Scheme 1 Self-assembling process of IAC-4 in THF–H2O dispersion and deformation of microspheres induced by irradiation with a linearly polarized laser beam.

The chemical structure of IAC-4 is given in Fig. 1A. The preparation and characterization of IAC-4 have been previously reported,5 which are also described in ESI in details (Fig. S1 and S2). To assemble the microspheres, IAC-4 was firstly dissolved in THF to have an appropriate concentration (typically 0.2–1.0 mg mL−1), then deionized water was dropwise added into the THF solution (1 mL) with an adding rate of 7.2 mL h−1 until a required water content was reached. After reaching the proper water content (such as 67–75 v%), excess deionized water was added to quench the structures formed in the dispersion. The microspheres were finally obtained by slow evaporation of THF under the ambient condition for about 3 days. Fig. 1B–E show the typical TEM images of microspheres formed from the solutions with the initial concentrations of 0.2, 0.5, 0.8, and 1.0 mg mL−1. The initial concentration is an important factor to influence the colloid formation, which will be discussed below in detail. The samples for TEM observations were prepared by dropping the diluted dispersions on copper TEM grids, which were then exposed in the air to evaporate water for 24 h and dried under vacuum at room temperature for 12 h. The formation of microspheres from IAC-4 is confirmed by the TEM observations.8 The sizes of colloidal spheres were characterized with the averaged hydrodynamic radii of colloidal spheres, obtained by the dynamic light scattering (DLS) in diluted dispersions.


image file: c6ra11401f-f1.tif
Fig. 1 (A) The chemical structure of IAC-4. (B)–(E) Typical TEM images of the microspheres formed from IAC-4 by gradually adding deionized water into its THF solution. The initial concentrations of IAC-4 in THF were 0.2 (B), 0.5 (C), 0.8 (D), 1.0 mg mL−1 (E).

In order to understand the formation process of colloidal spheres, the self-assembly processes were studied by the light scattering.9 When water was gradually added into a THF solution to reach a critical concentration, the IAC-4 molecules start to aggregate in the solution, which was reflected by an abrupt increase in the scattered light intensity. The critical water content (CWC) was obtained from the turning-up point on the plots of the scattered light intensity vs. the water content in the medium. Fig. 2 presents the relationship between CWC (v%) and the logarithm of the initial concentration of IAC-4 in the THF solutions (C0). The insert in Fig. 2 shows the typical plot of the scattered light intensity as a function of the water content, which shows CWC of 38.27 v% for the IAC-4 solution with the initial concentration of 0.8 mg mL−1. For cases of amphiphilic block copolymers, homopolymers and random copolymers, there all exist an inversely proportional relationship between CWC and the logarithm of the initial polymer concentration (C0p).7e,10 However, it is interesting to observe that a two-stage variation pattern exists for IAC-4. It reveals a more complicated dependence of the self-assembling behaviour on C0 as discussed below.


image file: c6ra11401f-f2.tif
Fig. 2 Relationship between CWC (v%) and the logarithm of initial concentrations of IAC-4 in the THF solution. Insert: scattered light intensity as a function of the water content for the THF/H2O solutions and dispersions, where the initial concentration of IAC-4 was 0.8 mg mL−1 in the THF solution.

The two-stage variation relationship between CWC and the logarithm of C0 can be well fitted by the following relationship with two sets of parameter A and B,

 
CWC = −A[thin space (1/6-em)]lg[thin space (1/6-em)]C0 + B (1)
where A1 = 0.03185 and B1 = 0.40819 for C0 = 0.1–0.5 mg mL−1 and A2 = 0.16999, B2 = 0.36631 for C0 = 0.5–0.9 mg mL−1. It means that for C0 = 0.1–0.5 mg mL−1, CWC is weakly correlated with the initial concentration of IAC-4 in the THF solutions. In each linear variation range, by replacing CWC with the water content Cw, eqn (1) can also be used to describe the relationship between Cw and the concentration of unassociated molecules.10
 
Cw = −A[thin space (1/6-em)]lg[thin space (1/6-em)]Cunass + B (2)

Therefore, the following equation can be obtained from eqn (1) and (2),

 
Cunass/C0 = exp[−2.303(Cw − CWC)/A] (3)
where Cw represents the water content (v%) in the solution and Cunass (mg mL−1) is the concentration of the unassociated IAC-4 molecules in the solution.10 Distinct from the polymer systems, the parameter A takes the values of A1 and A2 when C0 in the different ranges. The results obtained from two typical concentrations C0 = 0.2 and 0.8 mg mL−1 are used to further discuss this relationship. For C0 = 0.2 mg mL−1, the corresponding CWC is 43.18 v%. In this case, when Cw reaches 50 v%, the ratio Cunass/C0 is calculated to be 7.2 × 10⁻³, which means that the IAC-4 molecules in the solution almost completely aggregate. On the other hand, for the case C0 = 0.8 (CWC = 38.27 v%), there are two assembling stages in the process. When Cw increases from 38.27 v% to 41.77 v%, Cunass decreases from 0.8 to 0.5 mg mL−1, where the variation follows the eqn (3) with A = A2. When Cw further increases and Cunass is reduced to a value below 0.5 mg mL−1, A = A1 should be used in eqn (3). It means that in the range for Cunass to decrease from 0.5 to 0.1 mg mL−1, the aggregation is more sensitive with the water content increase. When the Cw reaches 50 v%, Cunass/C0 is calculated to be 2.6 × 10⁻³. It means that although CWC is closely related with C0, especially when C0 is high (>0.5 mg mL−1), Cunass/C0 is mainly determined by Cw.

Hydrodynamic radii (Rh) of the aggregates formed in the THF–H2O media were obtained by the dynamic light scattering (DLS).9 Fig. 3A and B show the Rh distributions of aggregates varying with the Cw increase for C0 = 0.8 and 0.2 mg mL−1, respectively. For both cases, Rh of the aggregates first increases and then decreases as the Cw increases. This variation tendency can be more clearly seen from Fig. 3C (Table S1 in ESI) for the average hydrodynamic radius (〈Rh〉). For C0 = 0.8 mg mL−1, 〈Rh〉 undergoes a significant increase when Cw increases from 40 v% to 50 v%. Then, it decreases following the further increase of Cw from 50 v% to 75 v%. On the other hand, for C0 = 0.2, 〈Rh〉 shows the increase as Cw increases until it reaches about 60 v%, and then 〈Rh〉 decrease as Cw further increases. This first increasing and then decreasing variation of 〈Rh〉 reflects the aggregate/collapse process with the increasing water content, which is similar to those observed for the assembly of polymers through the similar preparation method.7d,e,10b


image file: c6ra11401f-f3.tif
Fig. 3 (A) The variation of Rh and its distribution with the water content, C0 = 0.8; (B) the variation of Rh and its distribution with the water content, C0 = 0.2; (C) the relationship between 〈Rh〉 of the aggregates and the water content for C0 = 0.2 and 0.8 mg mL−1; (D) the Rh and its distribution of aggregates formed when C0 = 0.8 mg mL−1 and Cw = 40 v%; (E) the Rh and its distribution for colloidal spheres formed from different initial IAC-4 concentrations; (F) the relationship between 〈Rh〉 of colloidal spheres and the initial concentration (C0).

The difference caused by the varied initial concentration (C0) can be rationalized by DLS analysis and calculation with eqn (3). For C0 = 0.8 mg mL−1, Cunass/C0 undergoes a two-stage decrease with the Cw increase. When Cw reaches 40 v% (Cw − CWC = 1.73 v%), there exist two kinds of particles with 〈Rh〉 = 425.5 nm (42.6%) and 〈Rh〉 = 1.2 nm (57.4%) (Fig. 3D). It means that the formation of new nuclei and the quick growth from the formed nuclei simultaneously occur as the water content is slightly higher than CWC. When Cunass reaches 0.5 mg mL−1 (Cw = 41.77 v%), Cunass/C0 decreases much more quickly with the Cw increase because A1 (≪A2) should be used in eqn (3). When Cw reaches 50 v%, Cunass/C0 is reduced to 2.6 × 10⁻³, which means that the IAC-4 molecules are almost completely associated. As shown in Fig. 3C, the formed aggregates start to collapse as Cw further increases. On the other hand, for C0 = 0.2 mg mL−1, Cunass/C0 undergoes a single declining process with the Cw increase. When Cw reaches 50 v%, the ratio Cunass/C0 is reduced to 7.2 × 10⁻³. For the low initial concentration (such as C0 = 0.2 mg mL−1), the difference between this Cw (50 v%) and CWC (43.18 v%) is small, and 〈Rh〉 is significantly smaller at this state compared with the 〈Rh〉 for C0 = 0.8 mg mL−1 at the same Cw (Fig. 3C). Therefore, as Cw further increases, 〈Rh〉 of the aggregates keeps the increase with the increasing water content, owing to the aggregation of these small particles. The 〈Rh〉 maximum appears at Cw about 60 v% and also the aggregates possess a looser structure in the intermediate stage (Fig. 3C, Table S1 in ESI).

When Cw reached 75 v%, the excess deionized water was added to quench the structures formed in the dispersion. The effects of C0 can also be seen from the sizes of the microspheres finally obtained from the dispersions after adding excess water. The 〈Rh〉 obtained with higher C0 (larger than 0.5 mg mL−1) is smaller compared with that obtained with the low initial concentration (C0 = 0.2 mg mL−1) (Fig. 3E and F and Table S2 in ESI).

The photoinduced deformation of the microspheres in the solid state was investigated upon the irradiation with a linearly polarized laser beam (488 nm, 100 mW cm−2). Fig. 4A and B present typical TEM images of the microspheres upon the irradiation for different time periods. The microspheres were fabricated from IAC-4 solutions with C0 = 0.2 and 0.8 mg mL−1 by firstly dropwise adding 2 mL water into the solutions (1 mL) and then adding excess water (20 mL) to quench the structures formed in the dispersion. The samples were obtained by dropped the dispersions on TEM copper grids and dried under appropriate conditions. The microspheres were irradiated with the linearly polarized laser beam incident perpendicular to the sample surface for different time periods. Fig. 4A1 to A4 and B1 to B4 show corresponding images for C0 = 0.2 and 0.8 mg mL−1 after irradiated for 0, 1, 3, 6 min. Fig. S3–S5 (in ESI) show the images of microspheres after irradiated for 10 min and for 1, 2, 3, 4, 5, 6, 7, 8, 9, 10 min. It can be seen that the microspheres are gradually stretched along the polarization direction of the light. Fig. 4C provides the variation of average axial ratios (l/d) with the irradiated time, which was estimated statistically from TEM images of 50 particles. The average axial ratios (l/d) reaches about 1.5 in 1 min and continuously increase with the time increase. It can be seen that l/d increases faster for the microspheres obtained from the solution with C0 = 0.2 mg mL−1 compared with that obtained from the solution with C0 = 0.8 mg mL−1. The l/d value for the former can reach about 4.6 after 10 min irradiation. When the irradiation time increases to 10 min, the microspheres become rod-like particles.


image file: c6ra11401f-f4.tif
Fig. 4 (A) and (B) Typical TEM images of microspheres respectively formed from solutions with the concentrations of 0.2 and 0.8 mg mL−1, irradiated with a linearly polarized laser beam (488 nm, 100 mW cm−2) for 0, 1, 3, 6 min, (C) the relationship between the average axial ratios (l/d) and irradiated time. The result of an epoxy-based azo polymer (CH-AZ-CA) is given here for the comparison.7e

Fig. 4C also compares the results with the corresponding l/d of one epoxy-based polymer with the fast deformation rate, which has been reported previously.7e The microspheres obtained from IAC-4 show a much faster deformation rate compared with that of the azo polymer microspheres, which is more obvious for the microspheres obtained from the solution with C0 = 0.2 mg mL−1. The photoinduced deformation is temporally stable and is irreversible under conventional light irradiation condition. Although the cinnamate groups are insensitive to the visible light, photoreversible covalent bonding through [2 + 2] photo-cycloaddition reaction could be achieved when exposed to UV light with the wavelength λ > 260 nm or <260 nm.11 By exploiting the reversible [2 + 2] photo-cycloaddition reaction upon UV-light irradiation, it is possible to endow the microspheres with other photoresponsive functions.

In summary, uniform microspheres were obtained from an azo molecule containing 1,4,3,6-dianhydrosorbitol core and cinnamate peripheral groups (IAC-4) through self-assembly in aqueous media. When C0 is higher or lower than 0.5 mg mL−1, the linear relationships between CWC and the logarithm of C0 have different slopes. When C0 is lower than 0.5 mg mL−1, the aggregation of IAC-4 molecules is more sensitive to the water content increase. The initial concentration of IAC-4 in the THF solution affects both the self-assembling process and the photoresponsive behaviour of the microspheres. The microspheres of IAC-4 show a much faster deformation rates compared with that of azo polymers when irradiated with the linearly polarized light.

Acknowledgements

The financial support from NSFC under Projects 51233002 is gratefully acknowledged.

Notes and references

  1. (a) G. S. Kumar and D. C. Neckers, Chem. Rev., 1989, 89, 1915–1925 CrossRef CAS; (b) S. Xie, A. Natansohn and P. Rochon, Chem. Mater., 1993, 5, 403–411 CrossRef CAS; (c) J. A. Delaire and K. Nakatani, Chem. Rev., 2000, 100, 1817–1845 CrossRef CAS PubMed; (d) A. Natansohn and P. Rochon, Chem. Rev., 2002, 102, 4139–4175 CrossRef CAS PubMed; (e) N. K. Viswanathan, D. Y. Kim, S. P. Bian, J. Williams, W. Liu, L. Li, L. Samuelson, J. Kumar and S. K. Tripathy, J. Mater. Chem., 1999, 9, 1941–1955 RSC.
  2. (a) T. Ikeda, J. I. Mamiya and Y. L. Yu, Angew. Chem., Int. Ed., 2007, 46, 506–528 CrossRef CAS PubMed; (b) Y. Zhao, Macromolecules, 2012, 45, 3647–3657 CrossRef CAS; (c) S. Lee, H. S. Kang and J. k. Park, Adv. Mater., 2012, 24, 2069–2103 CrossRef CAS PubMed; (d) D. R. Wang and X. G. Wang, Prog. Polym. Sci., 2013, 38, 271–301 CrossRef CAS; (e) H. F. Yu, J. Mater. Chem. C, 2014, 2, 3047–3054 RSC.
  3. (a) H. Nakano, T. Takahashi, T. Kadota and Y. Shirota, Adv. Mater., 2002, 14, 1157–1159 CrossRef CAS; (b) E. Ishow, C. Bellaïche, L. Bouteiller, K. Nakatani and J. A. Delaire, J. Am. Chem. Soc., 2003, 125, 15744–15745 CrossRef CAS PubMed; (c) M. J. Kim, E. M. Seo, D. J. Vak and D. Y. Kim, Chem. Mater., 2003, 15, 4021–4027 CrossRef CAS.
  4. (a) P. Rochon, E. Batalla and A. Natansohn, Appl. Phys. Lett., 1995, 66, 136–138 CrossRef CAS; (b) D. Y. Kim, S. K. Tripathy, L. Li and J. Kumar, Appl. Phys. Lett., 1995, 66, 1166–1168 CrossRef CAS.
  5. M. C. Guo, Z. D. Xu and X. G. Wang, Langmuir, 2008, 24, 2740–2745 CrossRef CAS PubMed.
  6. H. Kawaguchi, Prog. Polym. Sci., 2000, 25, 1171–1210 CrossRef CAS.
  7. (a) Y. B. Li, Y. N. He, X. L. Tong and X. G. Wang, J. Am. Chem. Soc., 2005, 127, 2402–2403 CrossRef CAS PubMed; (b) Y. B. Li, Y. N. He, X. L. Tong and X. G. Wang, Langmuir, 2006, 22, 2288–2291 CrossRef CAS PubMed; (c) R. H. Lambeth and J. S. Moore, Macromolecules, 2007, 40, 1838–1842 CrossRef CAS; (d) N. Li, G. Ye, Y. N. He and X. G. Wang, Chem. Commun., 2011, 47, 4757–4759 RSC; (e) Y. Q. Zhou, B. Tang and X. G. Wang, Polymer, 2015, 60, 292–301 CrossRef CAS.
  8. A JEOL-JEM-1200EX transmission electron microscope with the acceleration voltage of 80 kV was used to observe the colloidal spheres and their deformation.
  9. Laser light scattering experiments were performed on a commercial LS instrument (ALV/DLS/SLS-5022F).
  10. (a) L. F. Zhang, H. W. Shen and A. Eisenberg, Macromolecules, 1997, 30, 1001–1011 CrossRef CAS; (b) Y. H. Deng, Y. B. Li and X. G. Wang, Macromolecules, 2006, 39, 6590–6598 CrossRef CAS.
  11. (a) A. Lendlein, H. Jiang, O. Jünger and R. Langer, Nature, 2005, 434, 879–882 CrossRef CAS PubMed; (b) H. Jiang, S. Kelch and A. Lendlein, Adv. Mater., 2006, 18, 1471–1475 CrossRef CAS.

Footnote

Electronic supplementary information (ESI) available: Further experimental details and characterization results. See DOI: 10.1039/c6ra11401f

This journal is © The Royal Society of Chemistry 2016
Click here to see how this site uses Cookies. View our privacy policy here.