DOI:
10.1039/C6RA10549A
(Paper)
RSC Adv., 2016,
6, 60633-60642
The effect of spermine on the structure, thermal stability and activity of bovine pancreatic trypsin
Received
23rd April 2016
, Accepted 16th June 2016
First published on 17th June 2016
Abstract
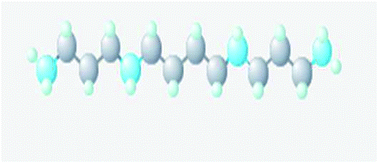
This work studied the interaction between spermine and trypsin at pH 8.0. The thermal stability of trypsin was investigated in the presence of spermine over a temperature range (from 293 K to 353 K). Additionally, the conformational change of trypsin induced by spermine was analyzed by UV-vis absorption and fluorescence spectra. The effect of spermine on trypsin activity was studied at 37 °C and pH 8.0, using Tris–HCl as a buffer. The fluorescence spectroscopy results indicated that the binding of spermine to trypsin was a spontaneous binding process. The fluorescence of trypsin was quenched by spermine through the static quenching mechanism. By increasing the concentration of spermine, the thermal stability of trypsin was increased. The quantitative analysis of CD spectra revealed some information regarding the changes in the content of the α-helix and the β-sheet of the trypsin upon binding to spermine. It was also found that by increasing the concentration of spermine, the activity of trypsin was increased. Molecular docking results also revealed the presence of one binding site with a negative value for the Gibbs free energy of the binding of spermine to trypsin. Further, the docking and fluorescence spectroscopy study revealed that van der Waals interactions and hydrogen bonds played a major role in stabilizing the complex. As a result, spermine could be considered as an activator and stabilizer for trypsin.
1. Introduction
Thermodynamic stability of a globular protein is a balance between stabilizing and destabilizing forces resulting from non-covalent interactions.1 Foretelling and controlling the behavior of proteins in biochemical and biomedical applications need a good knowledge of the relationship between physical characteristics including function, structure, thermo stability and dynamics.1
Spermine is an organic compound having four amino groups (–NH2). Scheme 1 shows the structure of spermine. It has many applications in chemical industry.2 Polyamines participate in biological functions, including DNA replication, transcription, protein synthesis, 30 s ribosomal subunits assembly and formation of Ile-tRNA, cell growth, differentiation, proliferation and viability.3–5 Spermine (1,12-diamino-4,9-diazadodecane) is a low molecular weight polyamine often present in food, inducing the maturation of small intestine mucosa, pancreas, liver, and spleen when orally ingested by sucking rodents.6–9
 |
| Scheme 1 | |
Natural polyamines, due to their cationic nature, interact with polyanionic molecules including DNA, RNA, phospholipids and proteins.10 They induce structural changes in them. Thermophile polyamines play a biophysical role in the adjustment of hyperthermophilic proteins to high temperature environments. Also, it has been reported that polyamines bind to negatively charged biomolecules by electrostatic interactions.11 The hydrophobicity of the polyamines contributes to their positive charge, which is another significant factor regulating their interaction with other macromolecules.
Bovine pancreas trypsin (EC: 3.4.21.4) is a prototype of the serine endopeptidase of S1 family that consists of a polypeptide chain in which two β-barrel domains are bridged by the catalytic residues.12 Trypsin strongly prefers to cleave amide substrates following the carboxylic group of arginine or lysine residues.13 Trypsin is an important digestive proteinase expelled by the pancreas into duodenum.14 Trypsin is a globular protein with a medium size and 223 amino acid residues.15 Enzyme has two domains, each of which consists of 6 anti-parallel polypeptide chains. Anti-parallel β-sheets are connected to each other by hydrogen bonds. Also, it has 6 disulfide bonds; therefore, its structure is stable. Trypsin has 4 tryptophans and 5 tyrosine residues.13,16
The purpose of this work was to investigate the effects of spermine, as a natural polyamine, on the structure, stability and activity of trypsin at pH 8.0. Changes in the secondary and tertiary structures of trypsin were monitored by far and near-UV circular dichroism (CD) and the intensity of fluorescence spectroscopy measurements. It should be noted in modern medicinal chemistry, many diseases have a relationship to the disordering of their regulation.
2. Materials and methods
2.1 Materials
Trypsin from bovine pancreas (T8003, MW 23300 Da, pI 11–11.4) was purchased from Sigma Co., dissolved in Tris–HCl buffer solutions at pH 8.0, and stored at less than 4 °C. BAEE (Nα-benzoyl-L-arginine ethyl esters, B4500) was dissolved in a Tris–HCl buffer at pH 8.0; spermine tetra hydrochloride (S-2876) was suspended in deionized water and used in different concentrations. The required solutions were prepared freshly and used immediately.
2.2 UV-vis spectroscopy
Spectrophotometry measurements were obtained by a Pharmacia 4000 UV-vis Spectrophotometer (Japan) equipped with 10 mm quarts cell. The spectra's absorption of the enzyme was measured to be between 250 and 400 nm against the buffer by spectrophotometry. The concentration of trypsin was 0.1 mg mL−1 according to the Lambert–Beer law.17 Absorbance value changes were recorded at 280 nm. All studies were carried out in quartz cells containing 0.1 mg mL−1 trypsin and different concentrations of spermine solution.
2.3 Thermal stability of trypsin
The UV-vis spectrum of bovine trypsin was studied at 280 nm wavelength by UV-vis Spectrophotometer Pharmacia 4000 in the presence of various concentrations of spermine. All studies were carried out in 10 mm quarts cells containing 0.1 mg mL−1 trypsin and different concentrations of spermine solutions. The temperature range of 293–353 K (20–80 °C) was scanned with a scan rate of 1 K min−1.
2.4 Fluorescence spectra assay
Spectra of fluorescence were recorded on a Shimadzu RF 5301 Fluorescence Spectrophotometer (Japan) equipped with a temperature controller. A 10 mm quartz cell was used for these studies. The samples were prepared by incubating a solution of 0.1 mg mL−1 trypsin with different concentrations of spermine for 10 min at 298 and 308 K. The width of excitation and emission slit was set at 3.0 and 5.0 nm, respectively. The excitation wavelength was 280 nm with the emission range of 290–450 nm.18 The fluorescence emission spectra of native trypsin and trypsin–spermine mixtures were measured at the 50 mM Tris–HCl buffer and pH 8.0.
2.5 CD measurements
Circular dichroism (CD) spectra in near-UV regions (260–320 nm) and far-UV regions (190–260) of trypsin in the absence and presence of spermine were investigated by an AVIV 215 spectropolarimeter (USA) at 298 K. The path length of the cells in far-UV and near-UV experiment was 1 mm and 10 mm, respectively. Enzyme concentration was adjusted to 0.8 mg mL−1 in the far-UV experiments and 1.6 mg mL−1 in the near-UV experiments. By means of the CDNN program, version 2.1.0.223, the percentages of the secondary structure of trypsin were calculated using a network trained with 33 complex spectra at the reference set. The data were represented by mean-residue ellipticity (mean-residue ellipticity [θ]MR deg cm2 dmol−1).
2.6 Assay of enzyme activity
The estrolytic activity of the native and spermine–trypsin complex was determined at 310 K in the 50 mM Tris–HCl buffer (pH 8.0) via differences between the spectra of BAEE as the substrate and the carboxylate form N-benzoyl-L-arginine. One unit of estrolytic activity was recounted as the amount of enzyme hydrolysing 1.0 μmol of BAEE per minute at 310 K. The increase in absorbance at 253 nm was pursued in a mixture containing the 50 mM Tris–HCl buffer at pH 8.0 and 1 mM BAEE. The optimum temperature and pH for the activity of trypsin were 37 °C and 8, respectively.
2.7 Molecular docking studies
In this study, the trypsin structures (ID code 2PTN) were obtained from RCSB Protein Data Bank (http://www.rcsb.org); they had been solved at the resolutions of 1.55° A.15 The water and nonprotein molecules in the PDB files were removed. In the present study, we chose spermine as a ligand. The structure of spermine was drawn using the quantum chemistry software Gauss view 5.0 (Fig. 1).19 In order to get the most stable spermine conformations, the structure-optimizing calculation was carried out at the 6-31G** level by employing the Becke three-parameter Lee–Yang–Parr (B3LYP) hybrid density functional theory, and the structures with the lowest energy were selected for the following docking study. Docking simulations were carried out with the prepared ligands. Molecular docking of trypsin and spermine model was carried out using the AutoDock 4.0 software package.20 All the torsion angles in the small-molecules were set free to perform flexible docking. Polar hydrogen was added by using the hydrogen module in AutoDock Tools (ADT) for spermine. After that, Kollman united atom partial charges were assigned for the protein trypsin. The empirical free energy function and Lamarckian genetic algorithm (LGA) were used for docking with the following settings: a maximum number of 25
000
000 energy evaluations, an initial population of 150 randomly placed individuals, a maximum number of 27
000 generations, a mutation rate of 0.02, a crossover rate of 0.80, and an elitism value of 1. For the local search, the so-called Solis and Wets algorithm was applied with a maximum of 1000 iterations per search. The results were clustered according to the root-mean-square deviation (RMSD) criterion. The best docked conformations of spermine were selected as the initial active/binding conformations to evaluate the potential correlations between the experimental activities and the predicted log
Ki values. The thousand docking conformations for trypsin and spermine were divided into groups according to a 0–1.96 Å RMSD criterions, using the Cluster module in ADT. To validate the docking protocol, bound ligand polyamine (spermine) coordinates in the crystal complex were removed and the bond orders were checked. For docking calculations, Gasteiger partial charges were assigned to the tested derivatives and polyamine (spermine) and non-polar hydrogen atoms were merged. All torsions were allowed to rotate during docking. The program AutoGrid was used to generate the grid maps. Each grid was centered at the crystal structure of the corresponding trypsin bound ligand polyamine (spermine). The grid dimensions were 87 × 87 × 87 Å, with points separated by 10 Å. For all ligands, random starting positions, random orientations and torsions were used. The translation, quaternion and torsion steps were taken from default values in AutoDock. The Lamarckian genetic algorithm and the pseudo-Solis and Wets methods were applied for minimization using the default parameters. The standard docking protocol for rigid and flexible ligand docking consisted of 10 independent runs per ligand, using an initial population of 50 randomly placed individuals, with 2.5 × 10⁶ energy evaluations, a maximum number of 27
000 iterations, a mutation rate of 0.02, a crossover rate of 0.80 and an elitism value of 1. The probability of performing a local search on an individual in the population was 0.06, using a maximum of 300 iterations per local search. After docking, the 1000 solutions were clustered into groups with RMSD deviations lower than 2.0 Å. Docking energy in the largest cluster was selected as the representative binding pose.
 |
| Fig. 1 Structure of spermine. | |
3. Results and discussion
3.1 UV-vis spectrophotometry
The UV-vis absorption spectrum can be generally utilized to determine the structural change of biomacromolecules. The results from UV-vis absorption spectra can provide useful information about the interaction between protein and other molecules to determine the protein conformational change. In this research, UV spectra of trypsin were investigated to discover the effect of different concentrations of spermine. As shown in Fig. 2, there was a weak peak at 278 nm that was related to the absorption of aromatic amino acids (Phe, Trp and Tyr), thereby indicating the change of the microenvironment of the chromophore.18,21 As described in Fig. 2, with the increase of the spermine concentration, the absorption intensity of trypsin in the 278 nm absorption band was increased weakly, but the peak position of absorption spectra remained unchanged. This suggested that spermine could lead to the alteration in the environment of Trp because of the formation of the ground state complex.22,23 It is probable that trypsin–spermine complexes have a higher extinction coefficient than the unabsorbed state, but they have the absorption maximum at the same position, i.e. 278 nm.24,25 When the distance between trypsin and spermine is short enough, the hydrogen bond will be formed between spermine and the polar side chain of amino acid residues. Thus, the combination of hydrogen bonds led to the fixed binding of trypsin on spermine. In the presence of spermine, the absorbance of trypsin was increased markedly, without any change in the wavelength of peak at 278 nm. Spermine could cause the microenvironmental alteration of Trp, which was consistent with the results of fluorescence measurements. Also, the change of this peak revealed that the quenching mechanisms were mainly done by a static quenching process.26 Presumably, as a result of spermine binding to the enzyme, trypsin conformation and tryptophan surrounding were changed and the hydrophobicity in the microenvironment of tryptophan residues was decreased.
 |
| Fig. 2 Absorbance trypsin–spermine complex at pH 8.0 and 310 K. | |
3.2 Fluorescence spectroscopy
Intrinsic fluorescence of the enzyme was done in the presence of different concentrations of spermine in order to manifest the forces involved in the inactivation or activation of the trypsin via spermine. Fluorescence is a useful and accurate method which has been widely utilized to survey the interaction between proteins and small molecules.22,27 The luminescence behavior of proteins must be reflecting the effects of the secondary and tertiary structure on the fluorogenic amino acids. The difference in the environment of the aromatic residues is responsible for this effect.16
The aromatic amino acid residues have an intrinsic fluorescent property. Any process that reduces the fluorescence intensity of a sample is called quenching of fluorescence. A variety of molecular interactions can cause quenching. These include molecular rearrangement, excited-state reactions, energy transfer, dynamic quenching (collisional quenching) and static quenching (ground-state complex formation).14,28,29
It is already known that trypsin has four tryptophan residues: Trp 51, Trp 141, Trp 215 and Trp 237. Cysteine is a stronger quencher than tryptophan in fluorescence spectroscopy. Tryptophan close to cysteine cannot significantly participate in the fluorescence emission. Only Trp 51, because of being relatively away from cysteine residues, can be involved in the overall fluorescence emission.15,30 The fluorescence emission spectra analyses of tryptophans of trypsin have shown the changes in their structure and dynamics. It is frequently important in the protein folding and related reactions.15,31
Fig. 3 and 4 display the fluorescence spectra of trypsin in the absence or presence of different concentrations of spermine at 298 K and 308 K. Excitation wavelength was 280 nm and the emission wavelength was in the range of 290–450 nm.18 As shown in Fig. 3 and 4, the native trypsin (pH 8.0, 298 and 308 K) had an emission maximum at 332 nm and different concentrations of spermine. It was also found that the fluorescence intensity of trypsin was quenched by the addition of spermine concentrations to the trypsin solution, showing that spermine interacted with trypsin and particularly, tryptophan of trypsin had been partly exposed to the solvent.32 In the hydrophilic environment (exposed to solvent), their quantum yields were decreased, leading to low fluorescence intensity. The reduction in the fluorescence intensity of trypsin was higher at 308 K.
 |
| Fig. 3 Fluorescence quenching of trypsin, λexi = 278 nm and λemi = 290–450, in the presence of different concentrations of spermine (0–10 mM) at pH 8.0 and 298 K. | |
 |
| Fig. 4 Fluorescence quenching of trypsin, λexi = 278 nm and λemi = 290–450, in the presence of different concentrations of spermine (0–10 mM) at pH 8.0 and 308 K. | |
Making a stable bimolecular complex causes quenching. In order to confirm the quenching mechanism, the data of fluorescence quenching could be analyzed according to the Stern–Volmer equation:26,33–36
|
F0/F = 1 + Kqτ0[Q] = 1 + Ksv[Q]
| (1) |
F0 and F characterize the fluorescence intensities in the absence and presence of spermine, respectively. Kq, τ0, [Q] and Ksv are the bimolecular quenching constant, the average lifetime of trypsin without quencher, the concentration of the quencher and the Stern–Volmer quenching constant, respectively. Previous studies have determined that the lifetime of fluorophore (tryptophan) in trypsin is 10−8 s.26,37 Usually, the maximum collision quenching constant of different kinds of quenching with the biopolymer is 2.0 × 10¹⁰ L mol−1 s−1.26 Fluorescence quenching processes can be explained by two main mechanisms: (i) static quenching, and (ii) dynamic fluorescence quenching. Static quenching includes a more long-lasting formation of a complex between the quencher and fluorophore, which is sometimes referred to as a dark complex. Dynamic quenching involves collision between the two molecules with the fluor losing energy as the kinetic energy.38
The Ksv values were reduced with the increase in temperature, suggesting that the quenching was initiated from the formation of a complex. When the fluorophore is unavailable to the quencher and fluorophore is buried inside the protein, static quenching occurs.33 It was also found that there was a linear relationship between F0/F and various concentrations of spermine. The binding constants of spermine with trypsin were obtained from the Stern–Volmer method, as listed in Table 1. The Kq, the quenching rate constant, was greater than 2.0 × 10¹⁰ L mol−1 s−1. This also indicated that the quenching of trypsin fluorescence by spermine was initiated from static quenching, not from dynamic quenching (Fig. 5).
Table 1 Stern–Volmer quenching constants of the complex of trypsin–spermine at pH 8.0
T (K) |
Ksv (× 108 L mol−1) |
Kq (× 1016 L mol−1 s−1) |
Ra |
The correlation coefficient. |
298 |
4.18 |
4.18 |
0.9967 |
308 |
4.79 |
4.79 |
0.9959 |
 |
| Fig. 5 Stern–Volmer plots for the quenching of trypsin by spermine at two temperatures of 298 K (■) and 308 K (●), λexi = 278 nm and λemi = 290–450 nm, and pH 8.0. | |
3.3 Determination of binding constant and binding capacity
As noted above, fluorescence measurements indicated that fluorescence quenching of Trp during the interaction between trypsin and spermine followed a static quenching model. Hence, various binding parameters of trypsin complex to spermine were analyzed. It is possible to compute the binding constant (KA) and binding number (n) based on the following equation: |
log[(F0 − F)/F] = log KA + n log[Q]
| (2) |
The curve of double logarithm regression of log(F0 − F)/F versus log[Q] for trypsin–spermine complex at different temperatures has been shown in Fig. 6. The binding constants (KA) and binding sites (n) have also been listed in Table 2. According to eqn (2), the slope of the plot of the static quenching of log[(F0 − F)/F] vs. log[Q] reflects the binding number.33 It could be seen that the values of KA were decreased with the increase of temperature. Therefore, the binding is an exothermic reaction that is in agreement with Ksv, as mentioned above. Hence, the results indicated the spermine–trypsin complex was not easily formed with increasing the temperature, and the formed complex could be unsteady and would be dissociated with the rising temperature. The values of n were close to 1 at the experimental temperature, indicating that trypsin had one binding site for spermine.
 |
| Fig. 6 The plot of log[(F0 − F)/F] vs. log[Q] at two temperatures of 298 K (■) and 308 K (●) for trypsin with spermine, λexi = 278 nm and λemi = 290–450 nm, and pH 8.0. | |
Table 2 Thermodynamic parameters of trypsin–spermine interaction at pH 8.0
T (K) |
KA (L mol−1) |
n |
Ra |
ΔH° (kJ mol−1) |
ΔG° (kJ mol−1) |
ΔS° (J mol−1 K−1) |
The correlation coefficient. |
298 |
8.4 × 10⁷ |
1.03 |
0.993 |
−11.4 |
−45.2 |
−11294.7 |
308 |
7.2 × 10⁷ |
1.03 |
0.994 |
−11.4 |
−46.3 |
−11295.9 |
3.4 Calculation of thermodynamic parameters
Four types of noncovalent interactions play a major role in the binding of ligand to protein: hydrogen bond, van der Waals-london, electrostatic, and hydrophobic interactions.28 Some thermodynamic parameters like standard enthalpy change (ΔH°), standard entropy change (ΔS°) and Gibbs free energy change (ΔG°) of binding reaction are the functions of temperature and can be regarded as the basic criteria confirming the binding model. Therefore, these parameters were calculated from the van't Hoff equation:14,39 |
 | (3) |
|
ΔG° = −RT ln KA
| (4) |
|
 | (5) |
where K is the constant of the binding obtained from eqn (2), T is the temperature, and R is the gas constant. As can be seen in Table 2, the negative value of ΔG° showed that the binding of trypsin to spermine was spontaneous. ΔS° and ΔH° were the negative values. Ross and Subramanian40 have characterized the positive ΔH° and ΔS° values as evidence showing hydrophobic interaction, while negative ΔS° and ΔH° were associated with van der Waals and hydrogen bonding. Eventually, very low negative or positive ΔH° and positive ΔS° values could be described by electrostatic interactions. Therefore, according to the calculated parameters, it could be concluded that the intermolecular forces in the formation of trypsin–spermine complex were the van der Waals force and hydrogen bonding force.
3.5 Thermal stability
The irreversible unfolding due to the heat of trypsin occurred with a Tm of 318 K. Thermal stability of trypsin in the absence and presence of different concentrations of spermine was studied at pH 8.0 by spectrophotometer. After normalizing the absorbance of the native and denatured molecules of trypsin, Tm of enzyme was obtained. The fraction of the denatured protein, Fd, was calculated using the relation:24,39,41 |
Fd = (Yobs − YN)/(YD − YN)
| (6) |
where YD and YN refer to the absorbance of the denatured and native molecules and Yobs is the absorbance of enzyme at temperature T (°C). Denaturation curves of trypsin in the absence and presence of spermine are shown in Fig. 7. As shown, by increasing the concentration of spermine, the curves were shifted to left, revealing the more stability of trypsin. Thermal denaturation of globular proteins approached a two-state mechanism.42 According to this mechanism, the difference in free energy between the folded and unfolded conformation, ΔG°, can be calculated by:39,41 |
ΔG° = −RT ln[Fd/(1 − Fd)] = −RT ln[(Yobs − YN)/(YD − Yobs)]
| (7) |
where T is the absolute temperature and R is the constant of gas. The free energy of denaturation, ΔG°, as a function of temperature for trypsin in the absence and presence of spermine at pH 8.0, is shown in Fig. 8. As can be seen, Tm and stability of trypsin were increased with raising the concentration of spermine. It could also be seen that spermine was effective in the stability of trypsin because it could increase Tm of trypsin. The stabilizing effect of spermine could be mediated by its impact on the solvent structure and polyamines were found to cause a slight increase in surface tension of the buffer, indicating a subtle kosmotropic effect.5 Kumar and Venkatesu have also shown that polyamines enhance Tm of chymotrypsin.43
 |
| Fig. 7 Thermal denaturation curves of trypsin in the presence of different concentrations of spermine (♦, 0 mM; ■, 1 mM; ▲, 2 mM; ×3 mM, ● 4 mM) at pH 8.0. | |
 |
| Fig. 8 The effect of different concentrations of spermine (♦, 0 mM; ■, 1 mM; ▲, 2 mM; ×3 mM, ● 4 mM) on ΔG° at different temperatures and pH 8.0. | |
3.6 Catalytic properties
It could be observed from Fig. 9 that the activity of trypsin was enhanced with increasing the concentration of spermine. Table 3 reports the catalytic parameters of the trypsin and spermine–trypsin mixture. The double reciprocal plot for trypsin in the absence and presence of spermine is presented in Fig. 9 (the double reciprocal plot of line weaver-Burk).44,45 As illustrated in Fig. 9, as the concentration of spermine was increased, the rate of trypsin (Vmax) was increased. The affinity of the trypsin for BAEE was decreased with adding the spermine (Km was increased). The term kcat/Km refers to the catalytic efficiency and a high value shows that the limiting factor for the overall reaction is the frequency of collisions of trypsin with BAEE molecules. These results suggested that by the attachment of spermine to trypsin, the high affinity sites like cationic lysine and arginine were exposed on the surface of trypsin, thereby decreasing the concentration of BAEE in the active site of trypsin. According to the results, it was found that Tm of trypsin and enzyme activity was increased with the addition of spermine concentrations. Overall, the binding of spermine could change the micro-environment of the catalytic triad for the intruding molecules in their vicinity. Consequently, spermine could influence the enzyme activity. As a result, spermine could be regarded as an activator and stabilizer for trypsin. Kumar and Venkatesu have also suggested that polyamines are good enhancers for the native conformation of chymotrypsin.43
 |
| Fig. 9 Line weaver–Burk plot of trypsin at various spermine concentrations (♦, 0 mM; ■, 1 mM; ●, 3 mM; ▲,5 mM) at 310 K, and pH 8.0. | |
Table 3 The kinetic values of trypsin at various concentrations of spermine
Concentration (mM) |
kcat × 103 (s−1) |
Km (mM) |
kcat/Km (mM−1 s−1) |
0 |
3.1 |
0.9 |
3.5 × 10³ |
1 |
3.8 |
1 |
3.8 × 10³ |
3 |
4.2 |
1 |
4.2 × 10³ |
5 |
4.9 |
1.1 |
4.5 × 10³ |
3.7 CD measurements
CD spectroscopy can supply information regarding the secondary and tertiary structure of trypsin. This includes α-helix, β-sheet, β-turn and random coil. Fig. 10 shows far-UV spectra of trypsin in the presence of spermine as the secondary structure of trypsin was changed. There was a global minimum around 208 nm in the CD spectrum of the native structure of trypsin, as referred to the α-helix conformation (208 nm) in the crystalline structure of trypsin.46 When adding spermine, the ratio of α-helix and other secondary structures was changed. But there was no significant change in the global minimum and a slight increase of α-helix structure was observed in trypsin secondary structure (Table 4). The mean residue ellipticity at 208 nm was related to the α-helix content and that at 215 nm referred to β-strand content. The α-helix and β-sheet contents of trypsin were changed together.15,46 According to these findings, it could be suggested that spermine caused little changes in the trypsin secondary structure in trypsin–spermine complex, especially α-helix information.
 |
| Fig. 10 Far-UV CD spectra of trypsin in the absence and presence of spermine (dotted line: 2 mM and dash line: 4 mM). The Y-axis is the mean-residue ellipticity with the unit of degree cm2 mol−1. | |
Table 4 Changes in the secondary structures of trypsin in the absence and presence of spermine
Spermine (mM) |
% α-Helix |
% β Sheet |
β-Turn |
% Random coil |
0 |
5.4 |
40.8 |
19.7 |
34.1 |
2 |
5.6 |
40.4 |
20.0 |
34.0 |
4 |
5.8 |
40.0 |
20.1 |
34.1 |
The near-UV CD spectra were observed to get information about the tertiary structures of trypsin. The aromatic side chain and disulfide bond participated in these spectral regions (260–320 nm). The oligomerization and local conformational changes around these chromophores influenced the band intensity.46,47 If aromatic residues were closer together, the band intensity would be increased. Because trypsin contained tryptophan, tyrosine and phenylalanine, the interpretation of the changes in spectrum was rather difficult.
Spermine caused minor changes in the near-UV CD spectrum and increased the intensity of the near-UV CD signal at 270 nm; it seemed that the aromatic side chains were a little closer to each other in trypsin–spermine complex (Fig. 11). In addition, a peak about 332 in the intrinsic fluorescence spectrum of the native trypsin presented an obvious quenching with no important shift. Therefore, the native tertiary structure of trypsin seemed to experience minor changes by spermine.5
 |
| Fig. 11 Near-UV CD spectra of trypsin in the absence and presence of spermine (dotted line: 2 mM and dash line: 4 mM). The Y-axis is the mean-residue ellipticity with the unit of degree cm2 mol−1. | |
3.8 Molecular docking study
The final intermolecular energy, hydrogen bond, total internal energy, binding energies and amino acid interactions in the docked complexes of polyamine (spermine) with protein trypsin are shown in Table 5, and the interaction modes and H-bond and hydrophobic interactions of the ligand polyamines(spermine) and trypsin are depicted in Fig. 12 and 13. As shown in Fig. 12, Glu 77 and Asp 71 interacted with trypsin by H-bond and also, Val 154, Asp 72 and Ala 24 interacted with enzyme by the hydrophobic interaction.
Table 5 Docking results for the spermine – trypsin system
Lowest binding energy (Kcal mol−1) |
Estimated inhibition constant, Ki |
Final intermolecular energy (Kcal mol−1) |
H-Bond (Kcal mol−1) |
Electrostatic energy (Kcal mol−1) |
Interaction bonds |
Hydrogen-bonding |
Hydrophobic-bonding |
−5.09 |
186.83 |
−7.17 |
−2.27 |
−4.91 |
Glu 77 |
Val 154 |
Asp 71 |
Asn 72 |
Ala 24 |
 |
| Fig. 12 H-bond (black) and hydrophobic (red) analysis of the docking poses by Ligplot plus tool for spermine ligands in trypsin. | |
 |
| Fig. 13 The superimposition of the docked spermine into protein trypsin. | |
4. Conclusion
This is the first study reporting spermine effect on the structure and kinetic of trypsin, helping to explore the mechanism of their observed effects. In the present study, spectroscopic studies were applied to investigate the interaction between trypsin and spermine by UV-vis absorption, thermal stability, fluorescence spectral technique, CD and the kinetic technique. It was found that spermine was bound to trypsin, leading to the increase in the thermal stability of trypsin and more biocompatibility of the trypsin structure. The stabilizing effect of polyamine against thermal denaturation of trypsin was confirmed. The second major finding was that spermine increased the activity of trypsin, changing trypsin conformation. Probably, spermine molecules entered the cavity of the active site, causing the catalytic activity center to be further exposed. The static quenching initiated the quenching of the Trp of trypsin and the Stern–Volmer constants confirmed the static quenching mechanism. The experimental results indicated that the microenvironments of the tryptophan residue of trypsin were changed by spermine. In addition, the thermodynamic parameters showed that there was one binding site for spermine. It could be explained by theoretical points showing that there might be one binding site in trypsin as the target of combined dynamic and static quenching.
ΔG° and ΔS° values and ΔH° value were negative at 298 and 308 K, showing that van der Waals forces and hydrogen bonding predominated in this interaction. To summarize, spermine is a stabilizer and activator compound for protease. The results suggested that those poly-methylene skeletons of polyamine and its primary and secondary amines contributed to this effect. It seems that these effects of polyamines are due to their kosmotropic properties.4,5 Kosmotropes could contribute to the stability of water–water interactions. Kosmotropes could cause water molecules to favorably interact, thereby stabilizing intramolecular interactions in macromolecules such as proteins.48
Acknowledgements
The authors also thank Ms Evini, University of Tehran, for helping with CD experiments.
References
- M. Bohlooli, A. A. Moosavi-Movahedi, F. Taghavi, P. Maghami, A. A. Saboury, Z. Moosavi-Movahedi, M. Farhadi, J. Hong, N. Sheibani and M. Habibi-Rezaei, Int. J. Biol. Macromol., 2013, 62, 358–364 CrossRef CAS PubMed.
- S. A. Lawrence, Amines: synthesis, properties and applications, Cambridge University Press, 2004 Search PubMed.
- T. Antony, W. Hoyer, D. Cherny, G. Heim, T. M. Jovin and V. Subramaniam, J. Biol. Chem., 2003, 278, 3235–3240 CrossRef CAS PubMed.
- R. K. Chowhan and L. R. Singh, J. Protein. Proteonomics, 2012, 3(2), 141–150 Search PubMed.
- N. Rezaei-Ghaleh, A. Ebrahim-Habibi, A. A. Moosavi-Movahedi and M. Nemat-Gorgani, Int. J. Biol. Macromol., 2007, 41, 597–604 CrossRef CAS PubMed.
- O. Jolois, O. Peulen, S. Collin, M. Simons, G. Dandrifosse and E. Heinen, Exp. Physiol., 2002, 87, 69–75 CrossRef CAS PubMed.
- S. Bardócz, G. Grant, D. S. Brown, A. Ralph and A. Pusztai, J. Nutr. Biochem., 1993, 4, 66–71 CrossRef.
- N. Romain, M. Gesell, O. Leroy, P. Forget, G. Dandrifosse and G. Luk, Comp. Biochem. Physiol., Part A: Mol. Integr. Physiol., 1998, 120, 379–384 CrossRef CAS.
- I. Wery, M. Kaouass, P. Deloyer, J. Buts, H. Barbason and G. Dandrifosse, Hepatology, 1996, 24, 1206–1210 CAS.
- H. Olle, Physiology, 1986, 1, 12–15 CrossRef.
- M. Kudou, K. Shiraki, S. Fujiwara, T. Imanaka and M. Takagi, Eur. J. Biochem., 2003, 270, 4547–4554 CrossRef CAS PubMed.
- M. Braia, G. Tubio, B. Nerli, W. Loh and D. Romanini, Int. J. Biol. Macromol., 2012, 50, 180–186 CrossRef CAS PubMed.
- D. Neil, N. Rawlings and G. Salvesen, Handbook of proteolytic enzymes, Academic Press, Cambridge, UK, 2013 Search PubMed.
- W.-R. Wang, R.-R. Zhu, R. Xiao, H. Liu and S.-L. Wang, Biol. Trace Elem. Res., 2011, 142, 435–446 CrossRef CAS PubMed.
- X. Hu, Z. Yu and R. Liu, Spectrochim. Acta, Part A, 2013, 108, 50–54 CrossRef CAS PubMed.
- B. Arrio, M. Hill and C. Parquet, Biochimie, 1973, 55, 283–289 CrossRef CAS PubMed.
- F. X. Schmid, Encyclopedia of Life Science, 2001 Search PubMed.
- T. Xu, X. Guo, L. Zhang, F. Pan, J. Lv, Y. Zhang and H. Jin, Food Chem. Toxicol., 2012, 50, 2540–2546 CrossRef CAS PubMed.
- G. R. Bickerton, G. V. Paolini, J. Besnard, S. Muresan and A. L. Hopkins, Nat. Chem., 2012, 4, 90–98 CrossRef CAS PubMed.
- G. M. Morris, R. Huey, W. Lindstrom, M. F. Sanner, R. K. Belew, D. S. Goodsell and A. J. Olson, J. Comput. Chem., 2009, 30, 2785–2791 CrossRef CAS PubMed.
- Z. Chi, R. Liu and H. Zhang, Biomacromolecules, 2010, 11, 2454–2459 CrossRef CAS PubMed.
- G. Wang, Y. Chen, C. Yan and Y. Lu, J. Lumin., 2015, 157, 229–234 CrossRef CAS.
- S. H. D. P. Lacerda, J. J. Park, C. Meuse, D. Pristinski, M. L. Becker, A. Karim and J. F. Douglas, ACS Nano, 2009, 4, 365–379 CrossRef PubMed.
- B. Shareghi, S. Farhadian, N. Zamani, M. Salavati-Niasari, H. Moshtaghi and S. Gholamrezaei, J. Ind. Eng. Chem., 2015, 21, 862–867 CrossRef CAS.
- A. Kathiravan, M. A. Jhonsi and R. Renganathan, J. Lumin., 2011, 131, 1975–1981 CrossRef CAS.
- D. Lu, X. Zhao, Y. Zhao, B. Zhang, B. Zhang, M. Geng and R. Liu, Food Chem. Toxicol., 2011, 49, 3158–3164 CrossRef CAS PubMed.
- L. Ding, P. Zhou, S. Li, G. Shi, T. Zhong and M. Wu, J. Fluoresc., 2011, 21, 17–24 CrossRef CAS PubMed.
- H.-M. Zhang, Y.-Q. Wang and M.-L. Jiang, Dyes Pigm., 2009, 82, 156–163 CrossRef CAS.
- M. Saeidifar, H. Mansouri-Torshizi and A. A. Saboury, J. Lumin., 2015, 167, 391–398 CrossRef CAS.
- S. Koutsopoulos, K. Patzsch, W. T. Bosker and W. Norde, Langmuir, 2007, 23, 2000–2006 CrossRef CAS PubMed.
- M.-Y. Xue, A.-P. Yang, M.-H. Ma and X.-H. Li, J. Spectrosc., 2009, 23, 257–263 CrossRef CAS.
- P. M. Reddy, R. Umapathi and P. Venkatesu, Phys. Chem. Chem. Phys., 2015, 17, 184–190 RSC.
- B. Ghalandari, A. Divsalar, A. A. Saboury, T. Haertlé, K. Parivar, R. Bazl, M. Eslami-Moghadam and M. Amanlou, Spectrochim. Acta, Part A, 2014, 118, 1038–1046 CrossRef CAS PubMed.
- D. Ajloo, B. Shfaatian, M. Ghadamgahi, Y. Alopour, T. Lashgarbolouki and A. A. Saboury, Int. J. Biol. Macromol., 2015, 77, 193–202 CrossRef CAS PubMed.
- A. Divsalar, M. Razmi, A. A. Saboury, H. Mansouri-Torshizi and F. Ahmad, Cell Biochem. Biophys., 2014, 71, 1415–1424 CrossRef PubMed.
- F. Faridbod, M. R. Ganjali, B. Larijani, S. Riahi, A. A. Saboury, M. Hosseini, P. Norouzi and C. Pillip, Spectrochim. Acta, Part A, 2011, 78, 96–101 CrossRef PubMed.
- J. R. Lakowicz and G. Weber, Biochemistry, 1973, 12, 4161–4170 CrossRef CAS PubMed.
- Y. Liu and R. Liu, Food Chem. Toxicol., 2012, 50, 3298–3305 CrossRef CAS PubMed.
- B. Delavari, A. A. Saboury, M. S. Atri, A. Ghasemi, B. Bigdeli, A. Khammari, P. Maghami, A. A. Moosavi-Movahedi, T. Haertlé and B. Goliaei, Food Hydrocolloids, 2015, 45, 124–131 CrossRef CAS.
- P. D. Ross and S. Subramanian, Biochemistry, 1981, 20, 3096–3102 CrossRef CAS PubMed.
- A. A. Saboury and F. Karbassi, Thermochim. Acta, 2000, 362, 121–129 CrossRef CAS.
- C. Pace and J. Hermans, CRC Crit. Rev. Biochem., 1975, 3, 1–43 CrossRef CAS PubMed.
- A. Kumar and P. Venkatesu, Chem. Rev., 2012, 112, 4283–4307 CrossRef CAS PubMed.
- A. A. Saboury, J. Iran. Chem. Soc., 2009, 6, 219–229 CrossRef CAS.
- A. Ibarz, A. Garvín, S. Garza and J. Pagán, Food Chem. Toxicol., 2009, 47, 2071–2075 CrossRef CAS PubMed.
- M. Kotormán, I. Laczkó, A. Szabó and L. Simon, Biochem. Biophys. Res. Commun., 2003, 304, 18–21 CrossRef.
- R. W. Woody and A. K. Dunker, in Circular dichroism and the conformational analysis of biomolecules, ed. G. D. Fasman, Springer, US, 1996, pp. 109–157 Search PubMed.
- S. Moelbert, B. Normand and P. De Los Rios, Biophys. Chem., 2004, 112, 45–57 CrossRef CAS PubMed.
|
This journal is © The Royal Society of Chemistry 2016 |
Click here to see how this site uses Cookies. View our privacy policy here.