
[Cu3(BTC)2]-polyethyleneimine: an efficient MOF composite for effective CO2 separation†
Aarti *,
Sonal Bhadauria,
Anshu Nanoti,
Soumen Dasgupta,
Swapnil Divekar,
Pushpa Gupta and
Rekha Chauhan
*,
Sonal Bhadauria,
Anshu Nanoti,
Soumen Dasgupta,
Swapnil Divekar,
Pushpa Gupta and
Rekha Chauhan
CSIR-Indian Institute of Petroleum, Dehradun 248005, India. E-mail: aarti@iip.res.in
First published on 19th September 2016
Abstract
Increased CO2 concentration in the earth’s atmosphere results in global warming and has increased concerns towards the development of efficient strategies for carbon capture and storage. CO2 separation from flue gas is one of the most challenging areas. Here, a Cu-BTC MOF and a series of polyethyleneimine (PEI) incorporated Cu-BTC composites (Cu-BTC–PEI) with different loading amounts of PEI have been developed for CO2 separation. A significant increase in CO2 adsorption capacity was observed with Cu-BTC–PEI adsorbents. Detailed characterization of the developed adsorbents was done using XRD, SEM, BET surface area and IR. The synthesized adsorbents show good CO2/N2 selectivity for a designed flue gas composition containing 15 vol% CO2 and the remainder as N2. 2.5 wt% PEI loaded Cu-BTC (Cu-BTC–PEI-2.5) has shown a CO2 adsorption capacity of 0.83 mmol g−1 at a pressure of 0.15 bar and 25 °C which is almost double that of Cu-BTC in similar conditions. But at an elevated pressure of 5 bar and 25 °C, 1 wt% PEI loaded Cu-BTC (Cu-BTC–PEI-1) performed even better with a CO2 adsorption capacity of 10.57 mmol g−1. Better adsorption capacity and selectivity for CO2 was obtained with Cu-BTC–PEI composites and they are good aspirant adsorbents for CO2 separation from flue gas.
1. Introduction
Carbon capture and storage (CCS) has attracted attention due to rising CO2 emission from fossil fuel combustion for growing energy needs. CO2 is the major component of emission gases which is ca. 60% of total green house gases and has a major contribution toward global warming.1 Atmospheric CO2 concentration has reached ca. 403 ppm, which is significantly higher than the preindustrial level of 300 ppm. Flue gas contains 14–15% CO2 and 75–76% N2 and the remainder contains H2O, SOx, NOx. Therefore, adsorbents for CO2 adsorption should possess high CO2 uptake and selectivity at a partial pressure near 0.15 bar. Therefore, CO2 separation from flue gas at room temperature and atmospheric pressure is a challenging task.A current major requirement for any CO2 separation process is the development of adsorbents with high adsorption capacity, selectivity, low regeneration cost and stability in realistic conditions. Various solid adsorbents such as zeolites,2 activated carbons,3 silicas,4 and new classes of porous materials5–7 have been reported in the literature for CO2 adsorption. Among them, Metal–Organic Frameworks (MOFs)8,9 have emerged as potential adsorbents due to their high CO2 storage and separation capabilities.10–12 A number of MOF materials in recent years have successfully been synthesized13–16 due to their well-characterized crystalline architectures, ultrahigh porosity and the possibility of functionality. Although, the design of MOFs for CO2 adsorption with high capacity and selectivity remains a challenge, as MOFs not only adsorb CO2 but also strongly adsorb some other gases such as N2, CH4 and O2. Therefore, MOFs should be designed in such a way that pores and other functional groups present in MOFs selectively and specifically adsorb CO2. A limited number of MOFs have shown satisfactory CO2 separation at low pressure and ambient temperature due to weak interaction between CO2 and the framework.17,18
Nowadays, the main emphasis in MOF formulation is towards enhancement of the CO2 binding capacity.19–21 Amine grafting, and the introduction of strongly polarizing functional groups and open metal cation sites are the most studied approaches. Amine functionalized zeolites and silica have already been reported in the literature for CO2 adsorption.22–26 Similarly, amine functionalization of MOFs is currently emerging as a potential approach for CO2 adsorption with a low heat capacity. Based on these studies it may be concluded that the porosity and amount of amine loading determine their CO2 adsorption capacity.23
Recently, integration of diamines or polyamines into the open metal sites of MOFs has been reported to increase CO2 adsorption capacity at low pressure and room temperature.27–29 The dispersion of polyamines in the MOF framework allows diffusion and adsorption of CO2 molecules, which results in a high CO2 adsorption capacity with the MOF/polyamine composites. Pure polyamine is found in a gel form which hinders the diffusion of CO2 molecules and interaction with amine groups. MOFs act as a support and dispersion surface for polyamines, to realise the enhanced CO2 adsorption capacity and selectivity. Polyethyleneimine (PEI) is a suitable polyamine for loading in MOFs due to its high amine density and accessible primary amine sites at chain ends.23,30 The higher pore volume, porosity and surface area of MOFs compared to silica or zeolites make them more suitable for PEI impregnation with a high CO2 adsorption capacity. PEI impregnation into MOFs was recently reported by Chen et al.27,31 which is the only available literature for MOF–PEI composites.
Cu3(BTC)2 (also known as HKUST; BTC = 1,3,5-benzenetricaboxylic acid) is chosen as the MOF because it has a large surface area, high pore volume, chemical stability and Lewis acidity of open metal sites.32,33 Post synthetic modification of Cu-BTC by coordinating 4-(methylamino)-pyridine to the Cu-center has been reported by Ingleson et al.34 while few reports are available in the literature on modification of the organic linker H3BTC by methyl, ethyl 35 and amine groups.36,37 Herein, we report loading of branched PEI into a Cu-BTC framework to enhance the CO2 adsorption capacity. The PEI is anchored to open metal sites of Cu-BTC to form the Cu-BTC–PEI composite adsorbent. The branched PEI of molecular weight (Mw = 1300) that was used possesses more primary amine groups (–NH2–) and could show a higher affinity for CO2 than secondary amines (–NH–).38
2. Experimental
2.1. Materials
Benzene-1,3,5-tricarboxylic acid (H3BTC, Sigma-Aldrich), cupric nitrate trihydrate (Spectral, India), ethanol (Fisher) and methanol (SRL, India) were used as received without further purification. Branched polyethyleneimine (50 wt% in H2O, Mw ≈ 1300, Sigma-Aldrich) was used in the present study. The PEI structure is as follows
2.2. Synthesis of Cu-BTC [Cu3(BTC)2]
Cu3(BTC)2 was synthesized according to the procedure reported by Chui et al.39 An ethanolic solution of H3BTC (1.2 g, 5 mmol in 20 mL) was slowly added on continuous stirring to an aqueous solution of Cu(NO3)2·3H2O (2.17 g, 9 mmol in 20 mL). The resulting reaction mixture was transferred into a Teflon-lined stainless steel autoclave and heated at 120 °C for 18 h. After cooling to ambient temperature, blue crystals of Cu-BTC were isolated by filtration, and repeatedly washed with deionized water followed by ethanol. Finally, Cu-BTC was dried under vacuum at 130 °C for 12 h.2.3. Synthesis of Cu-BTC–PEI composites
Cu-BTC–PEI composite MOFs were synthesized by following a wet impregnation method. Before impregnation Cu-BTC MOF was activated at 130 °C for 12 h under vacuum to remove foreign molecules and to make free cavities available for the loading of desired molecules. PEI corresponding to 1.0, 2.5 and 5.0 wt% loading, separately, was dissolved in anhydrous methanol. Then Cu-BTC (0.5 g) was added in steps to the above solutions and stirred for 1 h. The resulting gel was dried overnight at room temperature under nitrogen protection. The obtained material was dried at 110 °C for 12 h under vacuum. Eventually a porous solid Cu-BTC–PEI was obtained corresponding to 1.0, 2.5 and 5.0 wt% loading of PEI and abbreviated as Cu-BTC–PEI-1, Cu-BTC–PEI-2.5 and Cu-BTC–PEI-5, respectively.2.4. Characterization
Powder XRD data of the product were collected on a Bruker D8 Avance diffractometer using CuKα radiation at room temperature in an angular range of 5–30° (2θ) with a step size of 0.02° s−1 (2θ). IR spectra of the samples were recorded as KBr pellets on a Thermo Nicolet 8700 spectrometer. Cu-BTC and Cu-BTC–PEI samples were activated under vacuum conditions for IR analysis. Thermo gravimetric analyses of the complexes were carried out using a Perkin Elmer Diamond under a nitrogen atmosphere at a heating rate of 10 °C min−1 up to 600 °C. Before TGA measurement all samples were activated at 130 °C for 6 h. The morphology of the adsorbents was examined using a Field Emission Scanning Electron Microscope (FE-SEM). Transmission Electron Microscopy (TEM)-elemental mapping and TEM-EDX analysis was performed on a JEOL model no JEM 2100. Surface area and pore volume measurements were carried out using a surface area analyzer (Micromeritics Tristar II). All samples were out gassed under vacuum at 130 °C for about 12 h prior to measurement of N2 isotherms at 77 K. For surface area calculations the relative pressure (Ps/Po) range was between 0.05 and 0.2.2.5. Sorption experiments
Adsorption equilibrium isotherms of CO2 and N2 on the Cu-BTC and Cu-BTC–PEI composites were measured gravimetrically on a Rubotherm magnetic suspension balance at 25, 40 and 55 °C separately. Prior to the adsorption isotherm experiment each adsorbent was activated at 130 °C for 12 h under vacuum. During the gaseous sorption measurements, the sample mass was monitored until equilibrium was achieved at each pressure. The buoyancy volume required for corrections was obtained using helium as a non-adsorbing reference gas at 25 °C. The buoyancy corrections were applied to raw measurements recorded by the balance, to calculate the excess amount adsorbed.40 In a typical adsorption equilibrium measurement, the adsorption equilibrium was determined by observing the plateau in the uptake curve. The equilibrium was assumed to have been achieved when the gas uptake was within ±5 μg of two subsequent measuring points taken by the microbalance software automatically. At a given pressure point it took 45 to 60 minutes to reach equilibrium as per the above criterion.The CO2 adsorption isotherm data was fitted with the Langmuir model as described in eqn (1) and (2). The Langmuir model is a thermodynamically consistent model which reduces to Henry’s law at low pressure.
 | (1) |
Parameter b follows an Arrhenius like temperature dependence which is given as eqn (2).
 | (2) |
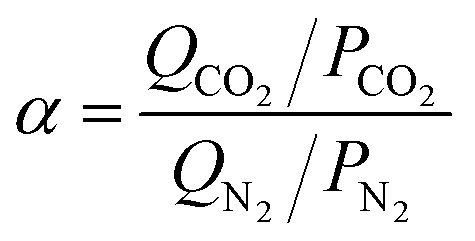
The CO2/N2 adsorption selectivity of all samples was calculated by using the following equation
3. Results and discussion
3.1. Characterization of Cu-BTC and Cu-BTC–PEI composites
The lab synthesized Cu-BTC and Cu-BTC–PEI composites were characterized by N2 adsorption, desorption at 77 K, scanning electron microscopy (SEM), powder X-ray diffraction (PXRD), Thermo Gravimetric Analysis (TGA) and infrared spectroscopy (IR). The SEM images of Cu-BTC and PEI impregnated Cu-BTC were recorded to understand the morphological changes occurring at various levels of syntheses. The scanning electron microscopy images of Cu-BTC and Cu-BTC–PEI composites are shown in Fig. 1. The prepared bare Cu-BTC has a square planar trigonal bipyramidal shape with a smooth surface. Upon PEI loading, the basic structure of Cu-BTC was conserved, with some roughening due to the interaction of Cu-BTC with PEI. The change in the surface of Cu-BTC after loading of PEI suggests a change in the nature of the surface of Cu-BTC. The morphological change on the surface was also ratified by PXRD as shown in Fig. 2. Furthermore, the presence of amine in terms of nitrogen is confirmed by TEM elemental mapping and TEM-EDX analysis of the Cu-BTC and Cu-BTC–PEI composites (ESI Fig. S1–S4†). Nitrogen is not present on the surface of the pure Cu-BTC, while nitrogen is clearly visible on the surface of PEI impregnated Cu-BTC and the amount of nitrogen increases with the loading amount of PEI.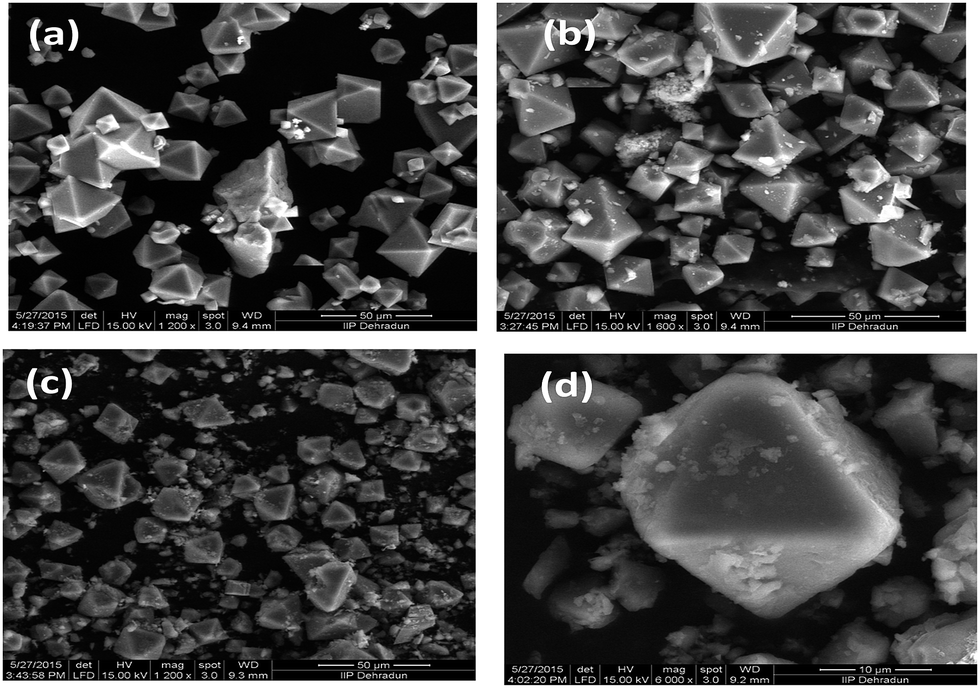 | ||
| Fig. 1 SEM micrographs of (a) Cu-BTC, (b) Cu-BTC–PEI-1, (c) Cu-BTC–PEI-2.5 and (d) Cu-BTC–PEI-5. | ||
 | ||
| Fig. 2 Powder XRD patterns of Cu-BTC and Cu-BTC–PEI with different loading amounts of PEI. | ||
The diffraction pattern of the as synthesized Cu-BTC was in accordance with published literature data.32,41 Powder XRD patterns of the Cu-BTC and Cu-BTC–PEI composites are essentially identical, indicating that the Cu-BTC crystal structure is well maintained after loading of PEI. The peak at 6° in Cu-BTC disappeared because of PEI loading into the pores of Cu-BTC. As the amount of PEI loading increases, a decrease in the peak intensity above 7° in the Cu-BTC–PEI composites was observed, also suggesting the loading of PEI into the pores of Cu-BTC. The decrease in intensity also indicates roughness and the interaction of PEI with Cu-BTC. These changes in the XRD peak intensity and crystallinity indicate PEI loading into the inter crystalline void space as well as also covering the surface of Cu-BTC. The decrease in peak intensity after loading of PEI onto Cu-BTC indicates loading of PEI at the surface of Cu-BTC. Similarly, the decrease in surface area as well as pore volume indicates loading of PEI into the pores of Cu-BTC. PEI loaded SBA-15 has also exhibited a similar type of behaviour.23
The IR spectra of the Cu-BTC and Cu-BTC–PEI composites are shown in Fig. 3. The band observed around 1715 cm−1 can be assigned to the acidic C![[double bond, length as m-dash]](https://www.rsc.org/images/entities/char_e001.gif) O stretching vibration present in BTC, which after complexation with Cu2+ is shifted to 1665 cm−1. The characteristic vibration at 725 cm−1 is attributed to the Cu–O stretching vibration because of the coordination of an oxygen atom with Cu. The vibration at 1574 cm−1 is due to –NH bending and indicates interaction between Cu–OH and the PEI amine group.
O stretching vibration present in BTC, which after complexation with Cu2+ is shifted to 1665 cm−1. The characteristic vibration at 725 cm−1 is attributed to the Cu–O stretching vibration because of the coordination of an oxygen atom with Cu. The vibration at 1574 cm−1 is due to –NH bending and indicates interaction between Cu–OH and the PEI amine group.
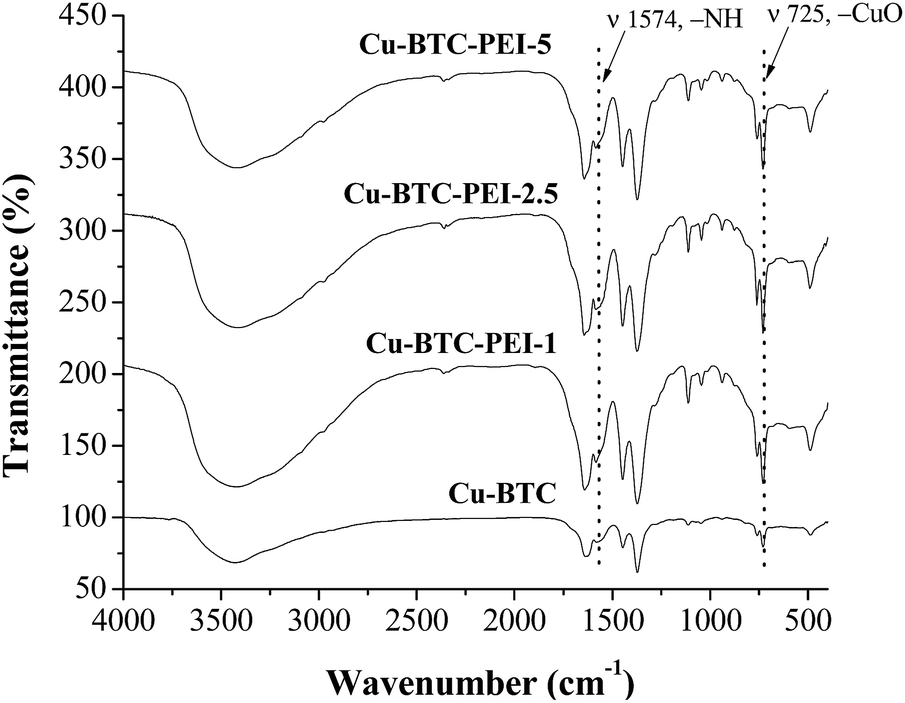 | ||
| Fig. 3 IR spectra of Cu-BTC, Cu-BTC–PEI-1, Cu-BTC–PEI-2.5 and Cu-BTC–PEI-5. | ||
The thermal stability of the Cu-BTC and Cu-BTC–PEI composites with respect to temperature was studied by TGA (Fig. 4). As per Fig. 4 the initial weight loss at 100 °C can be attributed to a loss of moisture which continues up to 150 °C. With a PEI loading of 5 wt%, a sharp decrease in weight was observed from 280 °C onward, which could be attributed to the loss of loosely bound PEI. It may be mentioned that at a lower PEI loading i.e. 1.0 and 2.5 wt%, such a loss occurs at a higher temperature. This TGA behaviour clearly indicates that at lower loading, PEI more strongly interacts with the CuBTC framework. The weight loss from 220 to 360 °C may be due to the decomposition of the organic benzene tricarboxylate linker and collapse of the MOF structure.
 | ||
| Fig. 4 TGA profile of Cu-BTC and PEI impregnated Cu-BTC. | ||
Surface area and pore volume measurements of Cu-BTC and PEI impregnated Cu-BTC were obtained from N2 adsorption/desorption isotherms at 77 K. The surface area of Cu-BTC was calculated as 1080 and 1566 m2 g−1 using the multipoint BET and Langmuir equation, respectively and the specific pore volume was 0.57 cm3 g−1. The surface area and pore volume of the Cu-BTC–PEI composites were calculated on the basis of the N2 isotherm and are shown in Fig. 5 and Table 1. The impregnation of PEI on the Cu-BTC surface leads to a decrease in the pore volume and surface area. With an increase in the PEI loading, the probability of pore blockage increases and some pores are not accessible for N2 adsorption, which also results in a decrease of pore volume. Similar types of changes in the surface area and pore volume have been studied with PEI loaded silica.42
 | ||
| Fig. 5 N2 adsorption-desorption isotherms at 77 K. The symbols: filled, adsorption; unfilled, desorption. | ||
| Adsorbent | Surface area (m2 g−1) | Pore volume (cm3 g−1) | |
|---|---|---|---|
| BET | Langmuir | ||
| Cu-BTC | 1080.00 | 1566.02 | 0.57 |
| CuBTC–PEI-1 | 1034.05 | 1497.21 | 0.54 |
| CuBTC–PEI-2.5 | 885.73 | 1276.76 | 0.47 |
| CuBTC–PEI-5 | 877.61 | 1266.75 | 0.46 |
The CO2 adsorption capacity increases with PEI loading, though there is a decrease in the surface area and pore volume of the adsorbent43 compared to the unimpregnated Cu-BTC. The enhancement in CO2 capacity can be attributed to the higher affinity of amine groups for CO2. As the PEI loading increases no further enhancement in CO2 uptake is observed at 5 bar pressure. This phenomena could be due to the decrease in surface area and pore volume of the adsorbent with increased PEI loading. It also indicates that for a given partial pressure there is an optimum amount of PEI loading with maximum enhancement of CO2 loading.
3.2. CO2/N2 adsorption isotherms
The adsorption isotherms for CO2/N2 were measured gravimetrically in a Rubotherm gravimetric balance at 25, 40 and 55 °C up to 5 bar pressure. The experimental isotherm data was also fitted with a Langmuir isotherm model and the fitting parameters of the Cu-BTC and Cu-BTC–PEI adsorbents are shown in Fig. 6 and Table 2. | ||
| Fig. 6 Experimental CO2 isotherms and the corresponding Langmuir fit of (a) Cu-BTC (b) Cu-BTC–PEI-1.0 (c) Cu-BTC–PEI-2.5 and (d) Cu-BTC–PEI-5.0 (symbol description – ●: 25 °C, ■: 40 °C, ▲: 55 °C and solid line: corresponding Langmuir fit). | ||
| Adsorbent | q0 (mmol g−1) | b0 (bar−1) | −ΔH (kJ mol−1) | Sum of square error (mmol g−1)2 |
|---|---|---|---|---|
| Cu-BTC | 13.832 | 3.830 × 10⁻⁴ | 16.500 | 0.69 |
| Cu-BTC–PEI-1.0 | 19.745 | 1.140 × 10⁻⁵ | 24.398 | 1.47 |
| Cu-BTC–PEI-2.5 | 14.099 | 2.110 × 10⁻⁶ | 30.000 | 0.483 |
| Cu-BTC–PEI-5.0 | 13.868 | 1.276 × 10⁻⁵ | 25.000 | 2.155 |
The CO2 adsorption capacity of Cu-BTC at 25 °C was obtained as 7.56 mmol g−1 at 5 bar which decreased to 6.31 mmol g−1 on a further increase in temperature to 55 °C. After impregnation of PEI to Cu-BTC an increase in the CO2 adsorption capacity was observed. Cu-BTC–PEI-1 exhibited a CO2 adsorption capacity of 3.95 mmol g−1 at 1 bar which on increasing the PEI amount to 2.5 wt% increased to 4.15 mmol g−1 but on further increase in PEI loading to 5 wt% a decrease in the CO2 adsorption capacity to 3.65 mmol g−1 was observed. At 5 bar pressure, Cu-BTC–PEI-1 shows 10.47 mmol g−1 of CO2 adsorption capacity at 25 °C, which is higher than the bare Cu-BTC. Under the same conditions, a decreased CO2 adsorption capacity was obtained with increased PEI loading i.e. 2.5 and 5 wt%, which may be due to the decreased surface area and pore volume.
CO2 adsorption isotherms were also obtained at 40 and 55 °C to observe the effect of temperature on CO2 adsorption capacity. The CO2 adsorption capacity at different temperatures for Cu-BTC and Cu-BTC–PEI adsorbents is shown in Table 3. At 40 °C the Cu-BTC–PEI adsorbents showed an increased CO2 adsorption capacity while at 55 °C a negligible increase in the CO2 adsorption capacity was observed (Table 3). The CO2 adsorption at high temperature has a negative effect on the adsorption because the CO2 adsorption onto PEI is an exothermic process.23 CO2 molecules at high temperature tend to have high kinetic energy. Therefore, a higher adsorption capacity is expected to be achieved at a lower temperature.
| Adsorbent | CO2 adsorption capacity (mmol g−1) at 25 °C | CO2 adsorption capacity (mmol g−1) at 40 °C | CO2 adsorption capacity (mmol g−1) at 55 °C | CO2/N2 selectivity, at 1 bar | |||||||
|---|---|---|---|---|---|---|---|---|---|---|---|
| 0.15 bar | 1 bar | 5 bar | 0.15 bar | 1 bar | 5 bar | 0.15 bar | 1 bar | 5 bar | At 25 °C | At 55 °C | |
| Cu-BTC | 0.42 | 3.22 | 7.56 | 0.37 | 2.35 | 7.42 | 0.28 | 1.82 | 6.31 | 1.26 | 2.08 |
| CuBTC–PEI-1 | 0.59 | 3.95 | 10.47 | 0.42 | 2.52 | 7.33 | 0.26 | 1.61 | 5.89 | 1.52 | 2.48 |
| CuBTC–PEI-2.5 | 0.83 | 4.15 | 9.37 | 0.45 | 2.61 | 7.13 | 0.26 | 1.60 | 5.50 | 2.04 | 2.18 |
| CuBTC–PEI-5 | 0.63 | 3.67 | 8.97 | 0.38 | 2.17 | 5.77 | 0.24 | 1.52 | 5.38 | 1.77 | 2.29 |
The CO2 adsorption capacities at ca. 0.15 bar corresponding to flue gas CO2 for Cu-BTC and PEI impregnated Cu-BTC are also tabulated in Table 3. The PEI impregnated Cu-BTC has shown a faster increase in CO2 adsorption capacity than bare Cu-BTC in the pressure range of 0–0.15 bar. The Cu-BTC with a PEI loading of 2.5 wt% has a CO2 adsorption capacity of 0.83 mmol g−1, while Cu-BTC achieved only 0.42 mmol g−1 under the same conditions.
The CO2 adsorption capacity decreased with increasing amounts of PEI, as the primary amine groups bind more CO2 compared to secondary amine groups. Also, the PEI being used has branched chains, which would wrap around the surface as well as block the pores of Cu-BTC. This is also consistent with the surface area, SEM and XRD data.
The CO2/N2 selectivity was calculated for a gas mixture with CO2 0.15 bar and N2 0.85 bar considering the flue gas composition which contains CO2 (15 vol%) and the remainder as N2 as the main components. As shown in Table 3 the PEI impregnated Cu-BTC has increased CO2 adsorption capacity at the experimental temperatures. Cu-BTC–PEI-2.5 has approximately double the CO2/N2 selectivity, ca. 1.0, compared to Cu-BTC at 25 °C.
The N2 adsorption isotherm has also been measured for Cu-BTC before and after impregnation with PEI at 25, 40 and 55 °C as shown in Fig. 7. The PEI impregnated Cu-BTC has a lower adsorption capacity for N2 as compared to Cu-BTC at 1 bar and 25 °C.
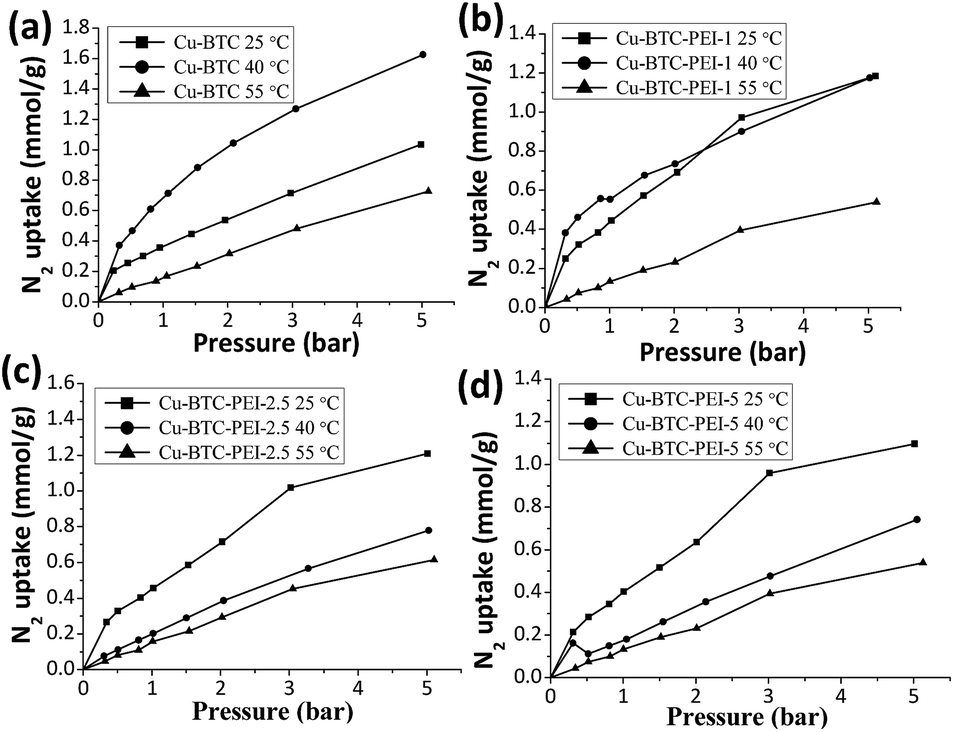 | ||
| Fig. 7 N2 adsorption isotherms with (a) Cu-BTC, (b) CuBTC–PEI-1, (c) CuBTC–PEI-2.5 and (d) CuBTC–PEI-5 at 25, 40, 55 °C. | ||
The N2 adsorption capacity decreases due to weak van der Waals interaction. The kinetic diameter of CO2 is 3.3 Å which is smaller than that of N2 (3.64 Å). Due to their small diameter, CO2 molecules were able to access the inner pores and strong interactions of PEI with CO2 enhance the possibility of CO2 adsorption. However, high CO2/N2 selectivity of PEI impregnated Cu-BTC was also observed at high temperature.
4. Conclusions
PEI impregnated Cu-BTC has successfully been synthesized and characterized by XRD, SEM, and surface area properties. Adsorption isotherms for CO2 and N2 were carried out at different temperatures with Cu-BTC and Cu-BTC–PEI adsorbents. Cu-BTC–PEI-2.5 shows an increased adsorption capacity of 0.83 mmol g−1 compared to 0.42 mmol g−1 for Cu-BTC at 0.15 bar and 25 °C and also shows a higher CO2 capacity at 40 °C. But at a temperature of 55 °C PEI impregnated Cu-BTC does not show an increased CO2 adsorption capacity due to pore blocking of the MOF. At a high pressure of 5 bar, Cu-BTC–PEI-1 shows a CO2 adsorption capacity of 10.5 mmol g−1 which is also higher as compared to Cu-BTC at 25 °C. Therefore, PEI impregnated Cu-BTC would be a high performance adsorbent at low pressure with an increased adsorption capacity, and CO2/N2 selectivity in flue gas. Future work will be focused on the development of a Pressure/Vacuum Swing Adsorption (PVSA) based process for CO2 separation from flue gas.Acknowledgements
The authors are grateful to the Director, IIP for his kind permission to publish these results. The authors are thankful to ASD-IIP for their analytical support. The authors also acknowledge CSIR’s XIIth Five Year Plan Project, CSC0102 for funding.Notes and references
- J. Albo, P. Luis and A. Irabin, Ind. Eng. Chem. Res., 2010, 49, 11045–11051 CrossRef CAS.
- Y. Lee, D. Liu, D. Seoung, Z. Liu, C. C. Kao and T. Vogt, J. Am. Chem. Soc., 2011, 133, 1674–1677 CrossRef CAS PubMed.
- G. P. Hao, W. C. Li, D. Qian, G. H. Wang, W. P. Zhang, T. Zhang, A. Q. Wang, F. Schuth, H. J. Bongard and A. H. Lu, J. Am. Chem. Soc., 2011, 133, 11378–11388 CrossRef CAS PubMed.
- A. Sayari and Y. Belmabkhout, J. Am. Chem. Soc., 2010, 132, 6312–6314 CrossRef CAS PubMed.
- B. Wang, A. P. Cote, H. Furukawa, M. O. Keeffe and O. M. Yaghi, Nature, 2008, 453, 207–211 CrossRef CAS PubMed.
- C. Sarah, F. M. D. Joeri, V. B. Gino, R. Tom, G. Jorge and K. Freek, J. Am. Chem. Soc., 2009, 131, 6326–6327 CrossRef PubMed.
- K. L. Kauffman, J. T. Cuip, A. J. Allen, L. Espinal, W. Wong-Ng, T. D. Brown, A. Goodman, M. P. Bernardo, R. J. Pancoast, D. Chirdon and C. Matranga, Angew. Chem., Int. Ed., 2011, 50, 10888–10892 CrossRef CAS PubMed.
- P. M. Forster, P. M. Thomas and A. K. Cheetham, Chem. Mater., 2001, 14, 17–20 CrossRef.
- G. Ferey, C. Mellot-Draznieks, C. Serre and F. Millange, Acc. Chem. Res., 2005, 38, 217–225 CrossRef CAS PubMed.
- G. Ferey, C. Serre, T. Devic, G. Maurin, H. Jobic, P. L. Llewellyn, G. De Weireld, A. Vimont, M. Daturi and J.-S. Chang, Chem. Soc. Rev., 2011, 40, 550–562 RSC.
- Q. Wang, J. Luo, Z. Zhong and A. Borgna, Energy Environ. Sci., 2011, 4, 42–55 CAS.
- K. Sumida, D. L. Rogow, J. A. Mason, T. M. McDonald, E. D. Bloch, Z. R. Herm, T.-H. Bae and J. R. Long, Chem. Rev., 2011, 112, 724–781 CrossRef PubMed.
- J.-R. Li, R. J. Kuppler and H.-C. Zhou, Chem. Soc. Rev., 2009, 38, 1477–1504 RSC.
- R. E. Morris and P. S. Wheatley, Angew. Chem., Int. Ed., 2008, 47, 4966–4981 CrossRef CAS PubMed.
- X. Deng, S. Grunder, K. E. Cordova, C. Valente, H. Furukawa, M. Hmadeh, F. Gandara, A. C. Whalley, Z. Liu, S. Asahina, H. Kazumori, M. O’Keeffe, O. Terasaki, J. F. Stoddart and O. M. Yaghi, Science, 2012, 336, 1018–1023 CrossRef PubMed.
- G. Ferey, C. Mellot-Draznieks, C. Serre, F. Millange, J. Dutour, S. Surble and I. Margiolaki, Science, 2005, 309, 2040–2042 CrossRef CAS PubMed.
- P. Nugent, Y. Belmabkhout, S. D. Burd, A. J. Cairns, R. Luebke, K. Forrest, T. Pham, S. Ma, B. Space, L. Wojtas, M. Eddaoudi and M. J. Zaworotko, Nature, 2013, 494, 80–84 CrossRef PubMed.
- S. R. Caskey, A. G. Wong-Foy and A. J. Matzger, J. Am. Chem. Soc., 2008, 130, 10870–10871 CrossRef CAS PubMed.
- Y.-S. Bae, O. K. Farha, A. M. Spokoyny, C. A. Mirkin, J. T. Hupp and R. Q. Snurr, Chem. Commun., 2008, 4135–4137 RSC.
- Y. Zhao, H. Wu, T. J. Emge, Q. Gong, N. Nijem, Y. J. Chabal, L. Kong, D. C. Langreth, H. Liu, H. Zeng and J. Li, Chem.–Eur. J., 2011, 17, 5101–5109 CrossRef CAS PubMed.
- B. Zheng, J. Bai, J. Duan, L. Wojtas and M. J. Zaworotko, J. Am. Chem. Soc., 2010, 133, 748–751 CrossRef PubMed.
- A. Goeppert, M. Czaun, R. B. May, G. K. S. Prakash, G. A. Olah and S. R. Narayanan, J. Am. Chem. Soc., 2011, 133, 20164–20167 CrossRef CAS PubMed.
- Y. Kuwahara, D. Y. Kang, J. R. Copeland, N. A. Brunelli, S. A. Didas, P. Bollini, C. Sievers, T. Kamegawa, H. Yamashita and C. W. Jones, J. Am. Chem. Soc., 2012, 134, 10757–10760 CrossRef CAS PubMed.
- Y. Belmabkhout, R. S. Guerrero and A. Sayari, Adsorption, 2011, 17, 395–401 CrossRef CAS.
- A. Sayari, Y. Belmabkhout and R. S. Guerrero, Chem. Eng. J., 2011, 171, 760–764 CrossRef CAS.
- S. Dasgupta, A. Nanoti, P. Gupta, D. Jena, A. N. Goswami and M. O. Garg, Sep. Sci. Technol., 2009, 44, 3973–3983 CrossRef CAS.
- Y. Lin, Q. J. Yan, C. Kong and L. Chen, Sci. Rep., 2013, 3, 1859–1866 Search PubMed.
- T. M. McDonald, W. R. Lee, J. A. Mason, B. M. Wiers, C. S. Hong and J. R. Long, J. Am. Chem. Soc., 2012, 134, 7056–7065 CrossRef CAS PubMed.
- Q. Yan, Y. Lin, C. Kong and L. Chen, Chem. Commun., 2013, 49, 6873–6875 RSC.
- W. Chaikittisilp, R. Khunsupat, T. T. Chen and C. W. Jones, Ind. Eng. Chem. Res., 2011, 50, 14203–14210 CrossRef CAS.
- Y. Lin, H. Lin, H. Wang, Y. Suo, B. Li, C. Kong and L. Chen, J. Mater. Chem. A, 2014, 2, 14658–14665 CAS.
- K. Schlichte, T. Kratzke and S. Kaskel, Microporous Mesoporous Mater., 2004, 73, 81–88 CrossRef CAS.
- J. L. C. Rowsell and O. M. Yaghi, J. Am. Chem. Soc., 2006, 128, 1304–1315 CrossRef CAS PubMed.
- M. J. Ingleson, R. Heck, J. A. Gould and M. J. Rosseinsky, Inorg. Chem., 2009, 48, 9986–9988 CrossRef CAS PubMed.
- Y. Cai, Y. Zhang, Y. Huang, S. R. Marder and K. S. Walton, Cryst. Growth Des., 2012, 12, 3709–3713 CAS.
- K. Peikert, F. Hoffmann and M. Froba, Chem. Commun., 2012, 48, 11196–11198 RSC.
- C. Montoro, E. Garcia, S. Calero, M. A. P. Fernandez, A. L. Lopez, E. Barea and J. A. R. Navarro, J. Mater. Chem., 2012, 22, 10155–10158 RSC.
- A. Sayari, Y. Belmabkhout and E. Daan, Langmuir, 2012, 28, 4241–4247 CrossRef CAS PubMed.
- S. S.-Y. Chui, S. M.-F. Lo, J. P. H. Charmant, A. G. Orpen and I. D. Williams, Science, 1999, 283, 1148–1150 CrossRef CAS PubMed.
- J. Liu, J. T. Culp, S. Natesakhawat, B. C. Bockrath, B. Zande, S. G. Sankar, G. Garberoglio and J. K. Johnson, J. Phys. Chem. C, 2007, 111, 9305–9313 CAS.
- B. Panella, M. Hirscher, H. Pütter and U. Müller, Adv. Funct. Mater., 2006, 16, 520–524 CrossRef CAS.
- K. Li, J. Jiang, S. Tian, F. Yan and X. Chen, J. Mater. Chem. A, 2015, 3, 2166–2175 CAS.
- C. H. Yu, C. H. Huang and C. S. Tan, Aerosol Air Qual. Res., 2012, 12, 745–769 CAS.
Footnote |
| † Electronic supplementary information (ESI) available: TEM-elemental mapping and TEM-EDX images. See DOI: 10.1039/c6ra10465g |
| This journal is © The Royal Society of Chemistry 2016 |