Auto-accelerating and auto-inhibiting phenomena in the oxidation process of organic contaminants by permanganate and manganese dioxide under acidic conditions: effects of manganese intermediates/products

Bo Suna, Dandan Raob, Yuhai Sunc and Xiaohong Guan*ab
aState Key Laboratory of Urban Water Resource and Environment, Harbin Institute of Technology, Harbin 150090, People's Republic of China. E-mail: hitgxh@126.com; sunbo880628@163.com; Tel: +86 21 65980956
bState Key Laboratory of Pollution Control and Resources Reuse, College of Environmental Science and Engineering, Tongji University, Shanghai 20092, People's Republic of China. E-mail: 541502729@qq.com
cSinopec Shengli Oilfield Engineering Technology Research Institute, Dongying 257000, People's Republic of China. E-mail: sunyuhai0536@163.com

Received 20th April 2016 , Accepted 12th June 2016

First published on 21st June 2016


Abstract

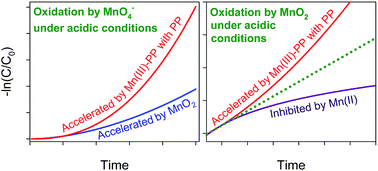
Considering the confused/controversial kinetics law of organic contaminant oxidation by permanganate (MnO4) and manganese dioxide (MnO2) under acidic conditions, this study was conducted to systematically investigate the oxidation kinetics and mechanisms of contaminants by MnO4 and MnO2 under acidic conditions. The process of phenol oxidation by MnO4 showed an auto-accelerating trend at pH 2.0–6.0, which was mainly associated with the generation of MnO2, an oxidant more active than MnO4 under acidic conditions. However, an auto-inhibiting trend was observed during phenol oxidation by MnO2, which could be ascribed to the generation of Mn(II) and its subsequent adsorption on the surface of MnO2. The presence of excessive pyrophosphate (PP) greatly accelerated the oxidation of phenol by MnO4 and MnO2 under acidic conditions due to the generation and accumulation of highly reactive Mn(III)–PP. The presence of PP also changed the manganese species at equilibrium from MnO2 and Mn(II) to Mn(III)–PP, respectively, in the processes of organic contaminant oxidation by MnO4 and MnO2. In short, the reduction products of MnO4 and MnO2 determined the auto-accelerating or auto-inhibiting phenomenon observed in the process of phenol oxidation by MnO4 and MnO2.


1. Introduction

Water is valuable and crucial to all living organisms and for multiple human activities.1 However, various synthetic organic compounds, used by society in vast quantities for a range of purposes, have been detected in water with negative impact on water quality.1–8 Oxidation is a widely used method for removing organic contaminants from water. Various chemical oxidants, such as chlorine,9 ozone,10 ferrate,11 chlorine dioxide,12 Fenton reagent13 and permanganate (MnO4),14 can be applied for the transformation/elimination of the undesired organic contaminants. Chlorine is one of the most commonly used disinfectants for drinking water and wastewater treatment.15 Unfortunately, chlorination generates chlorinated disinfection byproducts which are associated with cancer, particularly bladder and rectal cancer.16,17 The application of ozone in water treatment is also widespread for disinfection and oxidation.18 However, ozonation suffers from the potential formation of the carcinogenic brominated byproducts when bromide is present in water.19,20 Ferrate is an environmentally friendly oxidant which can effectively remove the organic contaminants containing electron-rich moieties.21,22 Nonetheless, ferrate is very instable in water and difficult to be prepared and stored, which limits its field treatment application. The application of chlorine dioxide has the risk of chlorate generation despite of its efficient transformation of various contaminants.23 By generating highly reactive hydroxyl radicals, Fenton reagent can eliminate a variety of organic pollutants with different moeities. However, the application of Fenton reagent is limited by its narrow applicable pH range (2.0–4.0) and the negative effects of HCO3 and humic acid, which are commonly present in water and can consume hydroxyl radical and decrease the effectiveness of Fenton oxidant.24 Another alternative technology for the oxidative removal of organic contaminants is the application of manganese oxidants, which can address many concerns of above-mentioned methods.25

Compared with other oxidants, MnO4, as a green oxidant,26 is preferred for its attractive characteristics of easy handling, relatively low cost, effectiveness, comparative stability over a wide pH range, and non-formation of halogenated byproducts.27 It has been already widely used for controlling dissolved manganese, taste/odor/color, and biological growth.25,28–30 MnO4 has also been proved to be a promising technology for oxidative removal of various phenolic compounds (bisphenol A, triclosan, estrone, 17β-estradiol, estriol, chlorophenols, bromophenols, etc.),31–35 and other organic chemicals that contain electron-rich moieties, including olefin, amino, thiol, ether, aldehyde, and ketone groups.25,36 Another common manganese oxidant, manganese dioxide (MnO2) has been demonstrated to be efficient in degrading various organic compounds including antibiotics,37,38 anilines,39 phenol,40 steroid estrogens,41 etc. In addition, MnO2 can act as coagulant aid to improve the performance of coagulation and filtration process or as adsorbent to further remove the constituents of concern.29,40,42

Although manganese oxides have been widely applied as oxidants, the oxidation kinetics of organic contaminants by manganese oxides are variable under different conditions.34,35 Generally, the pH-rate profile of MnO4 oxidation has three regions including an acid-catalyzed reaction at pH ≤ 5.0, an uncatalyzed reaction in the pH range of 6.0–9.0, and a base-catalyzed reaction at pH ≥ 10.0.43 However, the reaction mechanisms of MnO4 oxidation under acidic conditions remain controversy or obscure. Bahrami et al. showed the delayed auto-catalytic kinetics of glycine, L-alanine and L-leucine oxidation by MnO4 in strong acidic media, which was ascribed to the accumulation of Mn(II).44 Perez-Benito et al. also reported the auto-catalytic oxidation of glycine, L-alanine and L-leucine by MnO4 but they concluded that the reactions were auto-catalyzed by colloidal MnO2.45 Jáky et al.37 and Wiberg et al.46 observed that oxidation of acetylacetone and aromatic aldehydes by MnO4 was acid-catalyzed in acidic media. Pimienta et al.47 elaborated that the reduction of MnO4 by oxalic acid in sulfuric acid medium could be well described by a model incorporating the specific reactivities of MnO4 and of various Mn(III) and Mn(IV) reaction intermediates. Compared to MnO4, less information on the kinetics of organic contaminants oxidation by MnO2 was available. It is well known that pH significantly influences the activity of MnO2 towards contaminants with higher reaction rate at lower pH.38,48 However, the rate law of contaminants degradation by MnO2 was unclear under different conditions which deserved further study. In water and wastewater, many constituents, such as pyrophosphate (PP), phosphate, ethylene diamine tetraacetic acid (EDTA), and humic acid, can act as ligands to stablize Mn(III) and thus may change the balance of manganese species and influence the oxidation of contaminants accordingly.32 Therefore, it is also necessary to investigate the degradation law of contaminants by manganese oxides in the presence of ligands.

In short, the objectives of this study were to investigate the kinetics of organic contaminant oxidation by MnO4 and MnO2 under acidic conditions and explore the mechanisms behind the different kinetic behaviors. Phenol was selected as the major probe contaminant in this study because of the wide existence of phenolic hydroxyl group in some environmentally topical endocrine disrupting chemicals that have been frequently detected in surface waters.49,50

2. Experimental section

2.1. Materials

Potassium permanganate (GR grade), sodium thiosulfate pentahydrate (GR grade) and phenol (99% pure) were purchased from the Tianjin Chemical Reagent Co., Ltd. (Tianjin, China). Sodium pyrophosphate (PP, AR grade) was supplied by the Sinopharm Chemical Reagent Co., Ltd. (Shanghai, China). Aniline (99% pure) was purchased from Sigma-Aldrich (St. Louis, MO, USA), and methanol (99.9% pure) was supplied by Merck KgaA (Germany). All chemicals were used as received.

The KMnO4 crystal was dissolved in Milli-Q water to make a 50 mM stock solution. The stock solutions of phenol (1.0 mM), Na2S2O3 (100.0 mM), and Na4P2O7 (50.0 mM) were prepared in Milli-Q water every day. A stable colloidal MnO2 stock solution was prepared freshly before use following the procedure in the literature51 by mixing the appropriate amounts of MnO4 and Na2S2O3 stock solutions.

The stock solution of Mn(III)–PP was prepared following the procedure reported in the literature.52,53 In brief, sodium pyrophosphate decahydrate was dissolved in water to reach a 50 mM PP final concentration and the pH was adjusted to 8.2 with HCl/NaOH, then manganese(III) acetate dihydrate solid was slowly added to the PP solution during vigorous stirring to reach a final concentration of 10 mM Mn(III). pH of the obtained solution was adjusted to 7.0 to ensure the stability of working solution against disproportionation.

2.2. Batch experiments

The kinetic experiments were conducted in 0.25 L brown glass bottles at 25.0 ± 1.0 °C. Sodium acetate (1 mM) was used as a buffer for the reactions at pH ≤ 6.0, while sodium borate (10 mM) was employed for those at pH ≥ 8.0. However, no buffer was used for the experiments conducted at pH 7.0, which was kept constant at 7.0 ± 0.1 during the reactions with the addition of HCl or NaOH if necessary. The negligible effects of acetate and borate buffers on these reactions have been discussed previously.34,54,55 Reactions were initiated by quickly spiking excess KMnO4, MnO2 or Mn(III)–PP into the solutions containing phenol/aniline while they were being stirred. The total reaction time was determined depending on the removal of contaminant. Periodically, 15 mL of sample was rapidly transferred into a 25 mL beaker, immediately quenched with 100 μL of a sodium thiosulfate stock solution,56 filtered with a 0.22 μm membrane, and quickly collected into sample vials for subsequent analysis. All experiments were performed at least in duplicate and the average value was reported unless otherwise noted.

2.3. Chemical analysis

A pH meter with a saturated KCl solution as the electrolyte was used to measure solution pH. Daily calibration with proper buffer solutions (pH 4.00, 6.86, and 9.18) was performed to ensure its accuracy. The concentrations of phenols and aniline were analyzed by an ultraperformance liquid chromatograph (waters ACQUITY UPLC H-Class), consisted of quaternary solvent manager (QSM), a sample manager (FTM) and a UV-visible detector (TUV). Separation was accomplished with a UPLC BEH C 18 column (2.1 × 50 mm, 1.7 μm; Waters) at 35 ± 1 °C. The flow rate was 0.4 mL min−1 and the largest volume injection was 10 μL. The mobile phase of methanol–0.1% formic acid aqueous solution and methanol aqueous solution were used to for phenol and aniline separation, respectively. Concentrations of phenol and aniline were determined by comparing the peak area at 273 nm and Ex/Em = 232 nm/329 nm with that of the corresponding standards, respectively. The spectral changes during the oxidation of phenol by MnO4 were monitored in the range of 250–800 nm in a thermostated cell compartment using Purkinje TU-1902 automatic scanning UV-vis spectrophotometers with wavelength program controllers.

3. Results and discussion

3.1. The auto-accelerating phenomenon in contaminants oxidation by MnO4 under acidic conditions

Fig. 1 showed the time course of phenol oxidation by MnO4 over the pH range of 2.0–9.0, where the initial concentrations of phenol and MnO4 were 5 and 50 μM, respectively. Obviously, the oxidation kinetics of phenol displays auto-acceleration at pH ≤ 6.0 with higher oxidation rate at lower pH. To verify that the auto-accelerating behavior of MnO4 oxidation under acidic conditions was not limited to phenol, the kinetics of aniline oxidation by MnO4 at pH 4.5 was also determined, as demonstrated in Fig. S1. The oxidation of aniline by MnO4 at pH 4.5 also exhibited the characteristics of auto-acceleration. Furthermore, the auto-accelerating behavior had been reported in the oxidation of triclosan,31 Mn(II),57 α-amino acids, acetylacetone,58 and aromatic aldehydes59 by MnO4. Thus, the auto-accelerating reaction was irrelevant to the property of reductants but associated with the intrinsic characteristics of oxidation reactions involving MnO4 under acidic conditions. Fig. 1 also reveals that the loss of phenol follows the pseudo-first-order kinetics with MnO4 in 10-fold excess at pH 6.5–9.0, although the degradation rate of phenol changes with pH. The oxidation kinetics of aniline at pH 8.0 (Fig. S2) and triclosan at pH 7.0[thin space (1/6-em)]31 further demonstrated that the decomposition of organic contaminants by MnO4 followed pseudo-first-order rate law with MnO4 in 10-fold excess under neutral and near-neutral conditions. The different oxidation kinetic behaviors over different pH ranges indicated different mechanisms of MnO4 oxidation.
image file: c6ra10196h-f1.tif
Fig. 1 Oxidation kinetics of phenol by KMnO4 over the pH range of 2.0–9.0. Experimental conditions: [phenol]0 = 5.0 μM, [KMnO4]0 = 50 μM.

The gradual increase of the contaminant oxidation rate with time under acidic conditions indicated that the reduction product or intermediates of MnO4 accelerated contaminant oxidation. Jáky et al.58 and Wiberg et al.59 reported that the auto-acceleration of contaminant oxidation by MnO4 was ascribed to the presence of H+. Undoubtedly, the concentration of H+ was a crucial factor affecting the occurrence of auto-catalysis since auto-catalysis was only observed at pH 2.0–6.0, as shown in Fig. 1. Moreover, the rate of phenol oxidation increased with decreasing pH over the pH range of pH 2.0–6.0, indicating that phenol oxidation by permanganate was favored by H+. However, if the reaction was catalyzed by H+, the auto-acceleration of phenol and aniline oxidation by MnO4 would not be observed science the H+ concentration was kept constant during reaction. Therefore, H+ might mainly influence the generation and properties of the reduction products of MnO4 which resulted in the auto-acceleration of contaminant oxidation.

To identify the species responsible for the auto-acceleration, the change of the UV-vis spectra at 250–800 nm (where phenol and its oxidation products absorbed negligibly) during the course of the reaction between MnO4 and phenol over the pH range of 2.0–9.0 was monitored, as shown in Fig. 2. Under acidic conditions, the absorbance at 418 nm gradually increased accompanying with the oxidation of phenol by MnO4, indicating the generation of MnO2.60 To clarify the role of MnO2 in the process of MnO4 oxidation, the experiments on phenol oxidation by colloidal MnO2 under different conditions were conducted. As shown in Fig. 3, phenol could be oxidized by colloidal MnO2 with greater rates than by MnO4 at pH 3.0 and 5.0, suggesting the highly oxidative activity of MnO2 under this condition. Therefore, the auto-accelerated behavior of phenol oxidation by MnO4 at pH 2.0–6.0 should be mainly ascribed to the generation and accumulation of MnO2 in this process, which was more reactive than MnO4 and would lead to an increasing phenol oxidation rate with time. However, the reactivity of colloidal MnO2 dropped considerably with increasing pH and was much lower than MnO4 at pH > 6.0, as shown in Fig. 1 and 3C, which accounted for the disappearance of auto-acceleration behavior under near-neutral conditions.


image file: c6ra10196h-f2.tif
Fig. 2 Variation of the UV-vis spectra during the course of the reaction between KMnO4 and phenol at different pH. Experimental conditions: [phenol]0 = 5.0 μM, [KMnO4]0 = 50 μM.

image file: c6ra10196h-f3.tif
Fig. 3 Oxidation kinetics of phenol by colloidal MnO2 (A) at pH 3.0, (B) at pH 5.0, (C) at pH 8.0. Experimental conditions: [phenol]0 = 5.0 μM, [MnO2]0 = 50 μM.

To gain additional insight into the role of MnO2 in accelerating contaminant oxidation by MnO4, the kinetics of phenol oxidation by MnO4 in the presence of excessive MnO2 was determined. As shown in Fig. 4, although the dosing of colloidal MnO2 greatly accelerated phenol degradation by MnO4 at pH 5.0, the auto-acceleration of phenol oxidation in this process was not observed. The enhanced phenol oxidation by MnO4 should be mainly ascribed to the oxidative ability of colloidal MnO2 under this condition. However, the added MnO2 promoted the degradation of phenol from the very beginning and masked the contribution of MnO2 in situ generated from MnO4 reduction. Therefore, it could be concluded that it was the accumulation of in situ formed MnO2 leading to the auto-acceleration of phenol oxidation by MnO4 at pH 2.0–6.0.


image file: c6ra10196h-f4.tif
Fig. 4 Oxidation kinetics of phenol by KMnO4 + colloidal MnO2 at pH 5.0. Experimental conditions: [phenol]0 = 5.0 μM, [MnO2]0 = 50 μM, [KMnO4]0 = 50 μM.

Based on the proposed degradation mechanisms of phenol by permanganate under acidic conditions, the degradation rate of phenol can be expressed as follows:

 
image file: c6ra10196h-t1.tif(1)
where k1 and k2 are the second-order rate constants of phenol oxidation by permanganate and in situ formed manganese dioxide, respectively. [MnO4]0 is the initial concentration of MnO4, which was assumed to be constant during the reaction because it is dosed in large excess. [MnO2]t is the concentration of MnO2 at time t. The concentration of MnO2 increases with the proceeding of the reaction, resulting in the gradual increase in the oxidation rate of phenol under acidic condition. The excellent correlation of MnO2 concentration with the increase in the phenol oxidation rate, as shown in Fig. S3, verifies the acceleration of phenol oxidation by the in situ generated MnO2.

3.2. The auto-inhibiting phenomenon in phenol oxidation by MnO2

As revealed by Fig. 3, increasing pH from 3.0 to 8.0 resulted in a great decrease in phenol oxidation by MnO2, which should be mainly ascribed to the drop in the redox potential of MnO2/Mn2+ with increasing pH and the decrease in the adsorption of phenol on colloidal MnO2.61 Another obvious trend demonstrated by Fig. 3 is that the removal rate of phenol by MnO2 decreased with time over the pH range of 3.0–8.0. Fig. S4 shows that the absorbance of colloidal MnO2 at 418 nm dropped negligibly, indicating that the auto-inhibiting behavior of phenol oxidation by MnO2 was not associated with the large consumption of MnO2. Previous studies demonstrated that cations could be absorbed by MnO2 and influence the surface characteristics and oxidation properties of MnO2.38,62 Mn(II), the product of MnO2 reduction, might be absorbed on the colloidal MnO2 and inhibit the oxidation of phenol by MnO2, which is a surface-mediated reaction. Therefore, the influence of Mn(II) on the oxidation kinetics of phenol by colloidal MnO2 was examined at pH 3.0 and shown in Fig. 5. As expected, the oxidation of phenol by colloidal MnO2 was retarded by dosing Mn(II) before the initiation of reaction. Furthermore, the auto-inhibiting phenomenon in the process of phenol oxidation by MnO2 disappeared in the presence of supplementary Mn(II). This should be ascribed to the fact that the amount of Mn(II) dosed to the solution was much greater than that generated during reaction and thus masked the inhibiting effect of Mn(II) generated during phenol oxidation by MnO2. In short, Mn(II) negatively affected the oxidative activity of MnO2 because of its adsorption of on the surface of MnO2 and occupation of the surface sites of MnO2.
image file: c6ra10196h-f5.tif
Fig. 5 Influence of Mn(II) on the oxidation kinetics of phenol by colloidal MnO2 at pH 3.0. Experimental conditions: [phenol]0 = 5.0 μM, [MnO2]0 = 50 μM.

3.3. Auto-accelerating of phenol oxidation by MnO2 in the presence of PP

Surprisingly, the auto-inhibiting trend of phenol oxidation by MnO2 disappeared but an auto-accelerating behavior was observed in the presence of PP at pH 3.0, as illustrated in Fig. 6A. PP was known as the ligands which could form strong complexes with Mn(III) (Mn(III)–PP) and stabilize Mn(III).53,63 The conditional stability constants for Mn(III) complexes reported in the literature was listed as follows,63
 
Mn(III) + PP ⇔ Mn(III)–PP, K = 1031.35 (at pH 8.0) (2)

image file: c6ra10196h-f6.tif
Fig. 6 (A) Oxidation kinetics of phenol by colloidal MnO2 in the presence of PP at pH 3.0. (B) Absorbance at 418 nm vs. absorbance at 258 nm for the reduction of MnO2 by phenol in the presence of PP at pH 3.0. Experimental conditions: [phenol]0 = 5.0 μM, [MnO2]0 = 50 μM, [PP]0 = 5 mM.

Mn(III) stabilized by PP, Mn(III)–PP, has an absorbance peak at 258 nm, which was commonly used in studies on the role of Mn(III) in various processes.63 Fig. S5 shows the change of the absorbance at 418 nm, the characteristic absorbance of colloidal MnO2, and 258 nm with reaction time during phenol oxidation by MnO2 in the presence of PP. Compared to the case without PP (Fig. S4), much more MnO2 was reduced due to the presence of PP. To determine the balance of manganese species, the linear relationship between the absorbance at 418 nm and 258 nm was constructed as follows.

Since the Mn(III)–PP complex absorbs negligibly at 418 nm,60 one can express the absorbance at 418 nm as:

 
image file: c6ra10196h-t2.tif(3)
where image file: c6ra10196h-t3.tif is the molar absorptivity of MnO2 at 418 nm and ct is the concentration of MnO2 at time t.

Since both MnO2 and Mn(III)–PP absorb at 258 nm, the absorbance at this wavelength is given by eqn (4):

 
image file: c6ra10196h-t4.tif(4)
where image file: c6ra10196h-t5.tif and image file: c6ra10196h-t6.tif are the molar absorptivities of MnO2 and Mn(III)–PP at 258 nm, respectively. c0 is the initial MnO2 concentration. Based on eqn (3) and (4), it is easy to deduce:
 
image file: c6ra10196h-t7.tif(5)

The excellent linearity of A418 with A258, as shown in Fig. 6B, suggesting the negligible accumulation of Mn(II) during phenol oxidation by MnO2 in the presence of PP. The oxidation rate of phenol by MnO2 in the presence of PP did not drop with time (Fig. 6A), further confirming the negligible accumulation of Mn(II). Moreover, the dosing of PP greatly enhanced phenol oxidation by MnO2, which should be associated with the high reactivity of Mn(III)–PP, as demonstrated in Fig. 7. Therefore, the presence of PP changes the manganese transformation route during phenol oxidation by MnO2. Without the presence of PP, MnO2 was reduced to Mn(II) ions, which tend to decrease the reactivity of MnO2. However, in the presence of excessive PP, MnO2 was reduced to Mn(III)–PP. Mn(III)–PP was much more reactive than colloidal MnO2 at pH 3.0 (Fig. 3A and 7), resulting in an increase in the oxidation rate of phenol by colloidal MnO2 with time in the presence of excessive PP.


image file: c6ra10196h-f7.tif
Fig. 7 Oxidation kinetics of phenol by Mn(III)–PP complex at pH 3.0. Experimental conditions: [phenol]0 = 5.0 μM, [Mn(III)–PP]0 = 50 μM, [PP]0 = 5 mM.

Similarly to phenol oxidation by MnO2 (Fig. 3), a gradual decrease in the rate of phenol oxidation by Mn(III)–PP was observed (Fig. 7). Compared to MnO2 and MnO4, more Mn(III)–PP was needed to oxidize the same amount of contaminants as one Mn(III)–PP molecule could only transfer one electron. Fig. S6 showed the significant decrease of Mn(III)–PP concentration during phenol oxidation, resulting in the decrease of oxidation rate of phenol with time by Mn(III)–PP.

Based on the above discussion, the oxidation rate of phenol by manganese dioxide in the presence of PP under acidic conditions could be expressed as follows:

 
image file: c6ra10196h-t8.tif(6)
where k3 is the second-order rate constant of phenol oxidation by in situ formed Mn(III)–PP. The excellent correlation demonstrated in Fig. S7 further confirmed the rationality of the proposed mechanisms that the acceleration of phenol oxidation by manganese dioxide in the presence of PP under acidic conditions was mainly attributed to the generation of Mn(III)–PP.

3.4. Auto-acceleration of phenol oxidation by MnO4 in the presence of PP

The influence of PP on the oxidation of phenol by MnO4 at pH 3.0 is shown in Fig. 8A. Obviously, the decomposition of phenol displayed an auto-acceleration behavior since the reaction rate increased as the reaction progressed. Compared with the case without PP (Fig. 1), PP enhanced phenol oxidation significantly and shortened the reaction time over 10 times to achieve the removal of 99% phenol. The variation of UV absorbance at 525 nm (arising from MnO4), 418 nm (arising from MnO2), and 258 nm (arising from both MnO2 and Mn(III)–PP) with reaction time was monitored, as shown in Fig. S8. Fig. S8 indicated that the concentration of MnO4 decreased progressively while negligible MnO2 was generated since the absorbance at 418 nm was always very low throughout the reaction. However, the concentration of Mn(III)–PP increased during the reaction. Based on the consumption of MnO4 and the formation of Mn(III)–PP, the balance of manganese species was constructed following the methods of deriving eqn (2)–(4) and described as follows,
 
image file: c6ra10196h-t9.tif(7)
where image file: c6ra10196h-t10.tif and image file: c6ra10196h-t11.tif are the molar absorptivities of MnO4 and Mn(III)–PP at 258 nm, respectively. image file: c6ra10196h-t12.tif is the molar absorptivity of MnO4 at 525 nm, c0 is the initial MnO4 concentration, and ct is the concentration of MnO4 at time t. The excellent correlation of the absorbance at 525 nm and 258 nm (Fig. 8B) indicated that manganese mainly existed as MnO4 and Mn(III)–PP in the solution. Therefore, the higher activity of Mn(III)–PP towards phenol compared to MnO4 resulted in the auto-acceleration of phenol oxidation by MnO4 in the presence of excessive PP.

image file: c6ra10196h-f8.tif
Fig. 8 (A) Oxidation kinetics of phenol by KMnO4 in the presence of PP at pH 3.0. (B) Absorbance at 525 nm vs. absorbance at 258 nm for the reduction of permanganate by phenol in the presence of PP at pH 3.0. Experimental conditions: [phenol]0 = 5.0 μM, [KMnO4]0 = 50 μM, [PP]0 = 5 mM.

According to the above discussion, the oxidation rate of phenol by permanganate in the presence of PP under acidic conditions could be expressed as follows:

 
image file: c6ra10196h-t13.tif(8)

There is an excellent correlation between the concentration of generated Mn(III)–PP and the enhancement of phenol oxidation rate, as illustrated in Fig. S9, verifying the rationality of the proposed mechanisms that the in situ formed Mn(III)–PP was primarily responsible for the acceleration of phenol oxidation by permanganate in the presence of PP under acidic conditions. However, Mn(III) was quite unstable and easily disproportionated to Mn(II) and MnO2.64 Thus, the accumulation of Mn(III) was impossible to be responsible for the auto-acceleration of phenol oxidation by MnO4 in the absence of PP or other ligands. The only candidate for reactive intermediates that accounted for the auto-acceleration of contaminant oxidation by MnO4 in the absence of ligands is MnO2.

4. Conclusions

In this paper, the kinetic law of phenol oxidation by MnO4 and MnO2 was investigated in the presence and absence of PP under acidic conditions. Auto-acceleration was observed during phenol oxidation by MnO4 under acidic conditions due to the generation and accumulation of highly active MnO2. Conversely, an auto-inhibiting trend appeared in the oxidation of phenol by MnO2, resulting from the generation of Mn(II) and its subsequent absorption on the surface of colloidal MnO2. The oxidation of phenol by MnO4 and MnO2 was greatly enhanced in the presence of PP and the oxidation rate increased with time. The auto-accelerating phenomena in the process of phenol oxidation by MnO4 or MnO2 in the presence of excessive PP were mainly attributed to the generation and accumulation of Mn(III)–PP, which was much more reactive than MnO4 and MnO2 under acidic conditions. Considering the influence of in situ formed manganese intermediates on the degradation of contaminants by manganese oxides, it is a promising method to enhance the degradation of contaminants by promoting the generation of highly active manganese intermediates in water treatment.

Acknowledgements

This work was supported by the National Natural Science Foundation of China (Grant 21522704), the Major Science and Technology Program for Water Pollution Control and Treatment (2012ZX07403-001), and the Fundamental Research Funds for the Central Universities.

References

  1. M. O. Barbosa, N. F. F. Moreira, A. R. Ribeiro, M. F. R. Pereira and A. M. T. Silva, Water Res., 2016, 94, 257–279 CrossRef CAS PubMed.
  2. D. J. Lapworth, N. Baran, M. E. Stuart and R. S. Ward, Environ. Pollut., 2012, 163, 287–303 CrossRef CAS PubMed.
  3. A. Pal, Y. H. Gin, Y. C. Lin and M. Reinhard, Sci. Total Environ., 2010, 408, 6062–6069 CrossRef CAS PubMed.
  4. L. Yunho and V. G. Urs, Water Res., 2010, 44, 555–566 CrossRef PubMed.
  5. N. Warren, I. J. Allan, J. E. Carter, W. A. House and A. Parker, Appl. Geochem., 2003, 18, 159–194 CrossRef CAS.
  6. Z. Jing, S. Bo, X. M. Xiong, N. Y. Gao, W. H. Song, E. D. Du, X. H. Guan and G. M. Zhou, Water Res., 2014, 63, 262–270 CrossRef PubMed.
  7. S. D. Richardson and S. Y. Kimura, Anal. Chem., 2016, 88, 546–582 CrossRef CAS PubMed.
  8. C. P. Silva, M. Otero and V. Esteves, Environ. Pollut., 2012, 165, 38–58 CrossRef CAS PubMed.
  9. M. Deborde and U. von Gunten, Water Res., 2008, 42, 13–51 CrossRef CAS PubMed.
  10. O. Gimeno, M. Carbajo, F. J. Beltrán and F. J. Rivas, J. Hazard. Mater., 2005, 119, 99–108 CrossRef CAS PubMed.
  11. J. Q. Jiang and B. Lloyd, Water Res., 2002, 36, 1397–1408 CrossRef CAS PubMed.
  12. J. Hoigné and H. Bader, Water Res., 1994, 28, 45–55 CrossRef.
  13. A. Georgi, A. Schierz, U. Trommler, C. Horwitz, T. Collins and F.-D. Kopinke, Appl. Catal., B, 2007, 72, 26–36 CrossRef CAS.
  14. D. He, X. H. Guan, J. Ma, X. Yang and C. Cui, J. Hazard. Mater., 2010, 182, 681–688 CrossRef CAS PubMed.
  15. A. W. W. Association and R. D. Letterman, Water Quality and Treatment: A Handbook of Community Water Supplies, 1999 Search PubMed.
  16. K. P. Cantor, Am. J. Public Health, 1994, 84, 1211–1213 CrossRef CAS PubMed.
  17. R. D. Morris, A. M. Audet, I. F. Angelillo, T. C. Chalmers and F. Mosteller, Am. J. Public Health, 1992, 82, 955–963 CrossRef CAS PubMed.
  18. U. V. Gunten, Water Res., 2003, 37, 1443–1467 CrossRef.
  19. H. S. Kim, H. Yamada and H. Tsuno, Water Res., 2007, 41, 1441–1446 CrossRef CAS PubMed.
  20. H. Zhang, H. Yamada and H. Tsuno, Environ. Sci. Technol., 2008, 42, 3375–3380 CrossRef CAS PubMed.
  21. Y. Lee, J. Yoon and U. V. Gunten, Environ. Sci. Technol., 2005, 39, 8978–8984 CrossRef CAS PubMed.
  22. Y. Lee, S. G. Zimmermann, A. T. Kieu and U. V. Gunten, Environ. Sci. Technol., 2009, 43, 3831–3838 CrossRef CAS PubMed.
  23. G. Gordon, B. Slootmaekers, S. Tachiyashiki and D. W. Wood III, J.–Am. Water Works Assoc., 1990, 82, 160–165 CrossRef CAS.
  24. J. Choi, H. Lee, Y. Choi, S. Kim, S. Lee, W. Choi and J. Lee, Appl. Catal., B, 2014, 147, 8–16 CrossRef CAS.
  25. R. H. Waldemer and P. G. Tratnyek, Environ. Sci. Technol., 2006, 40, 1055–1061 CrossRef CAS PubMed.
  26. N. Singh and D. G. Lee, Org. Process Res. Dev., 2001, 5, 599–603 CrossRef CAS.
  27. E. Rodríguez, M. E. Majado, J. Meriluoto and J. L. Acero, Water Res., 2007, 41, 102–110 CrossRef PubMed.
  28. L. Hu, H. M. Martin, O. Arcs-Bulted, M. N. Sugihara, K. A. Keatlng and T. J. Strathmann, Environ. Sci. Technol., 2009, 43, 509–515 CrossRef CAS PubMed.
  29. J. Ma, N. Graham and G. Li, Adv. Appl. Probab., 1997, 46, 1–10 CAS.
  30. J. J. Chen and H. H. Yeh, Water Res., 2005, 39, 4420–4428 CrossRef CAS PubMed.
  31. J. Jiang, S. Y. Pang and J. Ma, Environ. Sci. Technol., 2009, 43, 8326–8331 CrossRef CAS PubMed.
  32. J. Jiang, S. Y. Pang and J. Ma, Environ. Sci. Technol., 2010, 44, 4270–4275 CrossRef CAS PubMed.
  33. J. Jiang, S. Y. Pang, J. Ma and H. Liu, Environ. Sci. Technol., 2012, 46, 1774–1781 CrossRef CAS PubMed.
  34. J. Du, B. Sun, J. Zhang and X. H. Guan, Environ. Sci. Technol., 2012, 46, 8860–8867 CrossRef CAS PubMed.
  35. J. Jiang, Y. Gao, S. Y. Pang, Q. Wang, X. L. Huangfu, Y. Liu and J. Ma, Environ. Sci. Technol., 2014, 48, 10850–10858 CrossRef CAS PubMed.
  36. J. W. Ladbury and C. F. Cullis, Chem. Rev., 1958, 58, 403–438 CrossRef CAS.
  37. M. Jaky, J. Szammer and E. Simon-Trompler, Int. J. Chem. Kinet., 2006, 38, 444–450 CrossRef CAS.
  38. C. K. Remucal, Environ. Sci.: Processes Impacts, 2014, 16, 1247–1266 Search PubMed.
  39. S. Laha and R. G. Luthy, Environ. Sci. Technol., 1990, 24, 363–373 CrossRef CAS.
  40. A. T. Stone, Environ. Sci. Technol., 1987, 21, 979–988 CrossRef CAS PubMed.
  41. L. Xu, C. Xu, M. Zhao, Y. Qiu and G. D. Sheng, Water Res., 2008, 42, 5038–5044 CrossRef CAS PubMed.
  42. H. Zhang and C. H. Huang, Environ. Sci. Technol., 2003, 37, 2421–2430 CrossRef CAS PubMed.
  43. K. B. Wiberg and F. Freeman, J. Org. Chem., 2000, 65, 573–576 CrossRef CAS PubMed.
  44. H. Bahrami and M. Zahedia, J. Iran. Chem. Soc., 2008, 5, 535–545 CrossRef CAS.
  45. J. F. Perez-Benito, J. Phys. Chem. A, 2011, 115, 9876–9885 CrossRef CAS PubMed.
  46. K. B. Wiberg and R. Stewart, J. Am. Chem. Soc., 1955, 77, 1786–1795 CrossRef CAS.
  47. V. Pimienta, D. Lavabre, G. Levy and J. C. Micheau, J. Phys. Chem., 1995, 99, 14365–14371 CrossRef CAS.
  48. B. Sun, J. Zhang, J. S. Du, J. L. Qiao and X. H. Guan, Environ. Sci. Technol., 2013, 47, 14332–14340 CrossRef CAS PubMed.
  49. D. W. Kolpin, E. T. Furlong, M. T. Meyer, E. M. Thurman, S. D. Zaugg, L. B. Barber and H. T. Buxton, Environ. Sci. Technol., 2002, 36, 1202–1211 CrossRef CAS PubMed.
  50. H. M. Kuch and K. Ballschmiter, Environ. Sci. Technol., 2001, 35, 3201–3206 CrossRef CAS PubMed.
  51. J. F. Perez-Benito, C. Arias and E. Amat, J. Colloid Interface Sci., 1996, 177, 288–297 CrossRef CAS.
  52. J. E. Kostka, G. W. L. Iii and K. H. Nealson, Geochim. Cosmochim. Acta, 1995, 59, 885–894 CAS.
  53. Z. Wang, W. Xiong, B. M. Tebo and D. E. Giammar, Environ. Sci. Technol., 2013, 48, 289–298 CrossRef PubMed.
  54. L. Hu, H. M. Martin and T. J. Strathmann, Environ. Sci. Technol., 2010, 44, 6416–6422 CrossRef CAS PubMed.
  55. T. Ogino, H. Yaezawa, O. Yoshida and M. Ono, Org. Biomol. Chem., 2003, 1, 2771–2776 Search PubMed.
  56. B. Sun, D. D. Rao, H. Y. Dong and X. H. Guan, RSC Adv., 2016, 6, 13335–13342 RSC.
  57. J. E. V. Benschoten, W. Lin and W. R. Knocke, Environ. Sci. Technol., 1992, 26, 1327–1333 CrossRef.
  58. M. Jáky, J. Szammer and E. Simon-Trompler, Int. J. Chem. Kinet., 2006, 38, 444–450 CrossRef.
  59. K. B. Wiberg and R. Stewart, J. Am. Chem. Soc., 1955, 77, 1786–1795 CrossRef CAS.
  60. B. Sun, X. H. Guan, J. Y. Fang and P. G. Tratnyek, Environ. Sci. Technol., 2015, 49, 12414–12421 CrossRef CAS PubMed.
  61. C. K. Remucal and M. Ginder-Vogel, Environ. Sci.: Processes Impacts, 2014, 16, 1247–1266 Search PubMed.
  62. Z. Ling and P. Pingan, J. Environ. Sci., 2008, 29, 972–977 Search PubMed.
  63. S. M. Webb, G. J. Dick, J. R. Bargar and B. M. Tebo, Proc. Natl. Acad. Sci. U. S. A., 2005, 102, 5558–5563 CrossRef CAS PubMed.
  64. K. S. Johnson, Science, 2006, 313, 1896–1897 CrossRef CAS PubMed.

Footnote

Electronic supplementary information (ESI) available. See DOI: 10.1039/c6ra10196h

This journal is © The Royal Society of Chemistry 2016
Click here to see how this site uses Cookies. View our privacy policy here.