
 Open Access Article
 This Open Access Article is licensed under a Creative Commons Attribution-Non Commercial 3.0 Unported Licence
Novel polystyrene-based nanocomposites by phosphorene dispersion†
Elisa
Passaglia
 *a,
Francesca
Cicogna
a,
Giulia
Lorenzetti
a,
Stefano
Legnaioli
a,
Maria
Caporali
b,
Manuel
Serrano-Ruiz
b,
Andrea
Ienco
b and
Maurizio
Peruzzini
b
*a,
Francesca
Cicogna
a,
Giulia
Lorenzetti
a,
Stefano
Legnaioli
a,
Maria
Caporali
b,
Manuel
Serrano-Ruiz
b,
Andrea
Ienco
b and
Maurizio
Peruzzini
b
aIstituto di Chimica dei Composti Organometallici (CNR-ICCOM), SS Pisa, Via Moruzzi 1, 56124 Pisa, Italy. E-mail: passaglia@pi.iccom.cnr.it
bIstituto di Chimica dei Composti Organometallici (CNR-ICCOM), Via Madonna del Piano 10, 50019 Sesto Fiorentino, Italy
First published on 27th May 2016
Abstract
Polystyrene-based phosphorene nanocomposites were prepared by a solvent blending procedure allowing the embedding of black phosphorus (BP) nanoflakes in the polymer matrix. Raman spectroscopy, X-ray Diffraction and TEM microscopy were employed to characterize the structural and morphological characteristics of the achieved hybrids, with the aim of evaluating the dispersion level of black phosphorus layers. TGA, DSC analysis as well as thermal oxidation and photo-degradation techniques were employed to investigate the thermal- and the photo-stability of the samples. The collected results showed evidence of better thermal and photostability of both the polymer matrix and dispersed layered phosphorus, suggesting really interesting polymer-nanofiller synergic effects ascribable to the presence and the good dispersion of the 2D-nanomaterial.
Introduction
Polymer nanocomposites developed by dispersing 2D nanostructured inorganic substrates are high performance materials exhibiting unusual property combinations and unique design possibilities.1 The ultimate performance improvements of these hybrids systems with respect to bulk behaviour of the matrices, are intrinsically due to the nano-scaled dispersion and distribution of fillers up to the limit of an extended and active organic–inorganic interface creating a new co-continuous nanostructured phase. Gains in mechanical and thermal behavior as well as new functional activities (gas and solvent permeability decrease, electrical and thermal conductivity, flame retardant capability, new optical features)2–6 rely to peculiar physicochemical and structural characteristics of the nanofiller whose properties can be transferred to polymer bulk and even magnified by tuning and driving the final peculiar morphologies.Phosphorene, the monolayer of black phosphorus (BP), is recognized as a 2D material of growing interest particularly for applications in electronics and optoelectronics. BP (the most stable allotrope of elemental phosphorus) is, in fact, built up by puckered honeycomb layers of phosphorus atoms, held together via weak van der Waals forces. It can be exfoliated generating phosphorene, which exhibits a unique 2D nanostructure with peculiar anisotropy.7 Owing to this characteristic, phosphorene possesses many intriguing properties. First, it is a semiconductor with thickness-dependent band gap: as the thickness decreases by exfoliation, the band gap gradually increases relying the nanosheets as ideal platform for electronic and optoelectronic devices.8,9 Phosphorene shows prominent electron transport capability and low thermal conductance10,11 both in the zig-zag and armchair lattice direction and has a really good thermal resistance,12 resulting in a very promising material for thermoelectric applications. It is more flexible than graphene or MoS2, with modulus values strongly depending on the structural anisotropy, opening the way to strain engineering applications.13 In addition, it has been recently demonstrated to be effective as photosensitizer for singlet oxygen generation with degradation to biocompatible phosphorus oxides, highlighting its therapeutic potential in medical treatment.14
One of the main drawbacks in the applications of few-layer black phosphorus (2D BP) is its intrinsic instability in ambient atmosphere, undergoing to severe degradation by moisture and oxygen upon prolonged air exposition. The formation of surface oxidised species is responsible for a measurable increase in surface roughness and degradation, with severe detriment of performances of phosphorene-based electronic devices that are prepared and measured in air.15,16 Different procedures and methodologies have been investigated to minimize the exposure to the atmosphere by encapsulating phosphorene with air-stable overlayers17,18 or, recently, by controlling the oxidation to deliberately engineer a stable native oxide protective layer.19
Despite the growing interest for 2D BP and its potentiality, no work has been published regarding the preparation and characterization of nanocomposites (NCs) containing BP nanolayers dispersed in a polymer matrix, owing presumably to its intrinsic lability during the commonly employed dispersion procedures in ambient conditions.
Therefore polystyrene (PS), one of the most plastic commodity and a polymer used as model to design NCs by modulating interfacial properties and interaction with layered nanofillers,20 is here chosen as matrix by considering the peculiar structural and electronic features of BP nanoflakes;16,21 phosphorene is, in fact, recognized as able to interact with both electrophilic and nucleophilic molecules22,23 and aromatic moieties.24
After liquid exfoliation of BP with DMSO, a simple solvent blending procedure is used to provide PS-based composites with 2D BP which are structurally and thermally characterized with the dual purpose to steer the use of phosphorene in the field of polymer nanocomposites and to preserve the structure and, then, the properties of this interesting nanofiller. With these purposes, after a structural and morphological characterization of the composites aimed at assessing the presence of polymer-embedded phosphorene layers, the effect of BP nanoflakes dispersion onto the bulk properties of PS are preliminary explored by DSC, TGA and OIT measurements. At the same time the photo-stability of both the polymer matrix and the dispersed BP nanolayers in the composites are investigated by IR and Raman spectroscopy after undergoing the samples to UV-induced degradation.
Experimental
Materials
DMSO grade anhydrous (≥99, 9%, Aldrich) CHCl3, acetone (>99%, Aldrich, HPLC grade) and MeOH (>98%, Aldrich) were used without purification.Atactic polystyrene with Mn = 86![[thin space (1/6-em)]](https://www.rsc.org/images/entities/char_2009.gif) 000 D and dispersity 2.5 (by SEC measurement, Repsol) was used without previous treatment.
000 D and dispersity 2.5 (by SEC measurement, Repsol) was used without previous treatment.
Samples preparation
Black phosphorus (BP) was prepared by heating in a muffle oven commercially available red phosphorus together with a tin-gold alloy and catalytic amount of SnI4 following a published procedure.25 The solids were charged in a quartz tube, that was then evacuated, sealed and put in the oven and heated up to 650 °C for three days. Afterwards, the cooling was very slow, with a rate of 0.1 °C min−1 to afford the formation of highly pure and crystalline material (average size of the crystallites: 2 mm × 3 mm). 2D BP was prepared by liquid exfoliation following a procedure derived from literature.26 In a typical run, microcrystalline black phosphorus (5.0 mg, 0.16 mmol) is transferred into a borosilicate tube (length = 300 mm, Øout = 15.0 mm; Øint = 11.3 mm). Dry and degassed DMSO (5.0 mL, pre-treated with molecular sieves 4 Å for 24 hours, to reach a final maximum water content of 580 ppm) was added and the tube was sealed under nitrogen. The suspension was sonicated in a Elmasonic P70H sonicator at 37 KHz for 120 hours, while keeping the bath temperature at 30 °C.Two batches containing the same concentration of 2D BP (5 mg 5 mL−1) and even a low fraction of layers of BP with a thickness between 30 nm to 70 nm were used as prepared to provide the composites samples named PS1 and PS2.
To analyse the dried 2D BP by Raman, TGA and TEM, a suspension containing 5 mg of 2D BP in 5 mL of dry DMSO was transferred in a vial and 20 mL of degassed acetone were added. The vial was put in the centrifuge for 90 minutes at 6000 rpm. Afterwards, the surnatant is removed and 15 mL of degassed acetone were added to the dark grey residue. After centrifugation for 90 minutes at 6000 rpm, the surnatant was thrown away and 15 mL of degassed acetone are added again. The final residue was dried under a stream of nitrogen and then under vacuum for a short time. The Raman spectroscopy confirmed the phosphorene structure while a typical TEM analysis of 2D BP showed that the single flakes and differently sized aggregates can be recognized in the dried sample26 (ESI, Fig. SF1 and SF2†).
The composites were prepared by a solvent intercalation procedure. Into a 250 mL two-necked round bottom flask, equipped with magnetic stirrer and previously degassed, backfilled three times with nitrogen and then left under nitrogen, 50 mL of CHCl3 and 0.5 g of PS were loaded. The solution was magnetically stirred for 10 min in a continuous stream of N2 until PS was completely dissolved. Under a N2 current, the DMSO 2D BP suspension was (dropwise) added. The mixture was left stirring under N2 for 15 min and then the mixing stopped. The flask content (a yellow/brown solution) was dropwise precipitated into 450 mL of MeOH. The polymer was then filtered, washed three times with 50 mL of MeOH and dried under vacuum till constant weight (see ESI SF3†). Two samples were prepared by using two batches of DMSO 2D BP suspension (samples PS1 and PS2).
For comparison purpose a blank experiment was carried out with the same methodology, without adding 2D BP suspension, providing the sample PS0.
The samples were compression molded (T = 180 °C, 10–20 Kg cm−2) by using a Carver bench model 4386 to obtain the films employed for all the characterizations (with constant and uniform thickness = 90–40 μm).
Photodegradation was studied by UV radiation at different exposure times on the films PS0 and PS1 by using UV-Vis camera (UvaCube400, 400 W, Hoenle) equipped with Hg lamp (high pressure Mercury Lamp with a power of 400 W: emittance230–285 = 15 mW cm−2; emittance330–400 = 11 mW cm−2; emittance380–500 = 35 mW cm−2). The samples were irradiated for 40–220 min from one side.
Characterization
The obtained films and the UV irradiated samples PS0 and PS1 were analysed by Raman spectroscopy using a Renishaw micro-Raman Invia instrument with a 50× lens. A Nd:YAG laser at λ = 532 nm wavelength was used as laser source.
Infrared spectra (FT-IR) and attenuated total reflectance (ATR) spectra of pristine and irradiated PS films were recorded by using SpectrumTwo instrument of Perkin-Elmer equipped with an ATR accessory with diamond crystal. Carbonyl index (CI) was calculated after normalizing the spectra with reference to the symmetric –CH2 stretching band at 2851 cm−1. Any baseline correction was applied.
X-Ray Diffraction (XRD) patterns of PS1 composite and BP exfoliated were acquired at room temperature with a PANalytical X'PERT PRO diffractometer, employing Cu Kα radiation (λ = 1.54187 Å) and a parabolic MPD-mirror for Cu radiation. The diagrams were acquired in a 2θ range between 5.0° and 60.0°, using a continuous scan mode with an acquisition step size of 0.0263° and a counting time of 150 s.
TEM characterization: images of the films were obtained using a Philips Instrument operating at an acceleration voltage 100 kV. First, a sample of PS1 film was enclosed in an epoxy resin, than the resulting disk was cut into thin lamellae which were deposited on the TEM copper grid.
Thermogravimetric (TG) analyses were carried out under nitrogen atmosphere using a Seiko EXSTAR 7200 TG/DTA instrument. TG curves were collected on samples of 1–5 mg in the temperature range from 30 to 700 °C (N2 flow = 200 mL min−1) with a heating rate of 10 °C min−1. The onset temperature of degradation (Tonset) is defined as the intercept to the two tangents before and after the degradation step. The rate inflection temperature for the main degradation step was extracted from derivative TG (DTG) curves.
Three fractions of PS1 and PS2 samples were analysed and the data provided as average numbers with related deviations.
The glass transition temperature (Tg) of PS composites was determined with DSC using a PerkinElmer DSC4000 equipped with intracooler and interfaced with Pyris software (version 9.0.2). Calibration was performed with indium and lead as standards. The range of temperatures investigated was 40–150 °C.
The oxidation induction onset temperature (OIT) was measured by heating the sample from 20 °C up to 350 °C with a heating rate of 20 °C min−1 and an oxygen heat flow of 60 mL min−1. The samples were always heated up to a maximum temperature that was at least 20 °C higher than the steepest point of the oxidation exothermic curve.27 The Toox was determined as the onset temperature of the oxidation curve outlined as the intercept point of extrapolated tangents from the baseline and the oxidation exotherm.
Results and discussion
The simple experimental methodology here proposed allowed producing composites (PS1 and PS2) that were structurally and thermally characterized in comparison to the blank sample (PS0). As result of solutions blending and co-precipitation approach, a grey brownish powder was obtained (see SF3 in ESI†), which were-easily filmed by compression moulding technique; this procedure provided transparent thin films with good uniformity and reproducibility (Fig. 1a). | ||
| Fig. 1 (a) Photos of films obtained by compression moulding of PS samples; (b) Raman spectra of PS composites (PS1 and PS2) and pristine matrix (PS0). | ||
Raman spectroscopy, which is an effective tool for evidencing the characteristic vibrational modes of BP due to its anisotropy in the direction to the planes,28 was used to highlight the presence of BP nanolayers in the collected samples.
The three peaks at about 360, 438 and 466 cm−1 in the Raman spectra of PS1 and PS2 samples were associated, respectively, with A1g, B2g, A2g, Raman modes in good agreement with those already reported for BP alone indicating that BP atomic layers are crystalline.28 These specific signals didn't change their respective intensity owing to flakes embedding in PS matrix (Fig. 1b) even if a slight blue shift was observed for PS1 sample presumably owing to the presence of thinner flake (bilayer).16,29 The peaks at 412 and 623 cm−1 visible in the Raman spectra of all samples can be ascribed to vibrational modes of PS matrix.30
XRD pattern of composite (PS1) among the broad signals due to the amorphous polymer matrix showed the diffraction peaks characteristic of exfoliated BP with high purity and crystallinity with a preferential orientation parallel to the a–b plane31 that was maintained upon dispersion in the PS matrix (Fig. 2).
 | ||
| Fig. 2 XRD diffraction paths of PS1 and starting exfoliated BP sample. | ||
This result definitely establishes that the methodology here adopted is suitable to incorporate BP nanoflakes into PS polymer matrix. Furthermore, based on the literature,32 a number of fractions of BP with piled phosphorene layers >10 were evidenced, suggesting the presence in the composites of multilayer phosphorene packed nanostructures.
TEM images (Fig. 3) showed mixed morphologies: single and really thin lamellae (see arrows in Fig. 3b) confirming the nanoflakes flexibility,13 as well as piled stacks with a few layers, were easily identified. In agreement with Raman results, it was evidenced that 2D BP maintained its crystalline and oriented structure,33 even embedded in the PS matrix.
 | ||
| Fig. 3 Bright-field TEM images of PS1 composite. Scale bar: 5 μm and 300 nm respectively. | ||
Therefore the procedure here adopted for composites preparation seemed to preserve the morphology of BP obtained by the liquid exfoliation methodology26 and no larger aggregates were observed suggesting the PS macromolecules able to replace DMSO molecules without altering the pristine exfoliation degree.
The thermal transitions of the composites with reference to the blank experiment were assessed by DSC and TGA analyses (Table 1 and ESI SF4 and SF5†).
| Sample | T g a (°C) | T onset b (°C) | T inf c (°C) |
|---|---|---|---|
| a Calculated onto the second heating scan. b Determined as intercept of the two tangents of degradation step. c Peak T of the DTG curved. (DSC and TGA curves of composites reported in ESI). | |||
| BP | — | 481 | 524 |
| 2D BP | — | 410 | 453 |
| PS0 | 99.3 | 382 ± 2 | 418 ± 1 |
| PS1 | 103.2 | 409 ± 4 | 435 ± 2 |
| PS2 | 102.9 | 415 ± 4 | 441 ± 2 |
The two composites showed very similar features, confirming their homogeneity and the reproducibility of the preparation methodology. By comparing the data with those of blank sample an increase of Tg values was observed and attributed to the mobility hindrance of chains segment due, presumably, to the setting-up of intercalated/exfoliated nanostructures where PS macromolecules interact at interface with more rigid phosphorene layers surface and/or are sterically confined between them. The interaction between the pz state of phosphorene and π state of aromatic moieties of polystyrene can be reasonably suggested34 as driving forces tuning the BP nanoflakes/aromatic rings stacking (at molecular level) as even proved by the morphological evidences.
In addition, a remarkable increase of the thermal stability of the composites samples (PS1 and PS2) was noticed: both Tonset and Tinf of bulk PS matrix were more than 25° shifted towards higher temperature following the phosphorene dispersion, suggesting an interesting thermal stabilization effect induced by the BP nanolayers, in spite of the low filler concentration (1% wt). This behaviour, which is generally well-recognized for nanocomposites containing 2D nanofillers (cationic and anionic clays, as well as graphene) dispersed in a huge variety of polymer phases,35–41 was here proved for the first time for composites with phosphorene. It would be presumably due to peculiar thermal conductance of 2D BP10,11 rather than its stability to thermal decomposition.12 The TGA analysis of both BP and 2D BP confirmed that the thermal stability of this phosphorus allotrope is between 410 °C and 480 °C, higher, as expected, for the not exfoliated substrate.
However, the barrier effect to heat and gases, particularly to oxygen, associated to the 2D BP morphological shape and aspect ratio can play a significant role.42
To deepen the evidence of thermal stabilization induced by phosphorene dispersion owing to some barrier effects, the evaluation of the oxidation onset temperature (Toox)27 by DSC was carried out. Films with the same thickness (90 μm) of composites and related blank sample (PS0) were analysed especially to investigate their thermal behaviour in the presence of oxygen (Fig. 4, inset table).
 | ||
| Fig. 4 Thermoanalytical oxidation induction temperature curves of PS0 and PS1 samples and thermal parameters calculated by repeating the analysis on three different film portions (Toox inset data). | ||
By heating in oxidative atmosphere, the polymer matrix and composites showed a good thermal stability till up to 220 °C. Tg is clearly higher for the PS1 sample, even in these experimental conditions.
By further raising the temperature, we collected clear evidence for the onset of the oxidation reaction temperature for both the samples: the thermal stability of the composite was significantly improved with respect to polymer matrix, and Toox was increased more than 20 °C, confirming the impressive stabilization effect induced by 2D BP dispersion particularly in the presence of oxygen (inset data in Fig. 4).
To better assess the composites stability in ambient conditions, the photo-degradation of the PS-based samples was studied by UV radiation: both PS0 and PS1 films were exposed to UV, simulating an accelerated light exposure in ambient conditions. The polymer samples were irradiated in air at room temperature at different times and the resulting films were analysed by ATR, FT-IR and Raman spectroscopy.
Upon two-month exposure in atmospheric environments at room temperature, the Raman spectrum of PS1 sample did not show any significant change with respect to the freshly collected sample (Fig. 5a, black curve). This suggests a very good stability of the BP flakes inside the polymer bulk, at least experiencing the ambient conditions. The Raman shifts diagnostic of the BP modes were lost after 3 hours of exposure time (Fig. 5a, pink curve), when also the polymer matrix was significantly degraded.
 | ||
| Fig. 5 (a) Raman spectra of PS1 film after 2 months of exposure to ambient atmosphere (black curve) and after irradiation with UV at different times (from red to pink curves); (b) films images before and after UV irradiation. | ||
In fact, first the toning from grey to yellow of the PS films (Fig. 5b) and, more compelling, the presence of carbonyl stretching in the FT-IR spectra for both the samples analysed (Fig. 6) confirmed the extensive oxidation of the polymer. Moreover, the matrix resulted partially insoluble to solvent used for preparing the composites and thus crosslinked, in agreement with the oxidation mechanism generally reported for polystyrene43 as accounted also by recent literature44
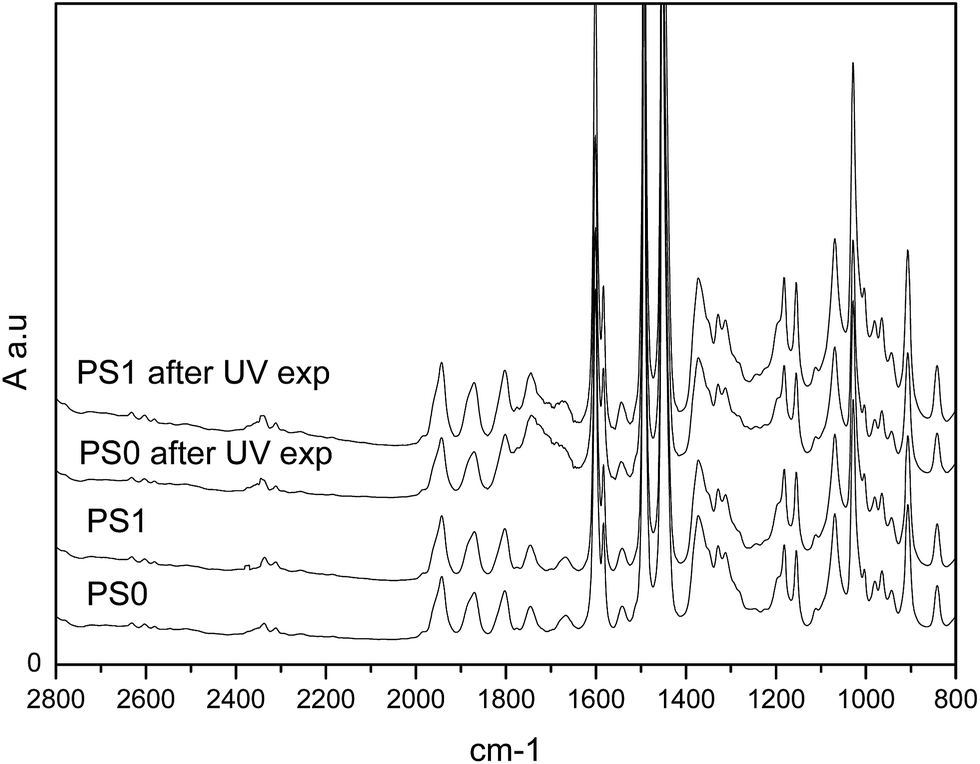 | ||
| Fig. 6 FT-IR spectra of PS0 and PS1 films before and after UV irradiation. | ||
The sample PS0 seemed extensively oxidised while fewer effects were apparently observed for PS1, whose spectrum changes are of smaller entity (see carbonyl stretching region from 2000 to 1500 cm−1 in Fig. 6). To corroborate this observation the carbonyl index (CI) was calculated as a measure of the progress of photo-degradation in the ATR spectra on the irradiated sides of the films (Table 2, see experimental part and ESI SF6† for examples of ATR spectra).
The calculated C.I. of un-treated PS0 and PS1 films, after normalization to the reference band, showed similar values. Instead, a meaningful lower value for UV-irradiated PS1 sample was evidenced, confirming the better stability of the composite containing phosphorene even to UV radiation. Even if an easy result's rationalization may invoke the oxygen diffusion hindrance by 2D BP layers dispersed in the PS bulk, we cannot exclude that the proved UV photoresponsivity of few-layer BP45 can play a significant role in preserving the polymer matrix, even in these conditions.
Conclusions
Polystyrene-based phosphorene nanocomposites were firstly prepared and characterized in terms of structural, morphological, thermal- and photo-oxidation features.Starting from solvent dispersion of BP nanoflakes,26 these nano structured substrate was embedded in the polymer matrix by preserving the pristine exfoliated morphology, without changing the preferential orientation of platelets and aspect ratio. This evidence suggests that the electronic interactions between PS and nanolayers are able to stabilize the dispersion degree of BP. Such kind of PS-based hybrids showed improved thermal stability, even in the presence of oxidative atmosphere as well as better resistance to photo-degradation. The results can be related to the establishing of effective synergic interactions between the PS chains and the dispersed few-layers BP, suitable and able to maintain the pristine 2D BP morphological characteristics and the related barrier effects that can be preliminary invoked to explain the assessed stability to oxygen. On the other hand, and also really important, once incorporated in the polymer, BP nanoflakes showed an improved stability even when the composites were stored in air, at room temperature in ambient conditions. These observations widen the application possibilities of this really promising nanofiller once polymer-coated, particularly in making easier the design of different devices (for optoelectronic applications and/or gas/chemical sensing). Studies are in progress in our laboratories to expand the nature of polymers capable of incorporating phosphorene and to better define the bulk properties of the phosphorene-based nanocomposites.
Acknowledgements
The authors thank the European Research Council for funding the project PHOSFUN “Phosphorene functionalization: a new platform for advanced multifunctional materials” (Grant Agreement No. 670173) through an ERC Advanced Grant to MP.References
- V. Mittal, Optimization of Polymer Nanocomposites Properties, John Wiley and Sons, WILEY-VCH, 2010 Search PubMed.
- F. Ciardelli, S. Coiai, E. Passaglia, A. Pucci and G. Ruggeri, Polym. Int., 2008, 57, 805–836 CrossRef CAS.
- V. Mittal, Macromol. Mater. Eng., 2014, 299, 906–931 CrossRef CAS.
- M. Farhoodi, Food Eng. Rev., 2016, 8, 35–51 CrossRef CAS.
- N. Cele and S. Ray, Macromol. Mater. Eng., 2009, 294, 719–738 CrossRef CAS.
- S. Coiai, E. Passaglia, A. Pucci and G. Ruggeri, Materials, 2015, 8, 3377–3427 CrossRef.
- L. Kou, C. Chen and S. C. Smith, J. Phys. Chem. Lett., 2015, 6, 2794–2805 CrossRef CAS PubMed.
- V. Tran, R. Soklaski, Y. Liang and L. Yang, Phys. Rev. B: Condens. Matter Mater. Phys., 2014, 89, 235319 CrossRef.
- H. Liu, Y. Du, Y. Deng and P. D. Ye, Chem. Soc. Rev., 2015, 44, 2732–2743 RSC.
- A. Jain and A. J. H. McGaughey, Sci. Rep., 2015, 5, 8501 CrossRef CAS PubMed.
- R. Fei, A. Faghaninia, R. Soklaski, J.-A. Yan, C. Lo and L. Yang, Nano Lett., 2014, 4, 6393–6399 CrossRef PubMed.
- X. Liu, J. D. Wood, K.-S. Chen, E. Cho and M. C. Hersam, J. Phys. Chem. Lett., 2015, 6, 773–778 CrossRef CAS PubMed.
- Q. We and X. Peng, Appl. Phys. Lett., 2015, 7, 9746–9751 Search PubMed.
- H. Wang, X. Yang, W. Shao, S. Chen, J. Xie, X. Zhang, J. Wang and Y. Xie, J. Am. Chem. Soc., 2015, 137, 11376–11382 CrossRef CAS PubMed.
- S. P. Koenig, R. A. Doganov, H. Schmidt, A. H. Castro Neto and B. Özyilmaz, Appl. Phys. Lett., 2014, 104, 103106–103109 CrossRef.
- A. Castellanos-Gomez, L. Vicarelli, E. Prada, J. O. Island, K. L. Narasimha-Acharya, S. I. Blanter, D. J. Groenendijk, M. Buscema, G. A. Steele, J. V. Alvarez, H. W. Zandbergen, J. J. Palacios and H. S. J. van der Zant, 2D Materials, 2014, 1, 025001 CrossRef.
- R. A. Doganov, E. C. T. O'Farrell, S. P. Koenig, Y. Yeo, A. Ziletti, A. Carvalho, D. K. Campbell, D. F. Coker, K. Watanabe, T. Taniguchi, A. H. Castro Neto and B. Öezyilmaz, Nat. Commun., 2015, 6, 6647–6653 CrossRef CAS PubMed.
- J. D. Wood, S. A. Wells, D. Jariwala, K.-S. Chen, E. Cho, V. K. Sangwan, X. Liu, L. J. Lauhon, T. J. Marks and M. C. Hersam, Nano Lett., 2014, 14, 6964–6970 CrossRef CAS PubMed.
- M. T. Edmonds, A. Tadich, A. Carvalho, A. Ziletti, K. M. O'Donnell, S. P. Koenig, D. F. Coker, B. Özyilmaz, A. H. Castro Neto and M. S. Fuhrer, ACS Appl. Mater. Interfaces, 2015, 7, 14557–14562 CAS.
- D. J. Carastan and N. R. Demarquette, Int. Mater. Rev., 2007, 52, 345–380 CrossRef CAS.
- S. Fukuoka, T. Taen and T. Osada, J. Phys. Soc. Jpn., 2015, 84, 121004 CrossRef.
- R. Zhang, B. Li and J. Yang, J. Phys. Chem. C, 2015, 119, 2871–2878 CAS.
- Y. He, F. Xia, Z. Shao, J. Zhao and J. Jie, J. Phys. Chem. Lett., 2015, 6, 4701–4710 CrossRef CAS PubMed.
- W. Zhao, Z. Xue, J. Wang, J. Jiang, X. Zhao and T. Mu, ACS Appl. Mater. Interfaces, 2015, 7, 27608–27612 CAS.
- T. Nilges, M. Kersting and T. Pfeifer, J. Solid State Chem., 2008, 181, 1707–1711 CrossRef CAS.
- M. Serrano-Ruiz, M. Caporali, A. Ienco, V. Piazza, S. Heun and M. Peruzzini, Adv. Mater. Interfaces, 2016, 3, 15000441 Search PubMed.
- W. W. Focke and I. van der Westhuizen, J. Therm. Anal. Calorim., 2010, 99, 285–293 CrossRef CAS.
- H. B. Ribeiro, M. A. Pimenta, C. J. S. de Matos, R. L. Moreira, A. S. Rodin, J. D. Zapata, E. A. T. de Souza and A. H. Castro Neto, ACS Nano, 2015, 9, 4270–4276 CrossRef CAS PubMed.
- Z. Guo, H. Zhang, S. Lu, Z. Wang, S. Tang, J. Shao, Z. Sun, H. Xie, H. Wang, X.-F. Yu and P. K. Chu, Adv. Funct. Mater., 2015, 25, 6996–7002 CrossRef CAS.
- J. R. Anema, A. G. Brolo, A. Felten and C. Bittencourt, J. Raman Spectrosc., 2010, 41, 745–751 CAS.
- L. Wang, Z. Sofer and M. Pimera, ChemElectroChem, 2015, 2, 324–327 CrossRef CAS.
- J. Sun, H.-W. Lee, M. Pasta, H. Yuan, G. Zheng, Y. Sun, Y. Cui and Y. Li, Nat. Nanotechnol., 2015, 10, 980–985 CrossRef CAS PubMed.
- J. Kang, J. D. Wood, S. A. Wells, J.-H. Lee, X. Liu, K.-S. Chen and M. C. Hersam, ACS Nano, 2015, 9, 3596–3604 CrossRef CAS PubMed.
- Y. Cai, G. Zhang and Y.-W. Zhang, J. Phys. Chem. C, 2015, 119, 13929–13936 CAS.
- S. Augier, S. Coiai, D. Pratelli, L. Conzatti and E. Passaglia, J. Nanosci. Nanotechnol., 2009, 9, 4858–4869 CrossRef CAS PubMed.
- S. Coiai, E. Passaglia, A. Hermann, S. Augier, D. Pratelli and R. C. Streller, Polym. Compos., 2010, 31, 744–754 CAS.
- N. Muksing, R. Magaraphan, S. Coiai and E. Passaglia, eXPRESS Polym. Lett., 2011, 5, 428–448 CrossRef CAS.
- S. Coiai, M. Scatto, L. Conzatti, F. Azzurri, L. Andreotti, E. Salmini, P. Stagnaro, A. Zanolin, F. Cicogna and E. Passaglia, Polym. Adv. Technol., 2011, 22, 2285–2294 CrossRef CAS.
- L. Pérez Amaro, S. Coiai, L. Conzatti, A. Manariti, F. Ciardelli and E. Passaglia, Polym. Int., 2011, 62, 554–565 CrossRef.
- G. Filippone, S. C. Carroccio, G. Curcuruto, E. Passaglia, C. Gambarotti and N. T. Dintcheva, Polymer, 2015, 73, 102–110 CrossRef CAS.
- D. G. Papageorgiou, I. A. Kinloch and R. J. Young, Carbon, 2015, 95, 460–484 CrossRef CAS.
- E. Passaglia, M. Bertoldo, F. Ciardelli, D. Prevosto and M. Lucchesi, Eur. Polym. J., 2008, 44, 1296–1308 CrossRef CAS.
- F. Bottino, A. R. Cinquegrani, G. Di Pasquale, L. Leonardi, A. Orestano and A. Pollicino, Polym. Test., 2004, 23, 779–789 CrossRef CAS.
- V. Mylläri, T.-P. Ruoko and S. Syrjälä, J. Appl. Polym. Sci., 2015, 132, 42246 Search PubMed.
- J. Wu, G. K. W. Koon, D. Xiang, C. Han, C. T. Toh, E. S. Kulakarni, A. I. Verzhbitskiy Carvalho, A. S. Rodin, S. P. Koenig, G. Eda, W. Chen, A. H. Castro Neto and B. Özyilmaz, ACS Nano, 2015, 9, 8070–8077 CrossRef CAS PubMed.
Footnote |
| † Electronic supplementary information (ESI) available. See DOI: 10.1039/c6ra10133j |
| This journal is © The Royal Society of Chemistry 2016 |