Detection and characterization of ponatinib reactive metabolites by liquid chromatography tandem mass spectrometry and elucidation of bioactivation pathways†
Adnan A. Kadia,
Hany W. Darwishab,
Mohamed W. Attwa*ab and
Sawsan M. Amera
aDepartment of Pharmaceutical Chemistry, College of Pharmacy, King Saud University, P.O. Box 2457, Riyadh, 11451, Kingdom of Saudi Arabia. E-mail: mzeidan@ksu.edu.sa; Fax: +966 1146 76 220; Tel: +966 1146 70237
bAnalytical Chemistry Department, Faculty of Pharmacy, Cairo University, Kasr El-Aini St., Cairo 11562, Egypt
First published on 25th July 2016
Abstract
Ponatinib (PNT), as a multi-targeted tyrosine kinase inhibitor, is active against T315I and other BCR-ABL mutants. PNT is registered in the U.S. and EU under the trade name of Iclusig®. The current study reports the identification and characterization of in vitro metabolites of PNT, which were produced by its incubation with rat liver microsomes (RLMs). PNT and its metabolites were extracted from the incubation mixture by the protein precipitation procedure and the supernatants were injected into high performance liquid chromatography tandem mass spectrometry (LC-MS/MS) equipment. Reversed phase liquid chromatography resolved seven in vitro PNT metabolites. Each metabolite displayed one or more metabolic reaction pathways including N-demethylation, N-oxide formation, oxidation, reduction and hydroxylation. Structures of the PNT metabolites showed high liability to form reactive metabolites. Since bioactivation is often speculated to be responsible for observed idiosyncratic toxicities including hepatotoxicity, incubation of PNT with RLMs was carried out in the presence of 1.0 mM GSH or 1.0 mM KCN to check its reactive metabolites. No GSH adduct was found while four cyano adduct metabolites were determined and their structures were proposed based on the mass scan and product ion data for each metabolite.
1. Introduction
Cancer results in one out of four deaths worldwide so it is considered a major cause of death.1 Medical statistics indicated that about 50% of the 4.5 million new cancer cases, diagnosed annually, are reported in developed countries.2,3 Tyrosine kinases are enzymes that catalyze the transfer of the γ phosphate of ATP to the tyrosine hydroxyl groups on target proteins. They act as “on” or “off” switches in many cellular functions.4 Strict control of the tyrosine kinase activity in the cell regulates important processes such as cell cycle, proliferation and cell death. In many cases, the abnormal proliferation characteristics of cancer are driven by growth factor receptor-mediated signaling. In tumor cells, it is often the failure of the control mechanism that leads to excessive phosphorylation, and pathways sustained in an activated state.5,6Ponatinib, as a multi-targeted tyrosine kinase inhibitor, is active against T315I and other BCR-ABL mutants.7 PNT acts against imatinib-resistant mutants of FIP1L1-PDGFRA and KIT, and against FGFR1-derived fusion kinases.8
Iclusig® (PNT) is approved in the U.S. and EU. The FDA approved PNT in 2012, but temporarily suspended sales on 31 October 2013 because of “the risk of life-threatening blood clots and severe narrowing of blood vessels”.9–12 The FDA allowed Ariad Pharmaceuticals to resume marketing of Iclusig on Dec. 20, 2013 with a clear Black Box Warning.13,14
Metabolism is considered a detoxification process by which endogenous compounds and xenobiotics are transformed into more hydrophilic species to enable elimination from the body. Metabolites are usually less toxic than their parent molecules, but it is sometimes undergo bioactivation to form reactive species that are potentially more toxic.15,16 Metabolic activation of a drug to reactive metabolite(s) can covalently modify proteins, which is considered the first step that may lead to drug-induced organ toxicities.
Characterization of reactive metabolites is essential to design new drug candidates with an improved toxicological profile. High performance liquid chromatography (HPLC) coupled with tandem mass spectrometry (MS) predominates over all other analytical tools used for screening and characterization of reactive metabolites.17,18 Reactive intermediates cannot be detected directly due to their transient nature. Instead, a trapping agent was used to capture the reactive intermediate, leading to formation of adducts which are stable and can be detected and characterized by tandem mass spectrometry.19,20 Drugs and their metabolites containing cyclic tertiary amine structure, such as N-methylpiperazine group, are able to form iminium intermediates that are reactive toward nucleophilic macromolecules.21 These iminium intermediates are considered hard reactive metabolites.22 Hard reactive metabolite cannot be trapped by GSH or its derivatives but efficiently trapped by potassium cyanide (KCN).15,21
PNT metabolites were produced in vitro and resolved with LC-QqQ. To screen for phase 1 metabolites, incubation of PNT was performed with rat liver microsomes (RLMs). To check for bioactive metabolites formation, incubation of PNT with RLMs was carried out in the presence of KCN or GSH. The current work reports the identification and characterization of seven phase 1 metabolites in addition to four cyanide adducts that elucidate the bioactivation pathways and may provide hints for observed clinical adverse effects of PNT.23 No GSH adduct was detected in case of RLMs incubation of PNT with GSH.
2. Experimental
2.1. Chemicals and reagents
PNT was purchased from LC Laboratories (Woburn, MA, USA). Ammonium formate, HPLC-grade acetonitrile (ACN), potassium cyanide (KCN) and formic acid were purchased from Sigma-Aldrich (West Chester, PA, USA). Purified water was obtained from Milli-Q plus purification system, Millipore, Waters (Millipore, Bedford, MA, USA). RLMs were prepared in-house using Sprague Dowely rat.242.2. Chromatographic conditions
Chromatographic separation for the incubation mixture extract was performed on an Agilent 1200 series system consisting of G1311A binary pump, G1322A degasser, G1367B HIP-ALS autosampler and G1316 thermostated column compartment and an Agilent 6410 QqQ LC/MS (Agilent Technologies, Palo Alto, CA, USA) with an electrospray ionization (ESI) interface. The chromatography was performed on Agilent eclipse plus C18 analytical column (50 mm × 2 mm, 1.8 μm particle size) (Agilent Technologies, Palo Alto, CA, USA). Column temperature was kept constant at 22 ± 2 °C. The most suitable chromatographic conditions were achieved at a flow rate of 0.2 mL min−1 with a gradient system. Mobile phase consisted of solvent A which is 10 mM ammonium formate (pH: 4.2 by addition of formic acid) and solvent B which is acetonitrile. The stepwise gradient was 5–25% B (0–20 min), 25–50% B (20–60 min), 50–90% B (60–80 min), 90% B (80–90 min) and 90–5% B (90–110 min). The post time was 15 minutes. Sample injection volume was 10 μL with a total run time of 110 minutes. Mass parameters were optimized for PNT. Product ions for PNT and metabolites were generated in the collision cell by collision-induced dissociation (CID). Detection was performed on a triple quadrupole mass detector (QqQ-MS), operated with an ESI interface in the positive ionization mode. Nitrogen was used as desolvation gas at a flow rate of 12 L min−1 and high purity nitrogen as collision gas at a pressure of 55 psi. Source temperature was set at 350 °C and capillary voltage at 4000 V. Fragmentor voltage was set at 135 V with collision energy of 15 V for PNT and its metabolites. Mass Hunter software (Agilent Technologies, Palo Alto, CA, USA) was used to control the instruments and data acquisition.2.3. RLMs incubations
PNT (30 μM) was incubated with 1.0 mg mL−1 RLMs, 1.0 mM NADPH and 50 mM Na/K phosphate buffer (pH 7.4) containing 3.3 mM MgCl2 in a total volume of 1 mL. The mixtures were incubated at 37 °C in a shaking water bath for 60 min before the reactions were stopped by adding 2 mL of ice-cold ACN followed by centrifugation (14![[thin space (1/6-em)]](https://www.rsc.org/images/entities/char_2009.gif) 000 rpm, 10 min and 4 °C). The supernatants were removed, evaporated and reconstituted in ACN/water. The same experiment was repeated using 1.0 mM GSH or 1.0 mM KCN.
000 rpm, 10 min and 4 °C). The supernatants were removed, evaporated and reconstituted in ACN/water. The same experiment was repeated using 1.0 mM GSH or 1.0 mM KCN.
2.4. Identification of the in vitro PNT metabolites
The detection of in vitro PNT metabolites was done by full scan and product ion experiment. Extracted ion chromatogram (EIC) of m/z of expected PNT metabolites were done to locate metabolites. Comparison of EICs with control incubations was done. Further, product ion scan acquisitions were performed on the QqQ-MS in order to elucidate the metabolite structure by reconstructing the marker fragment ions to identify chromatographic peak and potential metabolites.3. Results and discussion
3.1. Identification of in vitro PNT metabolites produced with RLMs incubation
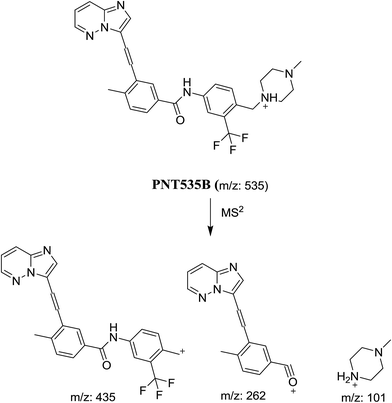
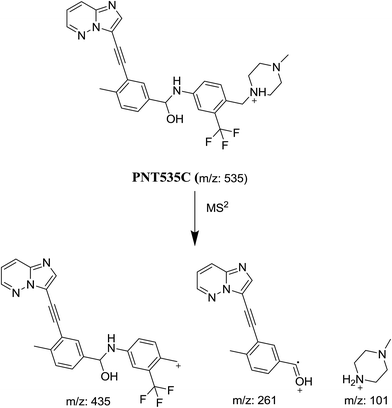
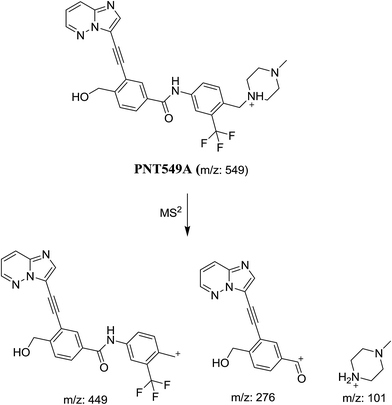
Comparison of EICs between incubations with or without RLMs as well as comparison of product ion mass spectra of PNT and potential metabolites allowed the detection of one demethylated metabolite (m/z −14) which was identified as PNT519 (major metabolite), three metabolites at m/z 549 with one N-oxide or mono hydroxyl (m/z +16) which were identified as PNT549A-C and three metabolite at m/z 535 which were identified as PNT535A-C. Accordingly, seven metabolites were formed by incubation of PNT with RLMs through five metabolic reactions: N-demethylation, N-oxide formation, oxidation, reduction and hydroxylation (Fig. 1). Table 1 summarizes the product ions, retention time and metabolic reaction for each in vitro phase 1 PNT metabolites.| MS scan | Most abundant fragment ions | Rt. (min) | Metabolic reaction | |
|---|---|---|---|---|
| PNT | 533 | 433, 260, 101 | 43.1 | |
| PNT519 | 519 | 433, 260, 87 | 41.3 | N-Demethylation |
| PNT535A | 535 | 433, 260, 86 | 37.8 | N-Demethylation and benzylic hydroxylation |
| PNT535B | 535 | 435, 262, 101 | 38.7 | Acetylenic reduction |
| PNT535C | 535 | 435, 261, 101 | 42.45 | Carbonylinic reduction |
| PNT549A | 549 | 449, 276, 101 | 30.9 | Benzylic hydroxylation |
| PNT549B | 549 | 433, 260, 117 | 31.6 | N-Oxide formation |
| PNT549C | 549 | 531, 461, 433, 260, 117, 98 | 46 | Hydroxylation of piperazine moiety |
 | ||
| Fig. 4 Product ion mass spectra of PNT535A (A), PNT535B (B) and PNT535C (C) at retention time of 37.8, 38.7 and 42.5 min, respectively. | ||
In case of PNT535A, the product ions at m/z 433 and 260 revealed the hydroxylation and N-demethylation of piperazine group with no other metabolic changes (Scheme 3).
In case of PNT535B, the product ion at m/z 101 revealed that no metabolic reaction happened in the piperazine moiety. Product ions at m/z 435 and 262 revealed the reduction in the triple bond (Scheme 4).
In case of PNT535C, the product ion at m/z 101 revealed that no metabolic reaction happened in the piperazine moiety. Product ions at m/z 435 and 261 revealed the reduction in the carbonyl group (Scheme 5).
 | ||
| Fig. 5 Product ion mass spectra of PNT549A (A), PNT549B (B) and PNT549C (C) at 30.9, 31.6 and 46.0 min, respectively. | ||
In case of PNT549A, the product ion at m/z 101 revealed that the metabolic reaction is not occurring at the methyl piperazine ring. The product ions at m/z 449 and 276 revealed that hydroxylation occurred at benzylic carbon (Scheme 6).
In case of PNT549B, the product ions at m/z 433 and 260 revealed that metabolic reaction occurred at the methyl piperazine ring. The product ion at m/z 117 indicated the N-oxidation of piperazine ring (Scheme 7).
In case of PNT549C, the product ions at m/z 433 and 260 revealed the hydroxylation of piperazine ring. The product ion at m/z 531 indicated the loss of one water molecule. The product ion at m/z 117 indicated that hydroxylation occurred at one of piperazine carbons (Scheme 8).
3.2. Identification of ponatinib reactive metabolites produced by cytochrome P450 isozymes with KCN or GSH
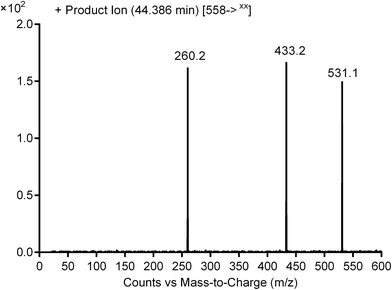
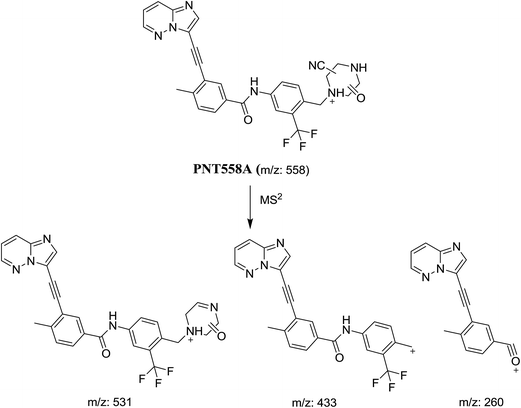
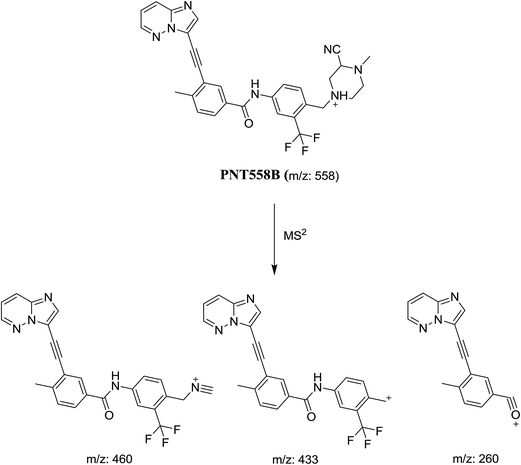
GSH conjugates were not detected. However, four cyanide adducts were detected but in a very small concentration compared to phase 1 metabolites. Identifications of parent masses representing possible cyanide PNT adducts were done with MS scan and product ion scan for selected peaks as shown in Table 2. Fig. 6 shows the chemical structure of PNT and the proposed cyanide adducts.| MS scan | Most abundant fragment ions | Rt. (min) | Proposed structure | |
|---|---|---|---|---|
| PNT558A | 558 | 531, 433, 260 | 44.4 | α cyano α oxo N-demethyl PNT |
| PNT558B | 558 | 460, 433, 260 | 52.9 | α cyano PNT |
| PNT560 | 560 | 433 | 56.7 | α cyano α hyroxy N-demethyl PNT |
| PNT572 | 572 | 545, 433, 260 | 57.2 | α cyano α oxo PNT |
3.3. Mechanism of bioactivation of ponatinib into reactive metabolites
The chemical structures of the four cyanide adducts of PNT were identified and the bioactivation pathways of the cited drug was suggested as displayed in Scheme 13. The piperazine ring moiety in PNT underwent P450-catalyzed oxidation and subsequent dehydration forming imine and imine-carbonyl intermediates (α,β-unsaturated) and thus can be trapped by suitable nucleophile. KCN is reported to be beneficial for trapping such compounds containing iminium ion.254. Conclusions
In the current study, seven phase 1 metabolites of PNT were detected and characterized by LC-MS/MS method. These metabolites were formed in vitro by incubation of the drug with RLMs via five metabolic reactions including N-demethylation, N-oxidation, oxidation, reduction and hydroxylation. Upon incubation with RLMs and KCN, four cyanide adducts were formed and their structural determination was described which involved bioactivation of the piperazine ring moiety. The suggested mechanisms for the formation of these cyanide adducts were also proposed. These reactive adducts may be responsible for the observed side effects of PNT in humans.Acknowledgements
The authors would like to extend their sincere appreciation to the Deanship of Scientific Research at the King Saud University for funding this work through the Research Group Project No. RGP-322.References
- A. Jemal, R. Siegel, E. Ward, Y. Hao, J. Xu, T. Murray and M. J. Thun, Ca-Cancer J. Clin., 2008, 58, 71–96 CrossRef PubMed.
- R. Sinha and K. El-Bayoumy, Curr. Cancer Drug Targets, 2004, 4, 13–28 CrossRef CAS PubMed.
- P. Cozzi, N. Mongelli and A. Suarato, Curr. Med. Chem.: Anti-Cancer Agents, 2004, 4, 93–121 CrossRef CAS PubMed.
- J. Schlessinger, Cell, 2000, 103, 211–225 CrossRef CAS PubMed.
- C. Özvegy-Laczka, J. Cserepes, N. B. Elkind and B. Sarkadi, Drug Resist. Updates, 2005, 8, 15–26 CrossRef PubMed.
- N. Steeghs, J. W. Nortier and H. Gelderblom, Ann. Surg. Oncol., 2007, 14, 942–953 CrossRef PubMed.
- T. O'Hare, W. C. Shakespeare, X. Zhu, C. A. Eide, V. M. Rivera, F. Wang, L. T. Adrian, T. Zhou, W.-S. Huang and Q. Xu, Cancer Cell, 2009, 16, 401–412 CrossRef PubMed.
- E. Lierman, S. Smits, J. Cools, B. Dewaele, M. Debiec-Rychter and P. Vandenberghe, Leukemia, 2012, 26, 1693–1695 CrossRef CAS PubMed.
- S. Small, Clin. Adv. Hematol. Oncol., 2013, 11, 808–809 Search PubMed.
- M. Dalzell, Manag. Care, 2013, 22, 42 Search PubMed.
- R. R. Shah, J. Morganroth and D. R. Shah, Drug Saf., 2013, 36, 491–503 CrossRef CAS PubMed.
- Cancer Discovery, 2014, 4, 6–7 Search PubMed.
- Cancer Discovery, 2014, 4, 138 Search PubMed.
- Med Lett Drugs Therapeut, 2014, 56, 8 Search PubMed.
- D. C. Evans, A. P. Watt, D. A. Nicoll-Griffith and T. A. Baillie, Chem. Res. Toxicol., 2004, 17, 3–16 CrossRef CAS PubMed.
- A. S. Kalgutkar, D. K. Dalvie, J. P. O'Donnell, T. J. Taylor and D. C. Sahakian, Curr. Drug Metab., 2002, 3, 379–424 CrossRef CAS PubMed.
- S. Ma and R. Subramanian, J. Mass Spectrom., 2006, 41, 1121–1139 CrossRef CAS PubMed.
- A. Tolonen, M. Turpeinen and O. Pelkonen, Drug Discovery Today, 2009, 14, 120–133 CrossRef CAS PubMed.
- S. Ma and M. Zhu, Chem.–Biol. Interact., 2009, 179, 25–37 CrossRef CAS PubMed.
- A. F. Stepan, D. P. Walker, J. Bauman, D. A. Price, T. A. Baillie, A. S. Kalgutkar and M. D. Aleo, Chem. Res. Toxicol., 2011, 24, 1345–1410 CrossRef CAS PubMed.
- L. P. Masic, Curr. Drug Metab., 2011, 12, 35–50 CrossRef CAS PubMed.
- Z. Zhang, Q. Chen, Y. Li, G. A. Doss, B. J. Dean, J. S. Ngui, M. Silva Elipe, S. Kim, J. Y. Wu, F. Dininno, M. L. Hammond, R. A. Stearns, D. C. Evans, T. A. Baillie and W. Tang, Chem. Res. Toxicol., 2005, 18, 675–685 CrossRef CAS PubMed.
- M. Daly, S. Sheppard, N. Cohen, M. Nabity, A. Moussy, O. Hermine and H. Wilson, J. Vet. Intern. Med., 2011, 25, 297–302 CrossRef CAS PubMed.
- R. von Jagow, H. Kampffmeyer and M. Kinese, Naunyn-Schmiedebergs Arch. Exp. Pathol. Pharmakol., 1965, 251, 73–87 CrossRef CAS PubMed.
- D. Argoti, L. Liang, A. Conteh, L. Chen, D. Bershas, C.-P. Yu, P. Vouros and E. Yang, Chem. Res. Toxicol., 2005, 18, 1537–1544 CrossRef CAS PubMed.
Footnote |
| † Electronic supplementary information (ESI) available. See DOI: 10.1039/c6ra09985h |
| This journal is © The Royal Society of Chemistry 2016 |


