 Open Access Article
Creative Commons Attribution 3.0 Unported Licence
A novel low-temperature solid-state route for nanostructured cubic garnet Li7La3Zr2O12 and its application to Li-ion battery
P. Jeevan Kumarae,
K. Nishimurab,
M. Senna*ac,
A. Düveld,
P. Heitjansd,
T. Kawaguchib,
N. Sakamotoab,
N. Wakiyaab and
H. Suzukiab
aResearch Institute of Electronics, Shizuoka University, 432-8561, Hamamatsu, Japan
bGraduate School of Engineering, Shizuoka University, 432-8561, Hamamatsu, Japan
cFaculty of Science and Technology, Keio University, 223-8522, Yokohama, Japan. E-mail: senna@applc.keio.ac.jp
dInstitute of Physical Chemistry and Electrochemistry, ZFM – Center for Solid State Chemistry and New Materials, Leibniz Universität Hannover, 30167, Hannover, Germany
eCentre for Nanomaterials and MEMS, Department of Physics, Nitte Meenakshi Institute of Technology (NMIT), Bangalore, 560064, India
First published on 17th June 2016
Abstract
We present a novel approach to the solid-state synthesis of garnet-type cubic Li7La3Zr2O12 (c-LLZO) nanostructured particles with 1.0 mass% Al at 750 °C within 3 h. In contrast to conventional solid-state processes, a highly reactive precursor was prepared in two steps: (i) by homogenizing the stoichiometric mixture without Li, and (ii) subsequent addition of Li in the form of an ethanolic solution of lithium acetate. The actual composition determined by ICP analysis was Li6.61La3Zr2Al0.13O11.98. Sintering these nanoparticles at 1100 °C for 3 h in air after cold isostatic pressing brought a dense ceramic pellet with a relative density of 90.5%. The corresponding ionic conductivity with Au electrodes was 1.6 × 10⁻⁴ S cm−1 at room temperature. To study its electrochemical behavior as an electrolyte, a model cell of Li//(1 M LiPF6 + c-LLZO)//LiCoO2 configuration was constructed. Cyclic voltammetry of the cell delivered one set of redox couple with narrow voltage separation (15 mV) with a Li+ diffusion coefficient at room temperature of about 2 × 10⁻¹¹ cm2 s−1 at the interface between LiCoO2 and 1 M LiPF6 + c-LLZO. The cell received an average discharge capacity of 64.4, 60.3, 56.1, 51.9 and 46.9 μA h cm−2 μm−1 at discharge rates 0.5C, 1C, 2C, 4C and 6C, respectively. The cell exhibited complete oxidation and reduction reactions with an average initial discharge capacity of about 64 μA h cm−2 μm−1, which is 92.7% of LiCoO2 theoretical value. These observations indicate the applicability of the present c-LLZO as an electrolyte for a solid-state Li-ion battery.
Introduction
Lithium ion batteries (LIB) with higher safety and affordability are of utmost importance for better utilization of renewable energy and high-energy electric vehicles.1,2 Stringent requirements are high-energy density, long cycle life with improved safety, reliability and leakage-free properties in wider operating temperature regimes, enabling a cost-effective process. In current battery technology, we have relatively promising electrode materials in terms of higher energy density and structural stability. On the other hand, we still use flammable, volatile and unstable organic solvents based electrolytes containing Li-salts with polymer separator in all types of conventional Li-ion batteries. These electrolytes not only cause irreversible capacity losses due to the formation of solid-electrolyte interphases (SEI), but also limit the safety of the batteries. Solid-state electrolytes (SSE) with fast Li-ion diffusion were recognized as promising alternative, addressing better thermal and chemical stabilities and opening a wider operational temperature window.3 For the high-performance SSE, however, great challenges remain, such as: (i) increase in the ionic conductivity and (ii) optimization of fabrication processes.4Within the variety of SSE including lithium superionic conductor (LISICON), thio-LISICON or sodium superionic conductor (NASICON), garnet-type c-LLZO is regarded as one of the most promising SSE due to its high ionic conductivity, stability with lithium and its less hygroscopic behavior.5,6 Weppner and coworkers have succeeded first in synthesizing c-LLZO by sintering at 1230 °C for 36 h and obtained a total (bulk + grain boundary) ionic conductivity of 2.44 × 10⁻⁴ S cm−1 at 25 °C.7 Thereafter, the material has received enormous research attention and a lot of work has been reported. LLZO garnet exhibits mainly two distinct phases, i.e. a tetragonal phase (t-LLZO) with low ion conductivity and a cubic phase with fast ion conductivity. The regulation of the Li site preference is found to be decisive for the phase purity of the cubic garnet structure and to yield fast ordered Li+ kinetics. This has been managed by the addition of few mol% of Al, Ga, Ta, Fe, Nb etc. for substituting Li and probably also some of the other cation species in LLZO. The reason(s) for this is(are) still under investigation. Ohta et al. reported that substitution of Nb for Zr in LLZO not only hinders the Li-ion motion but also lowers the Li-ion content more than all other additives. They found an ionic conductivity as high as 8 × 10⁻⁴ S cm−1.8 However, many reports suggested that Al or Ta is more preferable as compared to Nb from the viewpoint of chemical stability in the presence of Li.9 Recently, Bernuy-Lopez et al. reported an ionic conductivity as high as 1.3 mS cm−1 at room temperature (RT) by atmosphere controlled processing of Ga-doped LLZO.10 However, as very recently shown by single crystal studies by Robben et al. and briefly after by Wagner et al. Ga-doping is accompanied by a reduction of the LLZO cubic garnet symmetry.11,12 Buschmann et al. reported that Ga substituted LLZO/Li interface showed higher area specific interfacial resistance (ASR) (6000 Ω cm2) than 0.9 wt% Al substituted LLZO/interface (2800 Ω cm2).13 Geiger et al. also suggested that a minor concentration of Al in LLZO (0.10 to 0.15 Al per formula unit) as stabilizing agent could compensate the additional charge emergence due to Li+ vacancies and then reduce the free energy associated with ordering of the Li sub-lattice in LLZO core symmetry.14
Preparation of these oxide powders with complex garnet structure is mostly based on the conventional sol–gel or solid state syntheses, in which powders were calcined usually at temperatures above 850 °C. Xie et al.15 and Kokal et al.16 have succeeded in synthesizing phase pure c-LLZO nanopowders at lower temperatures of 750 °C, preceded by a solution and/or a sol–gel procedure. However, their product showed unfavorable ionic conductivities in the order of ∼10−6 S cm−1 at room temperature (RT). Zhang et al. claimed higher ionic conductivity of 3.3 × 10⁻⁴ S cm−1 at RT for nano-sized Al-doped LLZO powders prepared via a novel wet-chemical method combined with post heating at 900 °C.17 In an attempt to fabricate LIB with high capacity and reliability, Cheng et al. explored solid state synthesis of LLZO with controlled particle size.18 By combining mechanochemical processing and subsequent heating, Düvel et al. succeeded in preparing quasi phase pure c-LLZO.19 Table 1 exhibits the results reported on Al-substituted c-LLZO synthesized by conventional solid-state methods. Solid-state routes generally demand higher calcination temperatures and longer heating duration. Phase stability of c-LLZO is influenced by the Al and Li concentration, which are highly sensitive to prolonged heat treatment due to usage of Al2O3 crucibles and higher calcination temperatures, respectively.20 Simultaneous formation of a pyrochlore phase often takes place, leading to the inferior ionic behavior of the ceramic. Based on those facts, our attempts were focused on the reduction of the calcination temperature and duration. Once c-LLZO powders are successfully prepared, it is often necessary to sinter them to obtain a dense pellet or a bulk ceramics for all-solid lithium ion battery.21–23 Bulk sintered LLZO is also useful as a target for a physical vapor deposited thin film.24 For the preparation of high-density sintered pellets, various additives were incorporated.25 In order to increase the sinter density, using the starting mixture with smallest possible primary particles is another important viewpoint, since the associated high surface energy serves as an important driving force of sintering.26–28
| Reference | Precursors | Calcination treatment | Relative density | Activation energy | Ionic conductivity (S cm−1) at RT |
|---|---|---|---|---|---|
| Sakamoto et al.39 | LiCO3,La(OH)3, ZrO2, Al2O3, no excess Li | 1000 °C for 4 h | 98% | 0.26 eV | 4 × 10⁻⁴ |
| Kotobuki et al.22 | LiOH, La(OH)3, ZrO2, Al2O3 | 900 °C for 6 h | 2.4 × 10⁻⁴ | ||
| Chen et al.35 | Li2CO3, La2O3, ZrO2, Al2O3, 10% excess Li | Two steps 900 and 1125 °C for 10 h each | 93% | 2.48 × 10⁻⁴ | |
| Cheng et al.18 | Li2CO3, La(OH)3, ZrO2, Al2O3, no excess Li | 1000 °C for 12 h | 94% | 0.29 eV | 2.3 × 10⁻⁴ |
| Buschmann et al.13 | LiOH, La2O3, ZrO2, Al2O3, 10–20% excess Li | Calcination at 1130 °C for 12 h | 0.34 eV | 4 × 10⁻⁴ | |
| Allen et al.9 | Li2CO3, La(OH)3, ZrO2, Al(OH)3, 3 wt% Li excess | 1000 °C for 3–4 h | 98% | 0.30 eV | 3.7 × 10⁻⁴ |
| Lee et al.23 | LiOH, La2O3, ZrO2, 10 wt% excess Li | 900 °C for 12 h in alumina crucibles | 86% | 0.34 eV | 4.9 × 10⁻⁴ |
| Present work | CH3COOLi, La(OH)3, ZrO2, 1 wt% AlOOH, no excess Li | 750 °C for 3 h | 91% | 0.36(1) eV | 1.6 × 10⁻⁴ |
In this paper, we report a novel methodology to synthesize phase pure c-LLZO nanostructured particles at lowest possible temperatures. For this purpose, we propose a two-step reaction scheme for the preparation of the precursor. In the first step, a precursor of La and Zr, with their electronegativity slightly higher as compared to that of Li is prepared under mechanical stress. Subsequently, a stoichiometric Li source is added as an ethanolic solution. In the latter process, lithium can penetrate further to its ordering into the sub-lattice sites in Zr octahedral and La tetrahedral environments of garnet structures. Fig. 1 schematically illustrates our concept of preparing c-LLZO in comparison to the conventional solid-state process. We further observed microstructural evolution of nanoparticles on cold isostatic pressing (CIP) followed by conventional sintering. After determining the Li-ion conductivities of the sintered pellet at different temperatures, a prototype of Li-ion battery has been crafted using thin c-LLZO sintered pellet as an electrolyte in combination with the two polymer separators soaked into a non-aqueous electrolyte. Finally, the preliminary electrochemical performances were examined by using these prototypic LIB.
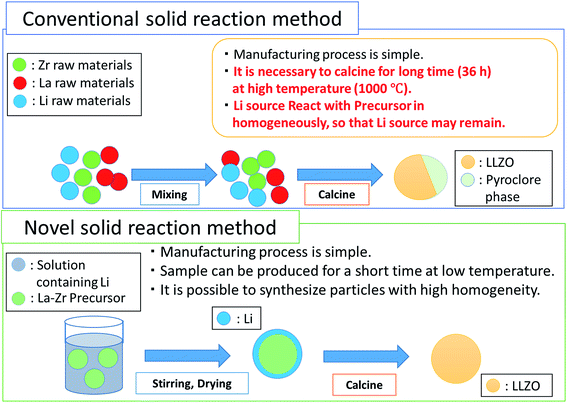 | ||
| Fig. 1 Conceptual representation of novel approach to solid state synthesis approach in contrast to conventional solid reaction method. | ||
Experimental section
Sample preparation
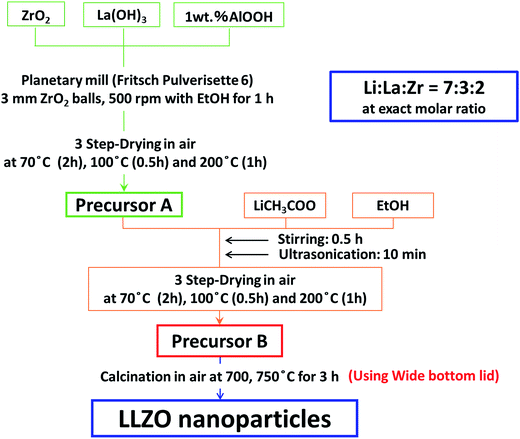
LLZO precursor was prepared in two steps, i.e. from the precursors A and B. Precursor A was prepared from ZrO2 nanoparticles (Tosoh ∼99.9%, average particle diameter, davg. = 270 nm) and La(OH)3 (Aldrich 99.9%, davg. = 190 nm) in a molar ratio 2![[thin space (1/6-em)]](https://www.rsc.org/images/entities/char_2009.gif) :
:![[thin space (1/6-em)]](https://www.rsc.org/images/entities/char_2009.gif) 3. One mass% AlOOH (Wako ∼97%, davg. = 50 nm) was added for the stabilization of c-LLZO. They were mixed intimately in a planetary mill (Fritsch, Pulverisette 6) at 500 rotations per minute (RPM) for 3 h with 2 mm diameter ZrO2 media in ethanol (EtOH) and carefully dried in air in 3 steps, i.e. 70 °C for 2 h, 100 °C for 0.5 h and 200 °C for 1 h. The precursor A was put into a 15 mass% ethanol solution of lithium acetate (Wako) and ultrasonicated for 10 min and dried under the same conditions to obtain precursor B with the exact stoichiometry of LLZO. The precursor B was calcined in air at 750 °C for 1–5 h. Powders were compressed by CIP at 60 MPa for 0.5 h. The green compact was subjected to sintering in a muffle furnace at 1100 °C for 3 h in air. Fig. 2 summarizes the novel solid-state reaction scheme adopted to synthesize c-LLZO.
3. One mass% AlOOH (Wako ∼97%, davg. = 50 nm) was added for the stabilization of c-LLZO. They were mixed intimately in a planetary mill (Fritsch, Pulverisette 6) at 500 rotations per minute (RPM) for 3 h with 2 mm diameter ZrO2 media in ethanol (EtOH) and carefully dried in air in 3 steps, i.e. 70 °C for 2 h, 100 °C for 0.5 h and 200 °C for 1 h. The precursor A was put into a 15 mass% ethanol solution of lithium acetate (Wako) and ultrasonicated for 10 min and dried under the same conditions to obtain precursor B with the exact stoichiometry of LLZO. The precursor B was calcined in air at 750 °C for 1–5 h. Powders were compressed by CIP at 60 MPa for 0.5 h. The green compact was subjected to sintering in a muffle furnace at 1100 °C for 3 h in air. Fig. 2 summarizes the novel solid-state reaction scheme adopted to synthesize c-LLZO.
Characterization
Thermogravimetric/differential thermal analysis (TG-DTA) of the LLZO precursor powder was conducted by using a Thermo plus TG 8120 model spectrometer (Rigaku, Japan) under air atmosphere with α-Al2O3 reference container. Crystal structures of the samples were examined using an X-ray diffractometer (D8 Advance; Bruker Analytik, Germany) equipped with a Cu anode (λ = 1.5418 Å) operated at 40 kV and 40 mA with a scanning rate in 2θ of 0.01 s−1. The phase composition was analyzed using TOPAS software utilizing the ICSD PDF database.The external morphology of the powder samples calcined and the cross-sectional view of the pellet sintered were observed by field emission scanning electron microscopy (FESEM) (Model JSM-700F, JEOL Ltd., Tokyo, Japan) with an accelerating voltage of 15 kV. For the measurements the samples were prepared by attaching the powder/broken pellet to an aluminum stub with silver paste, which then was coated with osmium by sputtering to prevent surface charging. The microstructure of calcined LLZO samples was investigated using scanning transmission electron microscopy (STEM) (Model JEM-2100F; JEOL Ltd.) equipped with energy dispersive spectroscopy (EDS) operating at an accelerating voltage of 200 kV. For TEM evaluations powder samples were dispersed in ethanol using ultrasound for 10 min and one droplet was dropped on a carbon coated grid and dried overnight before analysis.
The particle size distribution of nanoparticles was measured in ethanol solvent using an electrophoretic scattering photometer, i.e. dynamic light scattering (DLS) (Photal SELS-800Y; Otsuka Electronics Co. Ltd. Tokyo, Japan). Inductively coupled plasma optical emission spectrometry (ICP-OES) studies were performed to determine the concentration of trace elements in synthesized LLZO powders by Optima 2100DV (PerkinElmer, USA).
Temperature-dependent impedance spectroscopy (IS) measurements were conducted at temperatures ranging from 273 K to 513 K. A broadband dielectric spectrometer (Novocontrol, Concept 41) was used for the measurements in the frequency range between 10−2 Hz and 107 Hz with voltage ramp of 100 mV s−1. Electrochemical tests of the cells were performed in Swagelok type cells using a thin slice of LLZO as electrolyte with lithium foil (area = 0.8 cm2) negative electrode. RF magnetron sputter deposited LiCoO2 thin films on Pt/Si substrates have been used as working electrode. The active area of the working electrode was estimated to be 0.8 cm2 and its thickness was 1.6 μm. Li-ion conductive polypropylene porous separators were introduced in between electrode(s) and LLZO electrolyte to minimize the unavoidable electrolyte-to-electrode(s) interfacial resistance. These polymer sheets were actually soaked in 1.0 M LiPF6 in an ethylene carbonate (EC)–dimethyl carbonate (DMC) mixture (1![[thin space (1/6-em)]](https://www.rsc.org/images/entities/char_2009.gif) :
:![[thin space (1/6-em)]](https://www.rsc.org/images/entities/char_2009.gif) 1 ratio by volume), overnight. The cell designed was annotated as Li//(1 M LiPF6 + c-LLZO)//LiCoO2 cell. All cells were assembled in an Ar-filled dry glove box (O2, H2O below 5 ppm). The series of room temperature potentiostatic and galvanostatic electrochemical measurements such as cyclic voltammetry and chronopotentiometry were conducted with a Versastat 4 electrochemical analyzer (Tokyo corp., Japan) within the potential range 3.0–4.2 V and at various charge/discharge current rates.
1 ratio by volume), overnight. The cell designed was annotated as Li//(1 M LiPF6 + c-LLZO)//LiCoO2 cell. All cells were assembled in an Ar-filled dry glove box (O2, H2O below 5 ppm). The series of room temperature potentiostatic and galvanostatic electrochemical measurements such as cyclic voltammetry and chronopotentiometry were conducted with a Versastat 4 electrochemical analyzer (Tokyo corp., Japan) within the potential range 3.0–4.2 V and at various charge/discharge current rates.
Results and discussions
Properties of the precursors
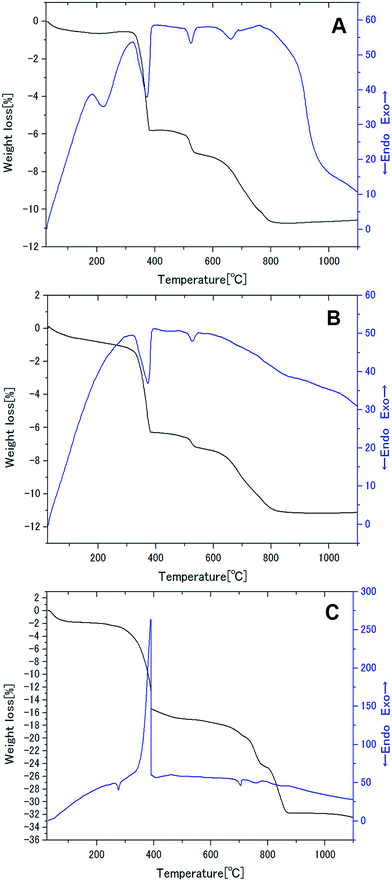
The thermal behavior of the powder mixture, precursor A and precursor B is compared in Fig. 3A–C, respectively. The change in the DTA profiles due to mechanical stressing is significant, when we compare Fig. 3A and B. However, two endothermic peaks of the powder mixture, located at ca. 375 °C and 525 °C, which can be ascribed to the main decomposition of La(OH)3 (ref. 29) and AlOOH,30 survived after mechanical activation to prepare the precursor A. A sharp exothermic peak from precursor B, at around 390 °C, is attributed to the decomposition of lithium acetate with simultaneous burn-out of the decomposed product, mainly methane.31 Two endothermic peaks observed in precursor A have disappeared in Fig. 3C in which the first endothermic peak i.e. around 375 °C appeared to be masked by the exothermic process. These features consistently indicate the significant chemical interaction between precursor A and Li acetate. Since the decomposition temperature of the lithium acetate did not exhibit big difference from its pure state, chemical interaction must have played a more significant role after its decomposition. As for the TG curves, the main weight loss at around 370–400 °C is much more significant for precursor B due to the overlapped decomposition of hydroxides and the acetate. However, the subsequent changes are fairly different, mainly due to the changes in the states of OH groups in the precursors. Details of these differences are, however, outside the scope of the present study.Crystallographic properties related to garnet phase purity
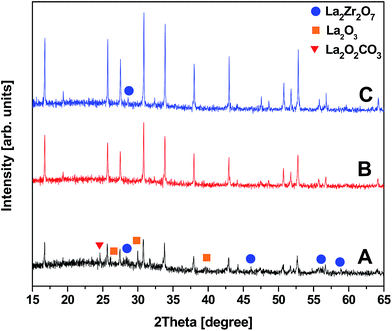
The conventional garnet structure has the general chemical formula of A3B2(CO4)3, where A, B and C reside at 8, 6 and 4 oxygen-coordinated sites, respectively. In a Li-stuffed garnet, i.e. in Li7La3Zr2O12, lithium occupies the B (L1) sites as well as unoccupied distorted octahedral (L2) sites. Fig. 4A and B compares the X-ray diffraction (XRD) patterns of LLZO precursor powders calcined at 700 and 750 °C for 3 h synthesized by our novel solid reaction method. It should be noted that these powders were synthesized at stoichiometric ratios of elements and no excess Li was added. The XRD results show that the cubic phase of LLZO was formed after calcining precursor B at 700 °C for 3 h. However, these powders exhibit additional reflections of impurity phases, i.e. La2Zr2O7 (PDF 17-0450), La2O3 (05-0602) and La2O2CO3 (PDF 37-0804), see Fig. 4A. By slightly increasing the calcination temperature to 750 °C while keeping the duration for 3 h, pure cubic phase LLZO is detected without any signature of impurities. The corresponding XRD pattern of cubic Li7La3Zr2O12 is shown in Fig. 4B. All the diffraction peaks can be matched with a typical cubic garnet phase similar to Li5La2Nb2O12 (PDF 01-084-1753), and no obvious impurity phases can be detected. The lattice parameter a = 12.97093 Å was calculated by profile fitting of the powder XRD pattern using Topas program. It is in good agreement with published results.32 The crystallite size estimated from the FWHM of the X-ray diffractometry was about 135.8 nm. These observations agree with those from TG-DTA. The high garnet phase purity in LLZO powders at low calcination temperatures is achieved in a relatively short period of time. This could be attributed to the reaction of the Li precursor in liquid form with the mechanically activated, highly reactive LaZr precursor and the addition of Al as dopant. Zhang et al. demonstrated the importance of addition of Al2O3 to crystallize the cubic phase of LLZO, however, at higher calcination temperature and prolonged heating time (900 °C, for about 4 h).33 As reported by Hubaud et al. Al3+ was incorporated at the grain boundary by forming Li5AlO4 at lower temperature. It entered into the grain by reaction with the tetragonal phase to form cubic phase LLZO when sintered at high temperature.34 According to literature, Al3+ most probably substitutes 3Li+ and stabilizes the cubic phase rather than the tetragonal phase, which is stable at room temperature (without Al3+).35 These XRD patterns were compared with that of an LLZO pellet prepared by CIP and sintering at a temperature of 1100 °C for 3 h. The sintered pellet also exhibited a diffraction pattern similar to its powders and demonstrated cubic garnet structure, as shown in Fig. 4C. Although a very small amount of La2Zr2O7 was detected, it is clear that the phase purity of c-LLZO was almost maintained after sintering the compressed calcined powders. The existence of minute pyrochlore signature is probably due to a partial diffusion of Li-ions out of the green pellet while sintering. We also noted an increase in the XRD peak intensities for the sintered sample, showing the increase in the crystallinity of the LLZO. The crystallite size and the lattice parameter a obtained after Rietveld refinement were about 145.2 nm and 12.9770 Å, respectively. Estimated lattice parameters are in agreement with the literature.32To understand the phase purity of the calcined LLZO polycrystalline powders (750 °C for 3 h) and the corresponding sintered LLZO pellet, unpolarized micro-Raman spectroscopic studies were conducted in the wavenumber range from 100 to 550 cm−1. The results are plotted in Fig. 5A and B, respectively. In general, t-LLZO exhibits more complicated spectral features than the cubic phase either due to the lower symmetry of the tetragonal garnet (I41/acd space group) or due to more disordered Li+ ion arrangements, as summarized by Tietz et al.36 According to Orera et al.,37 Raman modes confined to the region between 330 and 600 cm−1 might be particularly sensitive to the Li-ion distributions and its changes in the symmetry. The Raman signals visible in the low frequency region, i.e. <150 cm−1, are mainly of La based vibrational bands. Fig. 5A and B clearly exhibit overall similarities in Raman excitations at wave numbers around 107, 121, 144, 209, 251, 361, 410 and 514 cm−1 for both, calcined and sintered, LLZO powders. No splitting of Raman bands was observed in the low-frequency region, i.e., at wavenumbers 107 (T2g) and 121 (Eg) cm−1 nor in Li+ ion bonding sensitive regions, i.e. at 361 (T2g), 410 (Eg/T2g) and 514 (T2g/Eg) cm−1, respectively. These observations indicate the phase purity of both the samples ascribed to the characteristic cubic garnet structure with I4![[3 with combining macron]](https://www.rsc.org/images/entities/char_0033_0304.gif) d space group. Again, these observations were in good agreement with the ones reported in the literature.37 It is also noticed that the Raman spectrum of calcined LLZO precursor powder exhibited additional spectral features with minute Raman intensities at wavenumbers 155 and 190 cm−1 (Fig. 5A). These Raman signals were ascribed to the T2g and Eg symmetries of t-LLZO garnet structure which later disappeared after sintering the CIP pressed LLZO powders (Fig. 5B) at elevated temperature (1100 °C for 3 h). A slight blue shift in all Raman excitations was observed for the sintered pellet which may be due to the development of strain in the confined grain growth. Structural rearrangement might have built up for the tiny inhomogeneous calcined precursor powders upon thermal treatment. The presence of additional phase was not reflected in the XRD observations due to its low sensitivity to the light weight elements. However, Raman scattering measurements could be able to clearly distinguish the presence of various phases in LLZO that are difficult to detect by XRD since they are present in very small concentrations.
d space group. Again, these observations were in good agreement with the ones reported in the literature.37 It is also noticed that the Raman spectrum of calcined LLZO precursor powder exhibited additional spectral features with minute Raman intensities at wavenumbers 155 and 190 cm−1 (Fig. 5A). These Raman signals were ascribed to the T2g and Eg symmetries of t-LLZO garnet structure which later disappeared after sintering the CIP pressed LLZO powders (Fig. 5B) at elevated temperature (1100 °C for 3 h). A slight blue shift in all Raman excitations was observed for the sintered pellet which may be due to the development of strain in the confined grain growth. Structural rearrangement might have built up for the tiny inhomogeneous calcined precursor powders upon thermal treatment. The presence of additional phase was not reflected in the XRD observations due to its low sensitivity to the light weight elements. However, Raman scattering measurements could be able to clearly distinguish the presence of various phases in LLZO that are difficult to detect by XRD since they are present in very small concentrations.
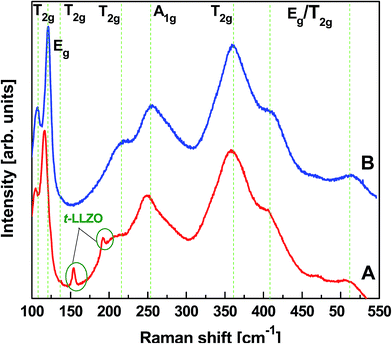 | ||
| Fig. 5 Unpolarized micro-Raman spectra obtained from polycrystalline LLZO (A) after calcining the precursor B at 750 °C for 3 h and (B) the sintered LLZO pellet at 1100 °C for 3 h. | ||
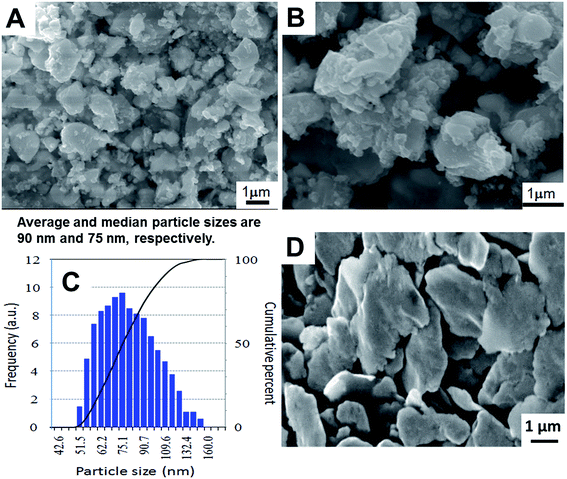
Fig. 6A and B show SEM images of the calcined LLZO powders at different magnifications. Fig. 6C shows the corresponding particle size distribution obtained from the DLS spectrum. In Fig. 6A and B, we observe the irregular block with the typical particle size distribution of 1–2 μm. At the same time, we recognize much smaller particulate units densely agglomerated. On the other hand, DLS measurements from the supernatant gave rise to an average size of ca. 90 nm. The average crystallite size estimated from the X-ray diffraction peak width was around 145 nm. This altogether gave us consistent information that our as-calcined LLZO powders have a primary particle size in the order of about 100 nm, are, however, agglomerated to particle sizes in the order of 1 to 2 μm. As shown in Fig. 6D, the particle sizes after sintering remain practically unchanged from those of agglomerated as-calcined powders, indicating that the sintering took place preferentially within the agglomerates.
The pellet density was estimated by weighing the pellets' mass and measuring their diameter and height. It is about 4.606 g cm−3 which is about 90.5% of c-LLZO theoretical density (5.098 g cm−3).32 For comparison, the relative density of the pellet was also examined by the conventional Archimedes method and is almost identical to the projected value. Morphological features at fractured surface of the sintered pellet are shown in Fig. 6D. From the figure it is clear, that there are residual pores between and in the crystallites. However, the sample seems to be quite dense and is in agreement with the calculated high relative density without significant voids. The fracture of the pellet appears to be transgranular, indicating the grain boundary strengthening effect. All the ceramic grains exhibited irregular disc shaped morphology with an average grain size estimated to be around 4 μm.
Fig. 7A–E presents the STEM images of the as-calcined LLZO powders and corresponding EDS elemental mapping. Results indicate a fairly homogeneous distribution of La, Zr, and Al. The actual cationic concentration for the powders synthesized estimated by ICP was Li6.61La3Zr2Al0.13O11.98, where the oxygen concentration was calculated to maintain charge neutrality. These observations consistently support the XRD and Raman results, demonstrating the cubic phase purity of the calcined powders.
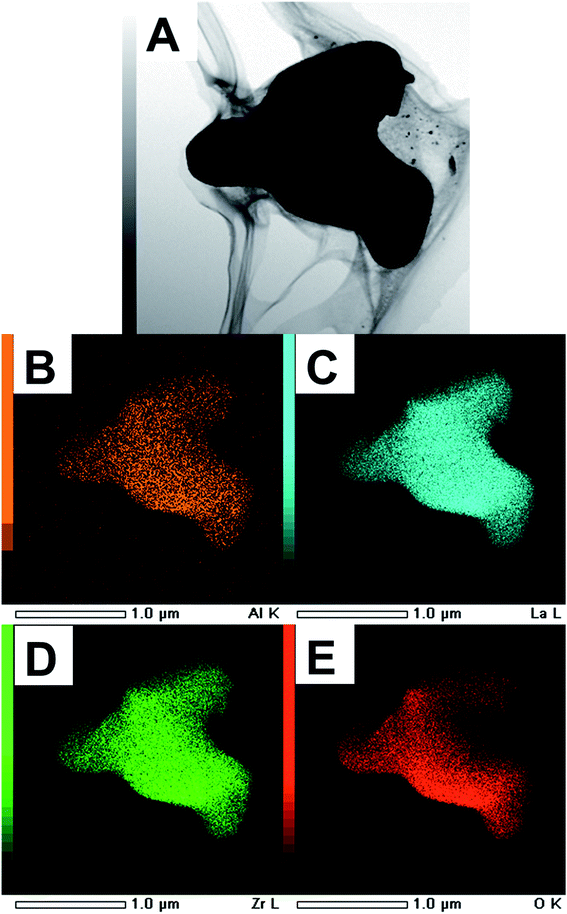 | ||
| Fig. 7 (A) STEM images of the LLZO calcined powders and (B–E) area distribution of elements of Al, La, O and Zr measured by EDS, respectively. | ||
Impedance spectra of sintered pellet
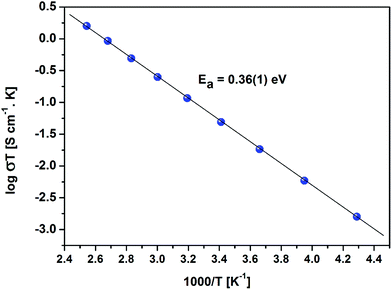
Temperature and frequency dependences of the conductivity for the sintered pellet with blocking electrodes are displayed in Fig. 8. At each temperature, the conductivity spectra show dispersion regions, at higher and lower frequencies. The lower ionic conductivity values in the lower frequency region indicate the presence of electrode polarization. Apparent plateau regions of the ionic conductivity were observed at the higher frequency side (between 103 and 107 Hz). These plateaus are observed to be shifted to smaller frequencies side with decreasing temperature. This signature indicates the single phase crystalline ceramic response upon the influence of frequency variation suggested by Jonscher et al.38 Each plot consists of a frequency independent plateau region at higher and lower frequencies probably corresponding to the bulk ion conductivity (σhf) and the grain boundary conductivity (σlf), respectively. The temperature dependence of the conductivity is described by the Arrhenius relation:
 | (1) |
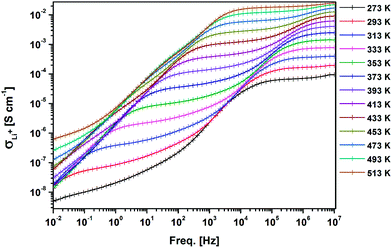 | ||
| Fig. 8 AC conductivity of the sintered LLZO with Au blocking electrodes with respect to frequency at different temperatures. | ||
Typical complex impedance plots for LLZO at various temperatures ranging from 293 K to 513 K are presented in Fig. 9, in Nyquist representation. In both the cases, the experimental complex impedance plot consists of a depressed semicircle accompanied by a straight line on the low frequency side which is suggestive of electrolyte–electrode polarization at the Au blocking electrodes. The depression of the semicircle may be ascribed to the presence of distribution in relaxation times within the bulk response. Again, the radius of the depressed semicircle is observed to decrease with increasing temperature due to the increase in the conductivity of the sample. The equivalent circuit (physical model) appropriate to these plots is shown in the inset of Fig. 9. The impedance data at all the temperatures can also be fitted with the above equivalent circuit. The equivalent circuit consists of a CPE2, acting as a blocking double layer capacitance in series with the parallel combination of bulk resistance (R2) and constant phase element (CPE1), where CPE is generally considered as a leaky capacitor (i.e. hybrid between a resistor and a capacitor). Ideally the impedance assembly related to the process of charge transport in the bulk specimen is represented by parallel combination of Rb and Cb,8 where Rb represents the bulk resistance and capacitance Cb arises due to the electric relaxation process. But in this case we have replaced Cb with CPE1, which accounts for the observed depression of the semicircle and also the non-ideal electrolyte symmetry.9 CPE2 in the equivalent circuit accounts for the formation of the inclined straight line in the low frequency region. The ion conductivity at each temperature was obtained by using the relation
 | (2) |
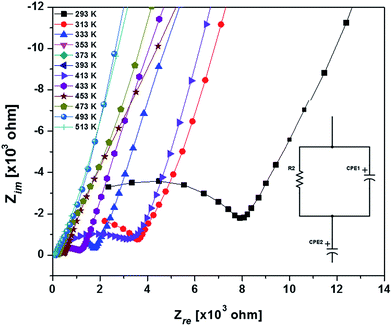 | ||
| Fig. 9 Nyquist plots of the sintered LLZO with Au blocking electrodes around room temperature (inset: the equivalent circuit i.e. physical model appropriate to Nyquist plots). | ||
Electrochemical properties of LLZO solid electrolyte based cell
Electrochemical measurements were carried out using a thin pellet of c-LLZO (0.15 mm thin, 0.608 cm2 area) by designing a novel hybrid Li//(1 M LiPF6 + c-LLZO)//LiCoO2 cell. Schematic representation of the cell is shown in Fig. 11. We report a novel strategy to investigate electrochemical performance of the Li-ion cell using solid electrolyte in combination with conventional organic electrolytes. Using electrolyte soaked paper in between electrode and electrolyte, greatly reduces the electrode/electrolyte interfacial resistance. The concept of this novel cell structure was established from the work presented by Liu et al. on Li–H2O2 semi fuel cell.43 A similar strategy was adopted by Kumazaki et al. who reported lithium plating stripping reaction at the Pt/LLZO pellet.44 Analogous to these reports, we have used conventional polypropylene separator soaked in 1 M LiPF6 with 1![[thin space (1/6-em)]](https://www.rsc.org/images/entities/char_2009.gif) :
:![[thin space (1/6-em)]](https://www.rsc.org/images/entities/char_2009.gif) 1 EC
1 EC![[thin space (1/6-em)]](https://www.rsc.org/images/entities/char_2009.gif) :
:![[thin space (1/6-em)]](https://www.rsc.org/images/entities/char_2009.gif) DMC, as Li+ conducting media between LLZO pellet and cathode/anode. This is to reduce the electrode/LLZO electrolyte interfacial resistance. RF magnetron sputter deposited LiCoO2 thin films coated on Pt/Si substrate has been used as positive electrode.
DMC, as Li+ conducting media between LLZO pellet and cathode/anode. This is to reduce the electrode/LLZO electrolyte interfacial resistance. RF magnetron sputter deposited LiCoO2 thin films coated on Pt/Si substrate has been used as positive electrode.
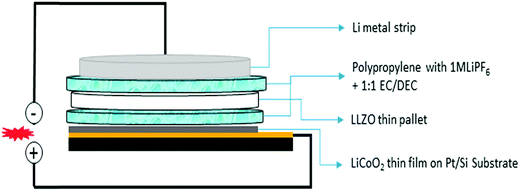 | ||
| Fig. 11 Schematic diagram of the hybrid electrochemical cell constructed in Li//(1 M LiPF6 + LLZO)//LiCoO2 configuration. | ||
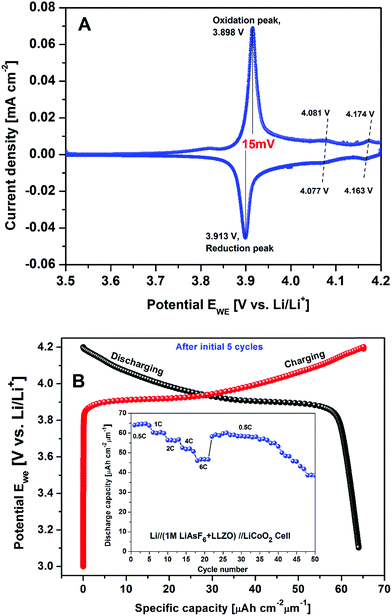
The galvanostatic and potentiostatic measurements on the cell are displayed in Fig. 12A and B, respectively. A cyclic voltammogram of cell measured in the cut-off potentials range from 4.2 to 3.0 V with a slow scan rate of 0.05 mV s−1 is shown in Fig. 12A. The cell exhibited completely reversible electrochemical reactions with one set of redox peak currents located at 3.898/3.913 V with a potential separation of 15 mV vs. Li/Li+ reference electrode. The higher current densities at redox peak potentials with complete reversibility indicate the signature of reduced IR drop and faster Li+ kinetics of the hybrid cell designed with the combination of organic and crystalline electrolyte. These results are well congruent with the previous results reported on the Li//LiCoO2 cell constructed with conventional organic electrolyte.45 Like the results reported on Li//LiCoO2 organic cell, two sets of tiny shoulder like redox couples were 4.081/4.077 V and 4.174/4.163 V (labeled in Fig. 12A as dashed lines I, II) corresponding to a phase transition of positive electrode.46 As can be seen, besides higher ionic conductive LLZO solid electrolyte, the conventional organic electrolyte separator sheet had a lower cathodic/anodic interfacial resistance in the cell as well. Lower resistance of the hybrid combination of LLZO + organic electrolyte structure resulted in higher performance of the lithium cell. From the CV plot (Fig. 12A), the average Li+ ion diffusion co-efficient in the electrochemical reaction can be obtained by the following equation47
| Ip = 2.69 × 10⁵An3/2CoDL1/2υ1/2 | (3) |
The potential–capacity relationship after 5 cycles is shown in Fig. 12B. Its inset presents the C-rate performance of the hybrid cell discharged for about 50 cycles after initial 5 cycles. At the end of each cycle, a study time of 1 h was maintained. Thus, it is evident that the hybrid combination of the cell exhibits the best rate performance with an average discharge capacity of 64.4, 60.3, 56.1, 51.9 and 46.9 μA h cm−2 μm−1 at 0.5C, 1C, 2C, 4C and 6C, respectively. Even after, the cell performance was observed to be consistent, when the cell was continued to run at 0.5C rate and delivered an average discharge capacity of 64.4 μA h cm−2 μm−1 (∼128 mA h g−1). This value is about 92.7% of the theoretical capacity of LiCoO2.45 These observations are consistent with the work reported by Iriyama et al. on c-LLZO/LiCoO2 interface modification with thin layer of Nb.48
Thus, the present c-LLZO based prototypic LIB exhibits fairly higher discharge capacity with higher coulombic efficiency with the hybrid combination of liquid and solid interface. These encouraging results are probably due to the combination of crystalline/organic electrolyte which derived the enhanced electronic conductivity. These observations are in good agreement with the CV measurements i.e. voltage plateaus observed in charge discharge curves are well matched with redox peak potentials observed from the CV curve.
A fairly large capacity fade (∼0.5 μA h cm−2 μm−1 per cycle) as compared to the cell designed with organic electrolytes after 50 cycles (0.12 μA h cm−2 μm−1 per cycle)49 remains as a week point of our prototypic LIB. We actually observed some traces of LiCoO2 cathode peel off, after the electrochemical measurements. Development of an all solid state LIB, now being in progress in our group will be an option to solve the problem.
Conclusions
In this study, we demonstrated a novel strategy to synthesize phase pure garnet structured LLZO with the formula Li6.61La3Zr2Al0.13O11.98 via a solid state route by calcining at 750 °C for 3 h in air. The average primary particle size was at around 100 nm, as consistently evaluated from electron micrograph, dynamic light scattering and XRD. This was achieved by starting from the highly reactive precursor prepared by a two-step mechanochemical process. By sintering at 1100 °C for 3 h in air after CIP brought about the relative density of 90.5%. The ionic conductivity of the sintered pellet in Au//c-LLZO//Au structure was examined at different temperatures ranging from 273 to 513 K at atmospheric pressure and observed to be in the order of 1.6 × 10⁻⁴ S cm−1 at 293 K. To elucidate its practical application as an electrolyte, we designed a hybrid cell with Li//(1 M LiPF6 + c-LLZO)//LiCoO2 configuration with a thin sheet of sintered c-LLZO pellet as Li+ conducting media and studied the electrochemical properties. The cyclic voltammogram of the cell exhibited a single set of redox couple with 15 mV of narrow voltage separation with a Li+ diffusion coefficient at RT of about 1.95 × 10⁻¹¹ cm2 s−1 at electrode/electrolyte i.e. LiCoO2//(1 M LiPF6 + c-LLZO) interface. The cell reached an average discharge capacity of 64.4 μA h cm−2 μm−1 in the first cycle, which is 92.7% of theoretical value of the cathode. Again, the electrochemical activity of the cell was examined at various discharge rates i.e. 0.5C, 1C, 2C, 4C and 6C. By comparison, this novel solid state reaction method shows great advantages for synthesizing phase pure c-LLZO material including lower calcination temperature and less heat treatment process than other reported methods. The present work provides a new and very promising method for the preparation of high-performance LLZO solid electrolytes for the development of all solid state lithium ion battery.Acknowledgements
This work was supported by V4-Japan Joint Research Program, Structure – function relationship of advanced nano-oxides for energy storage devices (AdOX) granted from Japan Science and Technology Agency. Partial support was also obtained from the Deutsche Forschungsgemeinschaft (DFG) Research Unit 1277 (molife) and the Ministry for Science and Culture (MWK) of the Federal State of Lower Saxony, Germany. Open Access was financed by Leibniz Universität Hannover, Germany.References
- C. Cao, Z. B. Li, X. L. Wang, X.-B. Zhao and W.-Q. Han, Frontiers in Energy Research, 2014, vol. 2 Search PubMed.
- B. Scrosati and J. Garche, J. Power Sources, 2010, 195, 2419–2430 CrossRef CAS.
- P. Verma, P. Maire and P. Novák, Electrochim. Acta, 2010, 55, 6332–6341 CrossRef CAS.
- B. S. Joo Gon Kim, S. Mukherjee, N. Schuppert, A. Bates, O. Kwon, M. J. Choi, H. Y. Chung and S. Park, J. Power Sources, 2015, 282, 299–322 CrossRef.
- V. Thangadurai, S. Narayanan and D. Pinzaru, Chem. Soc. Rev., 2014, 43, 4714–4727 RSC.
- J. B. Goodenough and P. Singh, J. Electrochem. Soc., 2015, 162, A2387–A2392 CrossRef CAS.
- R. Murugan, V. Thangadurai and W. Weppner, Angew. Chem., Int. Ed., 2007, 46, 7778–7781 CrossRef CAS PubMed.
- S. Ohta, T. Kobayashi, J. Seki and T. Asaoka, J. Power Sources, 2012, 202, 332–335 CrossRef CAS.
- J. L. Allen, J. Wolfenstine, E. Rangasamy and J. Sakamoto, J. Power Sources, 2012, 206, 315–319 CrossRef CAS.
- C. Bernuy-Lopez, W. Manalastas, J. M. Lopez del Amo, A. Aguadero, F. Aguesse and J. A. Kilner, Chem. Mater., 2014, 26, 3610–3617 CrossRef CAS.
- L. Robben, E. Merzlyakova, P. Heitjansb and T. M. Gesing, Acta Crystallogr., Sect. E: Crystallogr. Commun., 2016, 72, 287–289 CrossRef CAS PubMed.
- R. Wagner, G. J. Redhammer, D. Rettenwander, A. Senyshyn, W. Schmidt, M. Wilkening and G. Amthauer, Chem. Mater., 2016, 28, 1861–1871 CrossRef CAS PubMed.
- H. Buschmann, J. Dolle, S. Berendts, A. Kuhn, P. Bottke, M. Wilkening, P. Heitjans, A. Senyshyn, H. Ehrenberg, A. Lotnyk, V. Duppel, L. Kienle and J. Janek, Phys. Chem. Chem. Phys., 2011, 13, 19378–19392 RSC.
- C. A. Geiger, E. Alekseev, B. Lazic, M. Fisch, T. Armbruster, R. Langner, M. Fechtelkord, N. Kim, T. Pettke and W. Weppner, Inorg. Chem., 2011, 50, 1089–1097 CrossRef CAS PubMed.
- H. Xie, Y. Li and J. B. Goodenough, Mater. Res. Bull., 2012, 47, 1229–1232 CrossRef CAS.
- I. Kokal, M. Somer, P. H. L. Notten and H. T. Hintzen, Solid State Ionics, 2011, 185, 42–46 CrossRef CAS.
- Y. Zhang, J. Cai, F. Chen, R. Tu, Q. Shen, X. Zhang and L. Zhang, J. Alloys Compd., 2015, 644, 793–798 CrossRef CAS.
- L. Cheng, J. S. Park, H. Hou, V. Zorba, G. Chen, T. Richardson, J. Cabana, R. Russo and M. Doeff, J. Mater. Chem. A, 2014, 2, 172–181 RSC.
- A. Düvel, A. Kuhn, L. Robben, M. Wilkening and P. Heitjans, J. Phys. Chem. C, 2012, 116, 15192–15202 CrossRef.
- E. Rangasamy, J. Wolfenstine, J. Allen and J. Sakamoto, J. Power Sources, 2013, 230, 261–266 CrossRef CAS.
- S. W. Baek, J. M. Lee, T. Y. Kim, M. S. Song and Y. Park, J. Power Sources, 2014, 249, 197–206 CrossRef CAS.
- M. Kotobuki, K. Kanamura, Y. Sato and T. Yoshida, J. Power Sources, 2011, 196, 7750–7754 CrossRef CAS.
- J. M. Lee, T. Kim, S. W. Baek, Y. Aihara, Y. Park, Y. I. Kim and S. G. Doo, Solid State Ionics, 2014, 258, 13–17 CrossRef CAS.
- J. Tan and A. Tiwari, ECS Solid State Lett., 2012, 1, Q57–Q60 CrossRef CAS.
- N. Janani, C. Deviannapoorani, L. Dhivya and R. Murugan, RSC Adv., 2014, 4, 51228–51238 RSC.
- J. S. Chappell, T. A. Ring and J. D. Birchall, J. Appl. Phys., 1986, 60, 383 CrossRef CAS.
- R. L. Coble, J. Appl. Phys., 1961, 32, 787 CrossRef CAS.
- J. Hojo, R. Oono and A. Kato, J. Mater. Sci., 1980, 15, 2335–2344 CrossRef CAS.
- E. Ino, J. Soc. Mater. Sci., 1976, 25, 1165–1168 CrossRef CAS.
- J. D. MacKenzie, M. E. Smith, P. Angerer and Y. Kameshima, Thermochim. Acta, 2000, 359, 87–94 CrossRef.
- D. A. C. Manning, E. I. C. Rae and J. S. Small, Mineral. Mag., 1991, 55, 183–195 CrossRef CAS.
- W. Xia, B. Xu, H. Duan, Y. Guo, H. Kang, H. Li and H. Liu, ACS Appl. Mater. Interfaces, 2016, 8, 5335–5342 Search PubMed.
- Y. H. Zhang, F. Chen, R. Tu, Q. Shen and L. M. Zhang, Key Eng. Mater., 2014, 616, 217–222 CrossRef.
- A. A. Hubaud, D. J. Schroeder, B. Key, B. J. Ingram, F. Dogan and J. T. Vaughey, J. Mater. Chem. A, 2013, 1, 8813 RSC.
- R. J. Chen, M. Huang, W. Z. Huang, Y. Shen, Y. H. Lin and C. W. Nan, Solid State Ionics, 2014, 265, 7–12 CrossRef CAS.
- F. Tietz, T. Wegener, M. T. Gerhards, M. Giarola and G. Mariotto, Solid State Ionics, 2013, 230, 77–82 CrossRef CAS.
- A. Orera, G. Larraz, J. A. R. Velamazan, J. Campo and M. L. Sanjuan, Inorg. Chem., 2016, 55, 1324–1332 CrossRef CAS PubMed.
- A. K. Jonscher, Nature, 1977, 267, 673–679 CrossRef CAS.
- J. Sakamoto, E. Rangasamy, H. Kim, Y. Kim and J. Wolfenstine, Nanotechnology, 2013, 24, 424005 CrossRef PubMed.
- Y. Shimonishi, A. Toda, T. Zhang, A. Hirano, N. Imanishi, O. Yamamoto and Y. Takeda, Solid State Ionics, 2011, 183, 48–53 CrossRef CAS.
- S. Afyon, F. Krumeich and J. L. M. Rupp, J. Mater. Chem. A, 2015, 3, 18636–18648 RSC.
- G. M. C. C. W. Ban, Solid State Ionics, 2001, 140, 285–292 CrossRef.
- K. Liu and C.-A. Wang, Electrochem. Commun., 2014, 48, 147–150 CrossRef CAS.
- S. Kumazaki, Y. Iriyama, K.-H. Kim, R. Murugan, K. Tanabe, K. Yamamoto, T. Hirayama and Z. Ogumi, Electrochem. Commun., 2011, 13, 509–512 CrossRef CAS.
- P. Jeevan Kumar, K. Jayanth Babu and O. M. Hussain, Mater. Chem. Phys., 2014, 143, 536–544 CrossRef CAS.
- C. M. Julien, K. Zaghib and H. Groult, Inorganics, 2014, 2, 132–154 CrossRef CAS.
- P. Jeevan Kumar, K. Jayanth Babu, O. M. Hussain and C. M. Julien, Ionics, 2012, 19, 421–428 CrossRef.
- T. Kato, T. Hamanaka, K. Yamamoto, T. Hirayama, F. Sagane, M. Motoyama and Y. Iriyama, J. Power Sources, 2014, 260, 292–298 CrossRef CAS.
- P. Jeevan Kumar, K. Jayanth Babu, O. M. Hussain and C. M. Julien, Ionics, 2012, 19, 421–428 CrossRef.
| This journal is © The Royal Society of Chemistry 2016 |

