Urine metabolic phenotypes analysis of extrahepatic cholangiocarcinoma disease using ultra-high performance liquid chromatography-mass spectrometry

Xinxin Wang*a, Jun Lib and Ai-Hua Zhang*b
aHeilongjiang Province Land Reclamation Headquarters General Hospital, Heilongjiang Agriculture and Reclamation Bureau, Hashuang Road 235, Nangang District, Harbin 150088, China
bSchool of Pharmacy, Heilongjiang University of Chinese Medicine, Heping Road 24, Xiangfang District, Harbin 150040, China. E-mail: aihuatcm@163.com; Fax: +86-451-86053141; Tel: +86-451-86053141

Received 12th April 2016 , Accepted 1st June 2016

First published on 2nd June 2016


Abstract

Extrahepatic cholangiocarcinoma (ECC) is the second most common type of malignant primary tumor with a poor survival rate and an increasing global trend. However, the metabolic phenotype characteristics of ECC have not been explored. Metabolomics has shown significant potential in identifying small molecules specific to disease phenotypes. In this study, liquid chromatography-mass spectrometry (LC/MS) in combination with multivariate statistical analysis was conducted to explore the urine metabolic changes of ECC. An untargeted metabolomics assay was conducted on urine samples of ECC patients and healthy controls. Multivariate pattern recognition analysis was used to reduce the high dimensionality of the metabolome dataset, differentiating between the ECC patients and healthy subjects. Score plots of the spectra revealed the separation between the ECC cases and controls for the level of metabolites. A total of 19 differential metabolites were identified and contributed to ECC. In the pathway analysis, a total of 29 significant metabolic pathways were identified. All the metabolic perturbations in the ECC disease status are associated with three key pathways, including pyruvate metabolism and citrate cycle, and these metabolic pathways may provide a potentially new target for diagnosis and therapy. Of note, network analysis found that abnormally expressed metabolites were tightly correlated with the metabolism pathway. The identified differential metabolites and metabolic pathways responsible for ECC were all imported into a web tool for network-based interpretation of compound lists to interpret their functional context, molecular mechanisms and disturbed pathways. Overall, it demonstrated that clinical metabolomics may highlight biomarkers and pathways and can capture subtle metabolic phenotype changes from ECC, which may lead to an improved mechanistic understanding of ECC.

Introduction

Cholangiocarcinoma is the primary epithelial cell cancer of the biliary tract and the second most prevalent form of primary hepatic tumor.1 Cholangiocarcinoma can be broadly divided into intrahepatic and extrahepatic cholangiocarcinoma (ECC) and is a devastating tumor with a high mortality rate.2 Due to a late diagnosis, ECC is associated with a high rate of mortality and a poor prognosis. In general, imaging techniques (ultrasound, MRI, MRCP, CT) are of limited sensitivity for the detection of ECC.3 To date, complete surgical resection has been regarded as the only curative option for ECC patients.4 However, the resectability rate of ECC cases has been low, as the majority of patients are at an advanced stage of the disease at diagnosis. In clinical practice, little is known about the molecular changes and mechanisms that are involved in the pathogenesis and pathophysiology of ECC. To improve survival rates, new efforts should be devoted to the discovery of new biomarkers to monitor ECC patients. Fortunately, high-throughput metabolomics technology has been used to explore the marker metabolites, potentially diagnostic biomarkers for a deeper understanding of diseases.5,6

Metabolomics are the endpoints of genotype functions and biochemical phenotypes in the body and are linked closely to alterations in function and facilitate biomarker discovery.7 Moreover, it constructs a unique “metabolic profile” through monitoring the endogenous metabolites in a given biological sample rather than focusing on individual metabolites to provide comprehensive insights into the biological processes reflected in the terminal symptoms of the metabolic network and aims to gather the metabolic information of a biological system.8 Mass spectrometry-based metabolic profiling of urine offers an information-rich matrix for discovering candidate biomarkers with diagnostic potential.9–11 Over the past decade, it has been successfully applied to characterize the metabolic signatures for various diseases, including depression, Alzheimer's disease, Parkinson's disease, cancers, and diabetes.12–16 However, few studies have investigated the metabolic alterations associated with the responses to ECC disease.

Recent technological breakthroughs have provided researchers with the capacity to measure even thousands of low-molecular-weight metabolites in a few minutes, paving the way for the identification of novel biomarkers in diseases.17 LC/ESI-Q/TOF-MS with data mining strategies [unsupervised principal components analysis (PCA) and supervised projection to latent structure with discriminant analysis (OPLS-DA)] has been successfully applied to the study of human diseases.18–20 However, reliable biomarkers for the early diagnosis of ECC are urgently required to reduce the mortality rate and there are few works aimed at gaining deeper insights into ECC. In this study, we hypothesized that urine metabolite profiles could differentiate between the ECC phenotypes and established a non-targeted LC/ESI-Q/TOF-MS metabolomics technology in conjunction with data mining analysis, discriminated the urine profiles of healthy controls and ECC to investigate the metabolites associated with ECC disease status.

Materials and methods

Ethical statement

All participants provided informed consent prior to collection of any data. The study protocol was approved by the Ethical Committee of Heilongjiang University of Chinese Medicine and was conducted according to the principles expressed in the Declaration of Helsinki. All participants agreed to participate in this study were obtained to sign consent forms.

Subjects

Patients were collected from the Hospital of Heilongjiang University of Chinese Medicine, China. A total of 60 ECC (male/female, 32/28) patients and 60 control subjects (n = male/female, 30/30) were recruited in this study. The outcomes of the Health Survey Questionnaire in patients with ECC and the normal controls were assessed, and the related clinical information, basic syndrome of ECC was also collected (ESI Table S1).

Sample preparation

Urine samples were centrifuged at 13[thin space (1/6-em)]000 rpm for 10 min at 4 °C to remove any solid debris. 10 mL aliquots of the resulting supernatants were immediately stored at −80 °C for UPLC/MS analysis. The thawed urine samples were collected via centrifugation at 13[thin space (1/6-em)]000 rpm for 10 minutes at 4 °C and then filtered through a 0.22 μm syringe filter. A 5 μL aliquot of the supernatant was injected into the UPLC/MS.

Chemicals and reagents

Methanol and acetonitrile, HPLC grade, were obtained from Fisher Scientific Corporation (Loughborough, UK) and Merck (Darmstadt, Germany), respectively. Leucine enkephalin was purchased from Sigma-Aldrich (St. Louis, MO, USA). Water was obtained from a Milli-Q ultra-pure water system (Millipore, Billerica, USA).

Chromatography

A 5 μL aliquot of the pre-treated sample was injected into a 100 mm × 2.1 mm (1.7 μm) Acquity C18 BEH column (Waters Technologies, Millford, MA, USA) UPLC system (ACQUITY UPLC, Waters, Millford, MA, USA). The column oven temperature was set to 45 °C, the injection volume was 5 μL and flow-rate was 0.5 mL min−1 without a split. The mobile phase was a mixture of acetonitrile containing 0.1% formic acid (A) and water containing 0.1% formic acid (B). A linear mobile phase gradient was used as follows: 2% A, held for 2 min; 2–4 min, increased to 90% A; 4–6 min, held at 90% A; 6–7 min, decreased to 2% A; and 7–8 min, held at 2% A. After every 10 sample injections, a pooled QC sample was injected to ensure the performance of the UPLC system.

Mass spectrometry

Mass spectrometry was performed using a Waters Micromass Q-TOF micro High Definition Mass Spectrometer (Synapt HDMS, Waters, U.K.) operating in both positive and negative ion modes. The following parameters were employed: source temperature at 120 °C; the desolvation temperature was set at 300 °C; the capillary voltage was set at 2500 V and cone voltage at 30 V. Nitrogen was used as the dry gas, the desolvation gas flow rate was set at 550 L h−1 and the cone gas flow was maintained at 60 L h−1. The collision energy was set at 30 eV for the identification of potential metabolites. All the data were acquired using an independent reference lock mass (Leucine enkephalin) to ensure the accuracy and reproducibility during the MS analysis. Centroid data were collected in full scan mode from 50 to 1500 m/z.

Multivariate pattern recognition

The preprocessed data obtained for the ion intensities were exported to EZinfo v2.0 software for multivariate analysis. Principal component analysis (PCA) was first used to detect the separation trends. The variable importance in the projection (VIP) for metabolites was calculated based on the PLS-DA model, a supervised pattern recognition method. In addition, a Student's t-test was used to further validate the significance of each metabolite. Potential metabolic biomarkers were selected using VIP > 10 and P < 0.05. To visualize the metabolite changes, the standardized metabolite level in the groups was plotted in a heat map that was implemented in MetaboAnalyst (http://www.metaboanalyst.ca/). After transforming the data with unit variance scaling, hierarchical clustering analysis (HCA) based on the Euclidean distance coefficient and average linkage method was performed using MetaboAnalyst to cluster both the conditions and the identified metabolites.

Metabolite identification

Exact MS data from redundant m/z peaks were first used to help confirm the metabolite molecular mass. The identification of the candidate biomarkers was based on the retention behaviors and mass assignment. MassFragment™ application manager (Waters Corp., Milford, USA) was used to facilitate the MS/MS fragment ion analysis. The accurate mass and structural information of the candidate metabolites was matched with those of metabolites obtained from online databases, HMDB (http://www.hmdb.ca), METLIN (http://www.metlin.scripps.edu/) and Lipid Maps (http://www.lipidmaps.org/). The mass tolerance between the measured m/z values and the exact mass of the components was within 5 mDa.

Pathway analysis

For the metabolites that were significantly changed, pathway analysis was performed using MetaboAnalyst, a web-based metabolomics data analysis software. The MetaboAnalyst tool was then used to identify the top affected metabolic pathways and facilitate further biological interpretation. Pathway analysis & visualization using the KEGG pathway database was conducted using the MetaboAnalyst tool based on databases such as KEGG and HMDB. In addition, pathway topology analysis was used to estimate the impact of metabolites in a certain metabolic pathway and a relative-betweens centrality test was used to estimate the impact.

Results

Metabolic profiling of ECC patients vs. matched controls

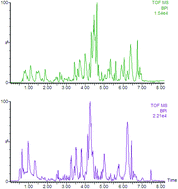
Urine samples were analyzed in both positive and negative ionization modes using UPLS/MS. A full-scan detection of urine metabolites was conducted in ECC patients and healthy controls. The BPI chromatograms exhibited an ideal separation result under the optimized gradient elution procedure (Fig. 1). The PCA score plot (Fig. S1) shows a clear cluster of the QC samples, indicating that the instrument has high stability and reproducibility. After alignment and normalization of the data sets, multivariate statistical analyses were conducted. To maximize the differences between the groups and determine the variables that contribute to discrimination, the OPLS-DA, a supervised pattern recognition method, was further employed for metabolic data. As shown in the PLS-DA score plots, the urine samples from ECC patients and well-matched controls were clearly separated into two categories (Fig. 2). A clustering of some samples becomes apparent, which suggests that urinary biochemical perturbation significantly occurred in the ECC group.
image file: c6ra09430a-f1.tif
Fig. 1 Typical base peak chromatograms of ECC and healthy subjects using ultra-high performance liquid chromatography-mass spectrometry in positive ion mode.

image file: c6ra09430a-f2.tif
Fig. 2 Metabolic profiles of ECC patients (black) and healthy individuals (red) in positive ion mode (A) and negative ion mode (B).

Differential metabolites related to ECC

For further analysis of feature ions, the VIP-plot from the OPLS was conducted to select distinct variables as potential biomarkers for distinguishing ECC patients from healthy controls (Fig. 3). With the criteria of VIP > 10 and P < 0.05, 19 metabolites were identified as potential biomarkers for primary ECC. The panel of metabolites includes 3-methylhistidine, citric acid, cytosine, indoleacetic acid, salicyluric acid, L-methionine, aminomalonic acid, glutaric acid, ursodeoxycholic acid, N-acetylornithine, allantoin, glycocholic acid, histamine, homogentisic acid, L-kynurenine, sarcosine, pyruvic acid, taurine and methylsuccinic acid. It was found that among them, 11 compounds were up-regulated and 8 were down-regulated. Detailed information on metabolite identification can be found in ESI Table S2. Finally, these metabolites were selected as candidate markers for further validation. Furthermore, the results of the heat map based on the Euclidean distance and the Ward's method using MetaboAnalyst exhibited different distribution patterns for the metabolites between the ECC and control groups (Fig. 4). Furthermore, we combined analysis of the differential metabolites in the positive and negative ion mode using the MetaboAnalyst tool. The principal component analysis scores plot of the differential metabolites related to XDS shows a clear separation between these groups, which suggests that serum biochemical perturbation significantly occurred in ECC patients (Fig. 5). VIP scores were used to rank the contribution of metabolites to the discrimination between the XDS and healthy groups, which are based on the weighed coefficients of the OPLS-DA model (Fig. 6).
image file: c6ra09430a-f3.tif
Fig. 3 Differential metabolites obtained from the VIP-plot derived from the OPLS-DA models in positive ion mode (A) and negative ion mode (B).

image file: c6ra09430a-f4.tif
Fig. 4 Heatmap of the differential metabolites. The columns show the expression levels and each row represents a metabolite listed in Table S1. The red color indicates the up-regulated metabolites, whereas the green color represents the down-regulated metabolites.

image file: c6ra09430a-f5.tif
Fig. 5 Principal component analysis scores plot of the differential metabolites in ECC patients.

image file: c6ra09430a-f6.tif
Fig. 6 VIP scores analysis based on the weighted coefficients of the OPLS-DA model used to rank the contribution of metabolites to the discrimination between the ECC and healthy groups.

Pathway analysis

The biological pathways involved in the metabolism of these 19 metabolites and their biological roles were determined by pathway topology analysis using MetaboAnalyst mapped to the KEGG and SMPD reference pathways (Fig. 7). All the matched pathways were shown according to the pathway impact values obtained from the pathway topology analysis (x-axis), with the most impacted pathways (impact > 0.1) considered closely related to the development of ECC (ESI Table S3). These pathways include taurine and hypotaurine metabolism, pyruvate metabolism and citrate cycle.
image file: c6ra09430a-f7.tif
Fig. 7 The metabolic pathways related to ECC, as analyzed by MetaboAnalyst. The map was generated using the reference map by KEGG. Note: (a) taurine and hypotaurine metabolism; (b) pyruvate metabolism and (c) citrate cycle.

Integrated metabolic network

The differential metabolites and corresponding pathways were imported into Cytoscape software for visualization of the interaction network model. As seen in Fig. 8, the association network of differentially expressed metabolites using Cytoscape was constructed. Networks are represented as graphs where the green and red nodes represent pathways and related metabolites detected, respectively. Altogether, our findings reveal these metabolic pathways may serve as signaling modules in ECC. The networks clearly help us to better understand the mechanisms underlying ECC. Of note, most differential metabolites can been included in networks together through indirect interactions or intermediate partners. The closely connected metabolites may be regarded as the target signatures. Herein, the network visualisation of the biochemical connectivity between the differential metabolites and their corresponding pathways using correlation analysis has been demonstrated as a novel method to generate hypotheses of the regulation and response to perturbation in ECC.
image file: c6ra09430a-f8.tif
Fig. 8 The integrated metabolic network in the ECC subjects. Altered metabolites were mapped to KEGG and SMPDB reference pathways and interaction networks were generated in Cytoscape. The network nodes (green and red) represent the pathways and related metabolites detected, respectively.

Discussion

The incidence and rate of recurrence of ECC is high, particularly in developed countries. However, current methods for diagnosis are limited to detecting high-grade tumours often using invasive methods. Early diagnosis allows for timely therapeutic intervention, which in turn results in longer survival and better quality of life. Metabolic changes are associated with a number of complex diseases. A panel of biomarkers used to characterize disease could be useful for ECC diagnostics. Metabolomics suggests that there is a great potential for candidate metabolite discovery; metabolite signatures may also have potential to be used as diagnostic biomarkers.21–23 In this study, high-throughput LC/MS and multiple data processing methods and network analysis provide a powerful approach to clearly differentiate patients with ECC and identify the potential biomarkers. To the best of our knowledge, this study is the first to examine urine metabolic changes in response to ECC. PCA revealed a statistically significant separation between the ECC and control samples. Interestingly, 19 distinct metabolites were identified in the ECC subjects compared to the controls. Of note, four metabolism pathways were found and that the most altered functional pathway was associated with ECC. Furthermore, network analysis found that the abnormally expressed metabolites were tightly correlated with the metabolism pathway. These biochemical changes are helpful to understand the key features of ECC.

Taurine (2-aminoethanesulfonic acid) is an organic acid. It is also a major constituent of bile. Taurine is a derivative of the sulfur-containing amino acid, cysteine. For mammalians, taurine synthesis occurs in the pancreas via the cysteine sulfinic acid pathway. In this pathway, the sulfhydryl group of cysteine is first oxidized to cysteine sulfinic acid by the enzyme cysteine dioxygenase. Cysteine sulfinic acid, in turn, is decarboxylated by sulfinoalanine decarboxylase to form hypotaurine. Taurine is conjugated via its amino terminal group with chenodeoxycholic acid and cholic acid to form the bile salts, sodium taurochenodeoxycholate and sodium taurocholate. This reaction is catalyzed by bile acid-CoA: amino acid N-acetyltransferase. In the body, this reaction occurs in hepatocytes and is the means by which bile acids recovered from the intestine are converted into bile salts before being released again into the bile. Pyruvate sits at an intersection of key pathways of energy metabolism. It is the end product of glycolysis and the starting point for gluconeogenesis and can be generated by the transamination of alanine. It can be converted by the pyruvate dehydrogenase complex to acetyl CoA, which can enter the TCA cycle or serve as the starting point for the synthesis of long chain fatty acids, steroids and ketone bodies. It also plays a central role in balancing the energy needs of various tissues in the body. Pyruvate participates in several key reactions and pathways. The citric acid cycle, which is also known as the TCA cycle or the Krebs cycle, is a series of enzyme-catalyzed chemical reactions of key importance in all living cells that use oxygen as part of cellular respiration. The TCA cycle begins with acetyl-CoA transferring its two-carbon acetyl group to the four-carbon acceptor compound to form a six-carbon compound. Most of the energy made available by the oxidative steps of the cycle is transferred as energy-rich electrons to NAD+, forming NADH. For each acetyl group that enters the citric acid cycle, three molecules of NADH are produced. At the end of each cycle, the four-carbon oxaloacetate is regenerated and the cycle continues.

After the experimental period, urine samples were collected and analyzed by LC-Q-TOF/MS. The OPLS model was built to find biomarkers of ECC. 19 metabolites, which are distributed in several metabolic pathways, were identified as potential biomarkers of ECC. In the present study, a metabolic profiling of urine including 19 metabolites was constructed for the diagnosis of ECC using UPLC-ESI-TOFMS. The proposed protocol determined 11 up-regulated molecules and 8 down-regulated molecules. All the abnormal levels of these metabolites in the plasma of ECC patients provide new insights into the occurrence and development of the disease. Clinical estimation of the metabolic biomarkers with hierarchical cluster analysis in urine samples from ECC patients and healthy volunteers indicated that the present metabolite profile could identify ECC patients from healthy individuals. The metabolites from taurine and hypotaurine metabolism, pyruvate metabolism, and citrate cycle were significantly altered. Such changes are expected to be reflected in wider coverage metabolic profiles, which may in turn be explored as potential biomarkers for ECC assessment and treatment. Network-based analysis offers a complementary tool to statistical and multivariate analysis methods typically applied to metabolomics datasets to identify metabolite differences in the physiological state. Taking these biomarkers as screening indexes, it revealed the pathological process of ECC through regulating the disturbed pathway of metabolism. This study demonstrates that the metabolomics approach can capture the subtle metabolic changes resulting from diseases, which may lead to an improved mechanistic understanding of ECC.

In this study, LC-MS combined with a pattern recognition analysis approach was used to simplify and quicken the identification of the metabolites of ECC. UPLC-MS based metabolomics could be an advanced tool to help us find metabolites with regards to its capacity of processing large datasets and classifying of sample groups, as well as its indiscriminative nature of biomarker and metabolite identification. Using the metabolomics platform, the statistically important variables with VIP > 10 were defined, many are in various stages of progress at the ECC. Furthermore, a panel of 19 candidate markers was found to differentiate between the ECC and healthy controls in the test cohort with complete separation by HCA. Consequently, the findings presented contribute to a better understanding of the molecular signature of ECC and may provide the biological background to pharmacological interventions in the future. Further study of these metabolites may facilitate the development of non-invasive biomarkers and more efficient therapeutic strategies for ECC. Network mapping onto reconstructed metabolic models is a novel addition to correlation analysis. Furthermore, we believe that this methodology will have general application within metabolomics. Bridging the gap between analysing large-scale untargeted metabolomics data and interpreting the biological regulation in relation to the entire network may benefit from combining metabolic networks. These findings yield a valuable and non-invasive tool that can engender new insights into the pathophysiology of ECC. However, there were several limitations. One is the relatively small sample size in each group, which might prevent the differences in some metabolites from being fully apparent. Further studies with more samples are required to confirm these findings. In addition, these potential biomarkers are needed to advance clinical translation.

Conclusions

In summary, we performed comprehensive metabolomics investigations on ECC disease, providing a holistic understanding of ECC. The metabolic profile of these samples was performed by rapid resolution LC/ESI-Q/TOF-MS, and the potential biomarkers were identified for ECC; furthermore, the metabolic pathway changes of ECC biomarkers were discovered. Significant metabolic alterations were observed in multivariate statistical methods and 19 differential biomarkers were identified, which indicated that ECC could cause more severe disturbances in taurine and hypotaurine metabolism, pyruvate metabolism, and citrate cycle. Overall, the results indicate that metabolic profiling is a powerful tool that can be used to explore the molecular basis of diseases and identify potential biomarkers.

Conflict of interests

The authors declare no competing financial interests.

Acknowledgements

This study was supported by grants from the Key Program of Natural Science Foundation of State (Grant No. 81302905), the Natural Science Foundation of Heilongjiang Province of China (H2015038) and the Youth Innovative Talent Program of Heilongjiang Province of China (UNPYSCT-2015118).

References

  1. A. Dos Santos, M. Court, V. Thiers, S. Sar, C. Guettier, D. Samuel, C. Bréchot, J. Garin, F. Demaugre and C. D. Masselon, Identification of cellular targets in human intrahepatic cholangiocarcinoma using laser microdissection and accurate mass and time tag proteomics, Mol. Cell. Proteomics, 2010, 9(9), 1991–2004 Search PubMed.
  2. L. Sulpice, M. Rayar, M. Desille, B. Turlin, A. Fautrel, E. Boucher, F. Llamas-Gutierrez, B. Meunier, K. Boudjema, B. Clément and C. Coulouarn, Molecular profiling of stroma identifies Osteopontin as an independent predictor of poor prognosis in intrahepatic cholangiocarcinoma, Hepatology, 2013, 58(6), 1992–2000 CrossRef CAS PubMed.
  3. T. Fujita, Analyzing risk factors for intrahepatic cholangiocarcinoma, Hepatology, 2013, 58(5), 1862–1863 CrossRef CAS PubMed.
  4. R. Chaiteerakij, J. D. Yang, W. S. Harmsen, S. W. Slettedahl, T. A. Mettler, Z. S. Fredericksen, W. R. Kim, G. J. Gores, R. O. Roberts, J. E. Olson, T. M. Therneau and L. R. Roberts, Risk factors for intrahepatic cholangiocarcinoma: association between metformin use and reduced cancer risk, Hepatology, 2013, 57(2), 648–655 CrossRef CAS PubMed.
  5. N. Oishi, M. R. Kumar, S. Roessler, J. Ji, M. Forgues, A. Budhu, X. Zhao, J. B. Andersen, Q. H. Ye, H. L. Jia, L. X. Qin, T. Yamashita, H. G. Woo, Y. J. Kim, S. Kaneko, Z. Y. Tang, S. S. Thorgeirsson and X. W. Wang, Transcriptomic profiling reveals hepatic stem-like gene signatures and interplay of miR-200c and epithelial-mesenchymal transition in intrahepatic cholangiocarcinoma, Hepatology, 2012, 56(5), 1792–1803 CrossRef CAS PubMed.
  6. Q. Liang, H. Liu, Y. Jiang, H. Xing, T. Zhang and A. Zhang, Discovering lipid phenotypic changes of sepsis-induced lung injury using high-throughput lipidomic analysis, RSC Adv., 2016, 6(44), 38233–38237 RSC.
  7. Q. Liang, C. Wang, H. Wu, Y. Zhu and A. Zhang, Metabolite fingerprint analysis of cervical cancer using LC-QTOF/MS and multivariate data analysis, Anal. Methods, 2014, 6, 3937 RSC.
  8. E. C. Chua, G. Shui, I. T. Lee, P. Lau, L. C. Tan, S. C. Yeo, B. D. Lam, S. Bulchand, S. A. Summers, K. Puvanendran, S. G. Rozen, M. R. Wenk and J. J. Gooley, Extensive diversity in circadian regulation of plasma lipids and evidence for different circadian metabolic phenotypes in humans, Proc. Natl. Acad. Sci. U. S. A., 2013, 110(35), 14468–14473 CrossRef CAS PubMed.
  9. P. Zheng, Y. Wang, L. Chen, D. Yang, H. Meng, D. Zhou, J. Zhong, Y. Lei, N. D. Melgiri and P. Xie, Identification and validation of urinary metabolite biomarkers for major depressive disorder, Mol. Cell. Proteomics, 2013, 12(1), 207–214 Search PubMed.
  10. Y. Li, S. Qiu and A. H. Zhang, High-throughput metabolomics to identify metabolites to serve as diagnostic biomarkers of prostate cancer, Anal. Methods, 2016, 8(16), 3284–3290 RSC.
  11. T. Kasukawa, M. Sugimoto, A. Hida, Y. Minami, M. Mori, S. Honma, K. Honma, K. Mishima, T. Soga and H. R. Ueda, Human blood metabolite timetable indicates internal body time, Proc. Natl. Acad. Sci. U. S. A., 2012, 109(37), 15036–15041 CrossRef CAS PubMed.
  12. Q. Liang, T. Zhang, Y. Jiang, H. Xing, C. Wang, B. Li and A. Zhang, Metabolomics of Alcoholic Liver Disease: A Clinical Discovery Study, RSC Adv., 2015, 5, 80381–80387 RSC.
  13. Q. Liang, C. Wang, B. Li and A. H. Zhang, Lipidomics Analysis Based on Liquid Chromatography Mass Spectrometry for Hepatocellular Carcinoma and Intrahepatic Cholangiocarcinoma, RSC Adv., 2015, 5, 63711–63718 RSC.
  14. Q. Liang, H. Liu, Y. Jiang, H. Xing, T. Zhang and A. Zhang, Discovering lipid phenotypic changes of sepsis-induced lung injury using high-throughput lipidomic analysis, RSC Adv., 2016, 6(44), 38233–38237 RSC.
  15. Q. Liang, H. Liu, T. Zhang, Y. Jiang, H. Xing and A. Zhang, Potential urine biomarkers from a high throughput metabolomics study of severe sepsis in a large Asian cohort, RSC Adv., 2015, 5, 102204–102209 RSC.
  16. T. Kasukawa, M. Sugimoto, A. Hida, Y. Minami, M. Mori, S. Honma, K. Honma, K. Mishima, T. Soga and H. R. Ueda, Human blood metabolite timetable indicates internal body time, Proc. Natl. Acad. Sci. U. S. A., 2012, 109(37), 15036–15041 CrossRef CAS PubMed.
  17. A. K. Arakaki, J. Skolnick and J. F. McDonald, Marker metabolites can be therapeutic targets as well, Nature, 2008, 456(7221), 443 CrossRef CAS PubMed.
  18. Q. Liang, H. Liu, T. Zhang, Y. Jiang, H. Xing and A. Zhang, High-throughput metabolic profiling for discovering metabolic biomarkers of sepsis-induced acute lung injury, RSC Adv., 2016, 6, 11008–11013 RSC.
  19. Q. Liang, H. Liu, T. Zhang, Y. Jiang, H. Xing and A. Zhang, Discovery of serum metabolites for diagnosis of mild cognitive impairment to Alzheimer's disease progression using an optimized metabolomics method, RSC Adv., 2016, 6, 3586–3591 RSC.
  20. Q. Liang, T. Zhang, Y. Jiang, H. Xing, C. Wang, B. Li and A. Zhang, Metabolomics-Based Screening of Salivary Biomarkers for Early Diagnosis of Alzheimer's Disease, RSC Adv., 2015, 5, 96074–96079 RSC.
  21. L. W. Finley, J. Lee, A. Souza, V. Desquiret-Dumas, K. Bullock, G. C. Rowe, V. Procaccio, C. B. Clish, Z. Arany and M. C. Haigis, Skeletal muscle transcriptional coactivator PGC-1α mediates mitochondrial, but not metabolic, changes during calorie restriction, Proc. Natl. Acad. Sci. U. S. A., 2012, 109(8), 2931–2936 CrossRef CAS PubMed.
  22. A. Sreekumar, L. M. Poisson, T. M. Rajendiran, A. P. Khan, Q. Cao, J. Yu, B. Laxman, R. Mehra, R. J. Lonigro, Y. Li, M. K. Nyati, A. Ahsan, S. Kalyana-Sundaram, B. Han, X. Cao, J. Byun, G. S. Omenn, D. Ghosh, S. Pennathur, D. C. Alexander, A. Berger, J. R. Shuster, J. T. Wei, S. Varambally, C. Beecher and A. M. Chinnaiyan, Metabolomic profiles delineate potential role for sarcosine in prostate cancer progression, Nature, 2009, 457(7231), 910–914 CrossRef CAS PubMed.
  23. T. Kasukawa, M. Sugimoto, A. Hida, Y. Minami, M. Mori, S. Honma, K. Honma, K. Mishima, T. Soga and H. R. Ueda, Human blood metabolite timetable indicates internal body time, Proc. Natl. Acad. Sci. U. S. A., 2012, 109(37), 15036–15041 CrossRef CAS PubMed.

Footnote

Electronic supplementary information (ESI) available. See DOI: 10.1039/c6ra09430a

This journal is © The Royal Society of Chemistry 2016