 Open Access Article
Graphene material prepared by thermal reduction of the electrochemically synthesized graphite oxide
B.
Gurzęda
a,
P.
Florczak
b,
M.
Wiesner
bc,
M.
Kempiński
bd,
S.
Jurga
be and
P.
Krawczyk
*a
aInstitute of Chemistry and Technical Electrochemistry, Poznań University of Technology, Berdychowo 4, 60-965 Poznań, Poland. E-mail: piotr.krawczyk@put.poznan.pl
bNanoBioMedical Centre, Adam Mickiewicz University, Umultowska 85, 61-614 Poznań, Poland
cDepartment of Crystal Physics, Faculty of Physics, Adam Mickiewicz University, Umultowska 85, 61-614 Poznań, Poland
dDepartment of Dielectrics Physics, Faculty of Physics, Adam Mickiewicz University, Umultowska 85, 61-614 Poznań, Poland
eDepartment of Macromolecular Physics, Faculty of Physics, Adam Mickiewicz University, Umultowska 85, 61-614 Poznań, Poland
First published on 1st July 2016
Abstract
In the present work we demonstrate a simple and effective way to produce bulk quantities of graphene material. For the first time, graphite oxide (GO), synthesized by electrochemical treatment of natural graphite in HClO4 aqueous solution, was used to obtain thermally exfoliated-reduced graphite oxide (TRGO). Herein, GO was thermally exfoliated and reduced at 500 °C in air, giving the final product of TRGO. Due to shock treatment, the volume of the synthesized TRGO drastically increased compared to the starting GO. Furthermore, the exfoliation process resulted in a significant decrease in the concentration of oxygen functionalities. The choice of GO exfoliation temperature was preceded by thermogravimetric analysis (TGA). TRGO was characterized using X-ray diffraction (XRD), Raman spectroscopy, X-ray photoelectron spectroscopy (XPS), scanning electron microscopy (SEM) and atomic force microscopy (AFM) analysis.
1. Introduction
Graphene materials are very attractive due to their unique chemical, mechanical, electronic and electrochemical properties.1–5 A one-atom-thick layer, known as graphene is characterized by its developed specific surface area, its high thermal and electrical conductivity and high optical transmittance.1,6 Graphene materials belong to the group of graphene-based materials, which includes multi-layer graphene and chemically modified forms of graphene-based materials. Moreover, materials formed from graphene, graphite oxide (GO) or another graphene containing precursors are also counted among the graphene materials.7 Graphene materials can be prepared by a variety of methods. Most of them are based on exfoliation processes, such as the mechanical exfoliation of graphite realized by micromechanical cleavage, sonication, ball milling,2 thermal exfoliation and re-exfoliation,8–10 as well as electrochemical exfoliation.11 Graphene can also be synthesized from graphite/graphene oxide by its thermal, chemical, electrochemical reduction,12–14 chemical vapour deposition on metal catalysts15 and by the unzipping of carbon nanotubes.16 The method applied in the production of graphene materials, as well as the specific conditions, have a strong effect on their characteristics, enabling their different applications in i.e. energy storage devices, electronics, catalyst supports, sensors, biomedicines and composite materials.12,17,18One of the most promising methods for the preparation of bulk quantities of graphene material is the thermal exfoliation of GO accompanied by its reduction.19,20 During these processes, most of the oxygen functionalities are removed from the graphitic structure. Simultaneously, the volume of thermally exfoliated-reduced graphite oxide (TRGO), the product of these processes, significantly increases compared to that of the starting material.21 GO can be exfoliated and reduced yielding TRGO by a rapid thermal treatment at 1050 °C in air or an argon atmosphere.21–24 TRGO is also produced by the heating of GO at elevated temperatures up to 1000 °C under an inert gas flow (nitrogen or argon)13,14,25 or in the presence of hydrogen, used as a reducing agent. The use of a hydrogen atmosphere enables the entire removal of oxygen functional groups from GO.20 On a much smaller scale, the exfoliation–reduction process of GO can be carried out using microwave treatment.26,27 The properties of TRGO depend on many factors; among these, the method used, the properties of the applied precursor and conditions (atmosphere, treatment time, temperature) seem to be the most important.1,12,13,24,26 As can be seen from the literature data, most of the research works are concerned with the exfoliation–reduction process of chemically prepared GO.14,19–26
The present work describes a modification of the method to produce bulk quantities of graphene material. Based on our current knowledge, this is the first time that GO, synthesized by the deep anodic oxidation of graphite in perchloric acid, was used as a precursor in order to obtain TRGO. The process of GO exfoliation was carried out at relatively low temperature under an air atmosphere. The synthesized graphene material was characterized by various techniques, such as X-ray diffraction (XRD), Raman spectroscopy, scanning electron microscopy (SEM) and X-ray photoelectron spectroscopy (XPS). Additionally, to prove the formation of multi-layer graphene, the characterization of TRGO by atomic force microscopy (AFM) was performed.
2. Experimental
2.1. Preparation of GO
In order to obtain graphite oxide, natural graphite flakes (purity 99.5%, flake size 170–283 μm, Graphit Kropfmühl, Germany), playing the role of the working electrode, was electrochemically oxidized in an aqueous solution of 8 M HClO4 (purity 71%, Merck, Germany) using a linear sweep voltammetry method (LSV). Platinum wire (purity 99.9%, 1 mm diameter, Goodfellow, United Kingdom) was used as a counter electrode, whereas Hg/Hg2SO4/1 M H2SO4 was a reference electrode. LSV measurements were performed in the potential range from the rest potential of the electrode (ER) to 1.4 V with the scan rate equal to 0.01 mV s−1. The details of GO formation can be found in our previous work.282.2. Thermal reduction of GO
TRGO was prepared through the thermal treatment of the previously synthesized GO. The target product is the result of the thermal reduction of GO accompanied by its exfoliation. A ceramic crucible containing GO was promptly inserted into the muffle furnace adjusted to 500 °C. Heat treatment was carried out in an air atmosphere for 4 min. After the process, the as-prepared TRGO was rapidly removed from the furnace and allowed to cool in air to reach room temperature.2.3. Preparation of sample for AFM
In order to perform AFM measurements, a colloidal suspension of the synthesized material was prepared. First, a mixture of TRGO (concentration 0.1 mg ml−3) in dimethylformamide (DMF) (purity 99.8%, POCH, Poland) was sonicated for 1 hour. Consecutively, the prepared suspension was centrifuged at 4000 rpm for 15 min. The gathered supernatant was transferred into a silicon substrate and kept for solvent evaporation.2.4. Instrumentation
The process of GO preparation was carried out using an Autolab PGSTAT 302N potentiostat/galvanostat (Metrohm, Netherlands) by the LSV technique. The exfoliation–reduction of GO was performed in a Nabertherm LE 14/11/P300 muffle furnace (Nabertherm, Germany). TRGO dispersion was reached by sonication using an ultrasonic bath SONOREX RK 52, HF-Frequency 35 kHz (Bandelin, Germany). During the thermogravimetric analysis (TGA) (Setaram France), the GO sample was heated up to 800 °C with a heating rate of 5 °C min−1. The morphology of TRGO was characterized using a JSM-7001F scanning electron microscope (SEM) (Jeol, Japan), whereas structural characterization was carried out by X-ray diffraction (XRD) and Raman spectroscopy. XRD analysis was carried out on a Empyrean diffractometer (PANalytical, Netherlands) using Cu Kα radiation (1.54 Å), a reflection-transmission spinner (sample stage) and a PIXcel 3D detector, operating in the Bragg–Brentano geometry. 2 Theta scans were recorded at room temperature with angles of 2 Theta ranging from 4° to 60°, with a step size of 0.006° in a continuous scan mode. Raman spectra were recorded using an inVia Raman Microscope (Renishaw, United Kingdom) with a 514 nm laser excitation source. In order to examine the concentration of surface oxygen functionalities, X-ray photoelectron spectroscopy (XPS) was performed. XPS spectra were obtained with a Sphera II photoelectron energy analyzer (Scienta Omicron, Germany) with the monochromatized Al Kα X-ray source mounted inside the UHV system. The surface topography of TRGO was investigated by an atomic force microscope Bruker Dimension Icon (Bruker, Germany) using a standard tapping mode with a scan rate of 0.1 Hz. The thickness and size distributions of TRGO were estimated using Gwyddion software.293. Results and discussion
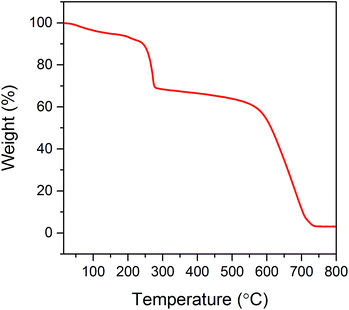
Thermal stability of the electrochemically synthesized GO was investigated by thermogravimetric analysis (TGA). The results of this measurement allow the determination of the temperature of GO exfoliation. The thermogravimetric curve shows two major effects associated with the mass loss (see Fig. 1). The first one at 230 °C corresponds to the removal of most of oxygen-containing functional groups from the GO structure (almost 32% loss of starting weight). The latter decrease in sample weight (above the temperature of 550 °C) is associated with the thermal decomposition of GO. When the temperature of 800 °C is reached, the entire sample is burned out. In order to provide appropriate conditions for the exfoliation–reduction of GO, thereby avoiding its thermal decomposition, the temperature was adjusted to 500 °C. From the literature data, it is known that most of the oxygen functionalities within the GO start to decompose at a temperature of around 250 °C.1,13,24 Therefore, due to the thermal shock treatment, at the selected temperature (500 °C), an abrupt decomposition of oxide functionalities chemically bonded to the graphene layers occurs. The gaseous products of the above-mentioned decomposition (CO2, CO and water) are accumulated within the interlayer spaces of the graphitic structure. The increasing amount of produced gases leads to the increase in pressure. When the mechanical strength of the graphene layers is exceeded, the gaseous products of GO decomposition are abruptly thrown out from the structure. The violent character of this process results in some deformation of the graphene layers, which is accompanied by a tremendous increase in the sample volume.Fig. 2a confirms that the thermal shock treatment of GO performed at 500 °C in air atmosphere yields TRGO of a significantly increased volume. Owing to the employed procedure, 90 mg of TRGO were synthesized from about 150 mg of GO. The loss of material due to thermal treatment is likely associated with the decomposition of oxygen groups followed by their removal from the graphene structures. The violent character of this process causes a significant disordering in the TRGO structure.30 The SEM images shown in Fig. 2b–d display that the most of the graphene layers pertaining to the synthesized material are crumpled and creased. However, some graphene sheets are also observed.
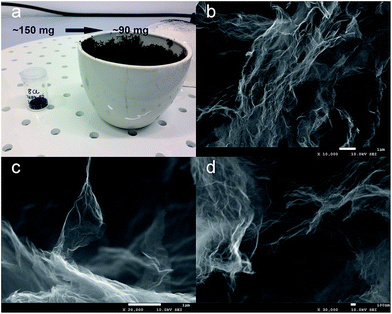 | ||
| Fig. 2 Digital photo of GO before thermal treatment and resulting TRGO (a), SEM images of synthesized TRGO recorded under different magnifications (b–d). | ||
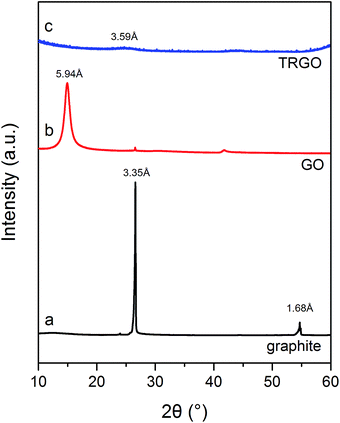
The XRD patterns of graphite, GO and TRGO are shown in Fig. 3. The pattern of graphite (Fig. 3a) exhibits characteristic sharp diffraction peaks at a 2 Theta value of 26.6° with a d spacing of 3.35 Å and a 2 Theta value of 54.8° with a d spacing of 1.68 Å, respectively. Curve b, recorded for GO, displays changes in the graphite structures caused by its electrochemical oxidation in 8 M HClO4. Due to the formation of oxygen groups on the graphite surface, the d spacing increased from 3.35 to 5.94 Å, thus revealing the GO formation. The appearance of the GO structure is also proved by the diffraction peak at 14.9° seen on curve b. The XRD pattern of TRGO (curve c) exhibits a small diffraction peak corresponding to an average d spacing of 3.59 Å. This indicates that during the exfoliation–reduction process, graphene layers of GO are transformed into non-crystalline graphene stacks with random interlayer spaces.13,24,31 The changes in the GO structure due to the thermal treatment yielding TRGO are also provided from Raman spectroscopy analysis.
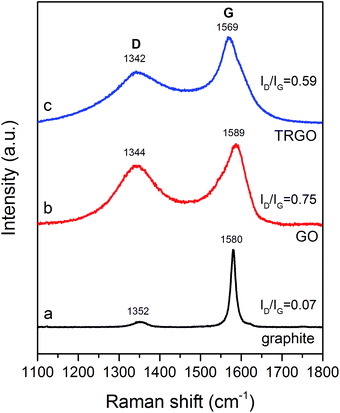
Raman spectroscopy is a technique commonly used to examine the degree of disorder of carbon materials. Fig. 4a shows two peaks, positioned at 1352 and 1580 cm−1, which are typical for a graphite structure. The first one, denoted as a D band peak, is attributed to structural defects, edges, as well as oxidation of the graphite surface.33,34 The latter peak (G band peak), is sharp and intense. This signal is associated with the radial C–C stretching mode of sp2 bonded carbon.34,35 The Raman spectrum of GO (Fig. 4b) shows a significant increase in intensity of the D band peak, with a maximum around 1344 cm−1, whereas the G band peak becomes flattened. The formation of GO also results in a peak shift. For GO, the D band peak is positioned at 1344 cm−1, whereas the G band peak is at 1589 cm−1. The ID/IG ratio (ID – intensity of D band peak, IG – intensity of G band peak) provides information on the defect density of the graphitic structure.32 It can observed that as a consequence of the transformation of graphite into GO, the ID/IG ratio significantly increases from 0.07 to 0.75, indicating a significant worsening of the structural order. Simultaneously, due to the oxidation of graphite in HClO4, oxygen functionalities are intensively formed, causing a decrease in the concentration of sp2-hybridized C–C bonds.20,34,36,37 After the thermal treatment of GO, yielding TRGO, the ID/IG ratio decreases to 0.59 (Fig. 4c). The intensity of the D band peak for the TRGO sample is lower in comparison with GO (Fig. 4b). On the other hand, the G band peak is slightly sharper than that for GO and is shifted to 1569 cm−1. Such behaviour can be likely elucidated in terms of the decomposition of the oxygen groups chemically bounded to graphene layers, as well as the recovery of the sp2-hybridized C–C bonds in the synthesized TRGO.38,39
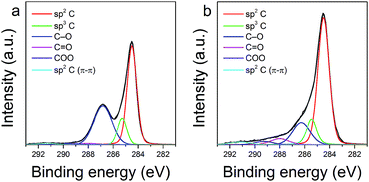
The changes in chemical composition of the GO surface resulting from the thermal exfoliation–reduction process were examined by XPS analysis. Fig. 5 shows the deconvoluted XPS spectra of the C1s region recorded for GO and TRGO, respectively. Information on the total content of oxygen and carbon, the positions of the deconvoluted C1s peak, as well as the concentration of oxygen containing functional groups, is presented in Table 1. As expected, the thermal treatment of GO significantly decreases the total oxygen content. According to the literature data,40,41 the decomposition of epoxy and alkoxy groups, illustrated by the decrease in intensity of the peak at 286.5 eV, is responsible for the aforementioned decrement. On the other hand, it should be emphasized, that the thermal treatment of GO performed at 500 °C in an air atmosphere increased the concentration of some oxygen groups (carbonyl at 288.0 eV and carboxyl at 289.3 eV).40–43 Another result of the thermal exfoliation–reduction is associated with the significant increase in the contribution of sp2 C (from 48.74 to 61.83%). This effect is likely related with the decomposition of oxygen functionalities (alkoxy and epoxy groups), with the simultaneous recovery of sp2 hybridized carbon species. The XPS results are in agreement with the data presented in the Raman analysis.
| GO | TRGO | |
|---|---|---|
| At% | ||
| C | 90.75% | 95.14% |
| O | 9.25% | 4.86% |
| Surface groups | Peak (eV) | Content (%) | Peak (eV) | Content (%) |
|---|---|---|---|---|
| sp2 C (π–π) | 291.2 | 1.50 | 291.1 | 2.27 |
| COO | 289.3 | 1.33 | 289.3 | 2.50 |
C![[double bond, length as m-dash]](https://www.rsc.org/images/entities/char_e001.gif) O O |
288.0 | 1.85 | 288.0 | 5.16 |
| C–O | 286.8 | 34.20 | 286.4 | 16.20 |
| sp3 C | 285.3 | 12.38 | 285.4 | 12.05 |
| sp2 C | 284.5 | 48.74 | 284.5 | 61.82 |
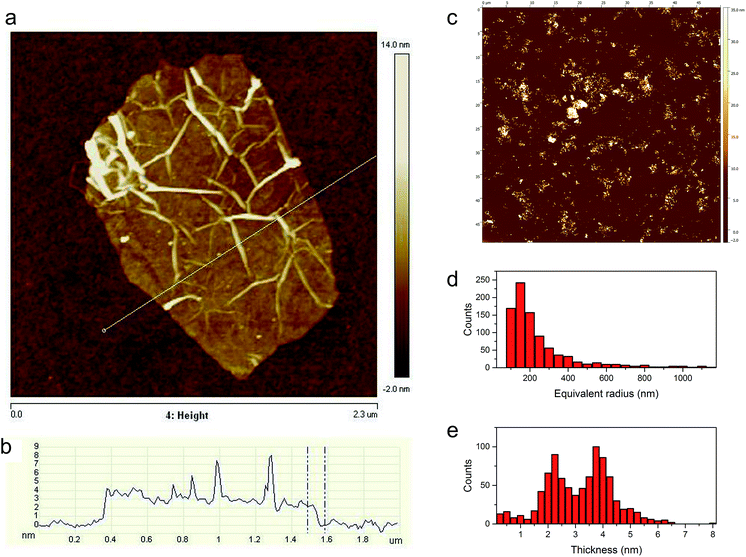
Additional information on the structural properties of the synthesized TRGO, especially its topography, is provided by atomic force microscopy (AFM) analysis. The preparation of the TRGO sample for AFM investigations included the formation of a TRGO/dimethylformamide (DMF) mixture which underwent sonication followed by centrifugation. AFM observations of TRGO were performed with the use of a silicon substrate. The AFM image of a single graphene sheet with a lateral size of a few μm and its height profile are presented in Fig. 6. As can be seen from Fig. 6a, due to the thermal shock treatment of the GO, the obtained TRGO material has a wrinkled and creased structure. The height profile (Fig. 6b) shows that the graphene sheet is unevenly distributed on the silicon substrate. The height of the TRGO sheet, measured at the lowest point (see Fig. 6b), is equal to 2.2 nm, which corresponds to multi-layer graphene (6–7 layers).44 To acquire additional information on the quality of the TRGO sample, as well as on its size distribution, a statistical analysis of almost 900 graphene sheets was performed (see Fig. 6c–e). As can be seen in Fig. 6d, most of the prepared graphene flakes have an equivalent radius of around 150 nm. On the other hand, flakes of a higher radius are also observed. The thickness of graphene sheets ranged from 1 to 5 nm. Only a small amount of graphene layers are thicker than 5 nm (Fig. 6e).
4. Conclusions
Our investigations undoubtedly reveal that bulk quantities of graphene material can be synthesized by the thermal exfoliation–reduction of GO prepared by the electrochemical oxidation of graphite in 8 M HClO4. The disappearance of the crystalline structure due to the thermal treatment of GO was confirmed by the XRD and Raman spectroscopy measurements. The results of the XPS analysis indicate the partial reduction of GO, caused by the decomposition of epoxy and alkoxy groups. On the other hand, the air atmosphere used during the thermal treatment of GO impacts on its partial oxidation resulting in a slight increment in the concentration of carbonyl and carboxyl groups. The thermal decomposition of oxygen functionalities followed by abrupt release of gaseous products from the GO structure resulted in an enormous increase in the volume of TRGO formed, yielding the exfoliation. The graphene layers within the obtained graphene material are wrinkled and creased with numbers of structural defects. The results of AFM analysis confirmed that to obtain multi-layer graphene, the additional treatment of TRGO with ultrasonication in DMF is necessary.Acknowledgements
The authors thank Dr Barbara Peplińska of NanoBioMedical Centre, Adam Mickiewicz University for measurements and helpful discussion regarding SEM. The research was supported by National Centre for Research and Development under the research grant “Nanomaterials and their application to biomedicine”, contract number PBS1/A9/13/2012. Mateusz Kempiński and Maciej Wiesner thank the National Center of Science for financial support, Grants No. DEC-2013/09/B/ST4/03711 and DEC-2014/15/B/ST3/02927.Notes and references
- S. Stankovich, D. A. Dikin, G. H. B. Dommett, K. M. Kohlhaas, E. J. Zimney, E. A. Stach, R. D. Piner, S. T. Nguyen and R. S. Ruoff, Nature, 2006, 442, 282 CrossRef CAS PubMed.
- M. Yi and Z. Shen, J. Mater. Chem. A, 2015, 3, 11700 CAS.
- Y. Zhu, S. Murali, W. Cai, X. Li, J. W. Suk, J. R. Potts and R. S. Ruoff, Adv. Mater., 2010, 22, 1 CrossRef.
- Z. Li, M. He, D. Xu and Z. Liu, J. Photochem. Photobiol., C, 2014, 18, 1 CrossRef CAS.
- C. K. Chua and M. Pumera, Chem. Soc. Rev., 2014, 43, 291 RSC.
- S. Gadipelli and Z. X. Guo, Prog. Mater. Sci., 2015, 69, 1 CrossRef CAS.
- A. Bianco, H. M. Chen, T. Enoki, Y. Gogotsi and R. H. Hurt, Carbon, 2013, 65, 1 CrossRef CAS.
- W. Fu, J. Kiggans, S. H. Overbury, V. Schwartz and C. Liang, Chem. Commun., 2011, 74, 5265 RSC.
- S. R. Dhakate, N. Chauhan, S. Sharma, J. Tawale, S. Singh, P. D. Sahare and R. B. Mathur, Carbon, 2011, 49, 1946 CrossRef CAS.
- P. Krawczyk and B. Gurzęda, J. Solid State Electrochem., 2016, 20, 361 CrossRef CAS.
- C. T. J. Low, F. C. Walsh, M. H. Chakrabarti, M. A. Hashim and M. A. Hussain, Carbon, 2013, 54, 1 CrossRef CAS.
- T. D. Dao and H. M. Jeong, Mater. Res. Bull., 2015, 70, 651 CrossRef CAS.
- C. Botas, P. Álvarez, C. Blanco, R. Santamaría, M. Granda, M. D. Gutiérrez, F. Rodríguez-Reinoso and R. Menéndez, Carbon, 2013, 52, 476 CrossRef CAS.
- H. Xian, T. Peng, H. Sun and J. Wang, Nano-Micro Lett., 2015, 7, 17 CrossRef CAS.
- A. Reina, X. Jia, J. Ho, D. Nezich, H. Son, V. Bulovic, M. S. Dresselhaus and J. Kong, Nano Lett., 2008, 9, 30 CrossRef PubMed.
- D. V. Kosynkin, A. L. Higginbotham, A. Sinitskii, J. R. Lomeda, A. Dimiev, B. K. Price and J. M. Tour, Nature, 2009, 458, 872 CrossRef CAS PubMed.
- P. Avouris and C. Dimitrakopoulos, Mater. Today, 2012, 15, 86 CrossRef CAS.
- V. Georgakilas, M. Otyepka, A. B. Bourlinos, V. Chandra, N. Kim, K. C. Kemp, P. Hobza, R. Zboril and K. S. Kim, Chem. Rev., 2012, 112, 6156 CrossRef CAS PubMed.
- X. Gao, J. Jang and S. Nagase, J. Phys. Chem. C, 2010, 114, 832 CAS.
- D. Zhan, Z. Ni, W. Chen, L. Sun, Z. Luo, L. Lai, T. Yu, A. T. S. Wee and Z. Shen, Carbon, 2011, 49, 1362 CrossRef CAS.
- H. C. Schniepp, J. L. Li, M. J. McAllister, H. Sai, M. Herrera-Alonso, D. H. Adamson, R. K. Prud’homme, R. Car, D. A. Saville and I. A. Aksay, J. Phys. Chem. B, 2006, 110, 8535 CrossRef CAS PubMed.
- S. R. C. Vivekchand, C. S. Rout, K. S. Subrahmanyam, A. Govindaraj and C. N. R. Rao, J. Chem. Sci., 2008, 120, 9 CrossRef CAS.
- O. Akhavan, Carbon, 2010, 48, 509 CrossRef CAS.
- M. J. McAllister, J. L. Li, D. H. Adamson, H. C. Schniepp, A. A. Abdala, J. Liu, M. Herrera-Alonso, D. L. Milius, R. Car, R. K. Prud’homme and I. A. Aksay, Chem. Mater., 2007, 19, 4396 CrossRef CAS.
- B. Zhao, P. Liu, Y. Jiang, D. Pan, H. Tao, H. Song, T. Fang and W. Xu, J. Power Sources, 2012, 198, 423 CrossRef CAS.
- H. Hu, Z. Zhao, Q. Zhou, Y. Gogotsi and J. Qiu, Carbon, 2012, 50, 3267 CrossRef CAS.
- Y. M. Shulga, S. A. Baskakov, E. I. Knerelman, G. I. Davidova, E. R. Badamshina and N. Y. Shulga, RSC Adv., 2014, 4, 587 RSC.
- B. Gurzęda, P. Florczak, M. Kempiński, B. Peplińska, P. Krawczyk and S. Jurga, Carbon, 2016, 100, 540 CrossRef.
- D. Nečas and P. Klapetek, Cent. Eur. J. Phys., 2012, 10, 181 Search PubMed.
- C. Y. Ho and H. W. Wang, Appl. Surf. Sci., 2015, 357, 147 CrossRef CAS.
- C. M. Chen, Q. Zhang, M. G. Yang, C. H. Huang, Y. G. Yang and M. Z. Wang, Carbon, 2012, 50, 3572 CrossRef CAS.
- M. A. Pimenta, G. Dresselhaus, M. S. Dresselhaus, L. G. Cançado, A. Jorio and R. Saito, Phys. Chem. Chem. Phys., 2007, 9, 1276 RSC.
- Y. Wang, D. C. Alsmeyer and R. L. McCreery, Chem. Mater., 1990, 2, 557 CrossRef CAS.
- K. N. Kudin, B. Ozbas, H. C. Schniepp, R. K. Prud’homme, I. A. Aksay and R. Car, Nano Lett., 2008, 8, 36 CrossRef CAS PubMed.
- A. Kaniyoor, T. T. Baby and S. Ramaprabhu, J. Mater. Chem., 2010, 20, 8467 RSC.
- J. Cui, Y. Lai, W. Wang, H. Li, X. Ma and J. Zhan, Carbon, 2014, 66, 738 CrossRef CAS.
- Y. Hu, S. Song and A. Lopez-Valdivieso, J. Colloid Interface Sci., 2015, 450, 68 CrossRef CAS PubMed.
- Z. González, C. Botas, P. Álvarez, S. Roldán, S. Blanco, R. Santamaría, M. Granda and R. Menéndez, Carbon, 2012, 50, 828 CrossRef.
- S. Stankovich, D. A. Dikin, R. D. Piner, K. A. Kohlhaas, A. Kleinhammes, Y. Jia, Y. Wu, S. T. Nguyen and R. S. Ruoff, Carbon, 2007, 45, 1558 CrossRef CAS.
- Z. J. Fan, W. Kai, J. Yan, T. Wei, L. J. Zhi, J. Feng, Y. Ren, L. P. Song and F. Wei, ACS Nano, 2011, 5, 191 CrossRef CAS PubMed.
- E. Paparazzo, Carbon, 2013, 63, 578 CrossRef CAS.
- Y. Matsumoto, H. Tateishi, M. Koinuma, Y. Kamei, C. Ogata, K. Gezuhara, K. Hatakeyama, S. Hayami, T. Taniguchi and A. Funatsu, J. Electroanal. Chem., 2013, 704, 233 CrossRef CAS.
- S. Biniak, G. Szymański, J. Siedlewski and A. Świątkowski, Carbon, 1997, 35, 1799 CrossRef CAS.
- P. Nemes-Incze, Z. Osváth, K. Kamarás and L. P. Biró, Carbon, 2008, 46, 1435 CrossRef CAS.
| This journal is © The Royal Society of Chemistry 2016 |

