Controlling the excitation of radially polarized conical plasmons in plasmonic tips in liquids

Bayarjargal N. Tugchin*a, Norik Januntsa, Michael Steinerta, Kay Dietricha, Dmitry Sivun a, Siddharth Ramachandranb, Khachatur V. Nerkararyanc, Andreas Tünnermannad and Thomas Pertscha
aInstitute of Applied Physics, Abbe Center of Photonics, Friedrich-Schiller-Universität Jena, 07743 Jena, Germany. E-mail: n.bayarjargal@zoho.com
bDepartment of Electrical and Computer Engineering and Photonics Center, Boston University, Boston, MA 02215, USA
cDepartment of Radiophysics, Yerevan State University, 1 Alek Manoogian, Yerevan 375049, Armenia
dFraunhofer Institute for Applied Optics and Precision Engineering, 07745 Jena, Germany

Received 11th April 2016 , Accepted 23rd May 2016

First published on 25th May 2016


Abstract

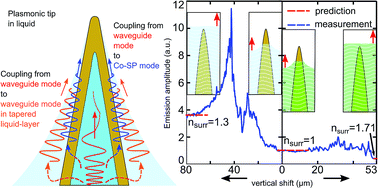
Having virtues from plasmons and scanning probe microscopy (SPM), plasmonic tips employ radially polarized conical plasmons and create hot-spots at their apexes. Plasmonic tips are tapered and fully metal-coated vortex fibers that have M-shaped refractive index profiles. Vortex fibers allow the radially polarized mode to propagate over a long distance with high modal purity. When the fiber mode reaches the tapered region, it resonantly excites the plasmon mode at a metal-dielectric outer interface. In this paper, we study the plasmonic tip's behavior in liquids both theoretically and experimentally. By adiabatically tapering the vortex fiber, the radially polarized mode gets confined from the fiber with a diameter of 115 μm down to the tapered part with a diameter of 1.42 μm as a waveguide mode. In this region, the plasmon mode gets excited thus reaches the apex with a diameter of 200 nm. Our calculations show that the plasmon coupling efficiency increases in liquids due to two competing processes: a significant increase of the interaction region and slight decrease of the penetration depth of fields in metal. By choosing a liquid that either allows or forbids the phase-matching, we demonstrate that the plasmon coupling efficiency can increase or vanish. Due to the wetting effect, a tapered liquid-layer forms over the tip like an additional waveguide and allows resonant coupling of fiber modes to the liquid layer.

Introduction

Vital applications in plasmonics and nanooptics concern sensing and manipulation of particles or molecules microscopically and macroscopically.1–6 By changing the geometry and materials of the structure that supports the light or the plasmon polaritons, we can tailor the characteristics and behavior of devices such as sensors or tweezers.7–10 For sensors, we often employ surface plasmon polaritons (SPPs) because of their highly sensitive resonance condition to the change of the surrounding medium.11 The most basic SPP based sensor is a Kretschmann type,12 also known as a surface plasmon resonance (SPR) sensor.1,2 The Kretschmann configuration allows spectral tuning without structural change13 and macroscopic manipulation and organization of particles in two dimensional space when used for large-scale tweezing and trapping applications.5 Structured surfaces implemented in Kretschmann configuration are shown to have better macroscopic sensitivity than unstructured ones.14 To study individual molecules or particles microscopically, localized SPPs excited on metal nanoparticles are often employed.8,9 Structures with sharp edges are also used where a bias voltage assists to trap and study molecules individually.15–17 Furthermore, the plasmonic focusing effect created by metallic nano-structures18,19 can also be used in local sensing. Both propagating planar SPPs and localized SPPs have been successfully used in trapping applications, yet mobility and manipulation are restricted to one or two dimensional space. To overcome these problems, probes from scanning near-field optical microscopy (SNOM) are used3,4,20–23 demonstrating the versatility of the device for selective sensing, trapping, tweezing, and manipulation. Though a dielectric fiber tip has a weak field localization at its apex, it was successfully used in trapping and transporting sub-micron particles (silica, cells, and bacteria) in a water environment.4 Circular aperture SNOM tips have been employed in trapping particles with different degrees of trapping strengths, defined by the distance between the tip and the substrate and the salt concentration in water.20 Aperture tips have been also used in studying molecular dynamics at the liquid–liquid interface by recording the Raman signal.21 A bow-tie aperture that is fabricated at the apex of a tip has improved the total light throughput by 3 orders of magnitude.22 In contrast, the conventional circular aperture tip has a light throughput of about 0.01% for 100 nm aperture size.24 Nevertheless, both are still weak compared to plasmonic tips that have a power conversion efficiency (from the fiber to the apex) of about 76% for a gold coating of 50 nm.25 Thus, by employing plasmonic tips, we can improve the performance of SNOM tips in sensing and trapping applications. Plasmonic tips are tapered and fully metal-coated vortex fibers.25–27 The vortex fiber (also called ring-core fiber, M-profile fiber, or orbital angular momentum (OAM) fiber)28 has an M-shaped refractive index profile and guides the radially polarized mode over a long distance with high modal purity. The plasmonic tip can be understood as a rotationally symmetric Kretschmann configuration in conical geometry. Instead of angle tuning for resonance, the decreasing radius of the cone enables the resonant coupling between the radially polarized plasmon and waveguide (WG) modes.29–31 This resonant coupling process is highly sensitive to the surrounding medium change and occurs in wide frequency range at different positions of the tip with different efficiencies. Thus, the plasmonic tip can function as an SPR sensor.32 When the resonantly excited and radially polarized plasmon mode propagates toward the apex, its field intensity increases while its phase velocity decreases. At the apex, the field gets localized. This phenomenon is known as a superfocusing of plasmons,33–35 and it can occur in a broad spectral range. The localized spot at the apex of a plasmonic tip can be used as a spectrally tunable and mobile nanoscale tweezer, detector, and excitation source. Consequently, plasmonic tips bring advantages not only of SPPs that are high sensitivity and field localization but also of SNOM tips that are mobility and selectivity.

In this paper, we study both theoretically and experimentally the plasmonic tip's behavior in liquids for future applications as a single probe tweezer and sensor. First, we calculate the plasmon coupling efficiency in plasmonic tips when the metallic layer is covered by liquid. We also investigate the gradual confinement process of the radially polarized mode from the fiber to the plasmonic tip apex. Furthermore, the plasmonic tip emission is probed in different liquids to demonstrate the dependence of the coupling efficiency on the parameters of the surrounding media such as wetting, refractive index etc.

Results and discussion

Analytical description

To have a guideline for our later experimental study, we want to study analytically the resonant coupling of SPPs and its dependence on the surrounding medium. The resonant coupling process in plasmonic tips are illustrated as an inset in Fig. 1a. We use Landau–Zener equation and calculate the coupling efficiency (ACo-SP) between WG and Co-SPP modes as follows29
 
image file: c6ra09341h-t1.tif(1)
Here, δ is the coupling constant that is described by the overlap integral of the individual mode's field profile. Moreover, image file: c6ra09341h-t2.tif describes the propagation constant (β) difference (between WG and Co-SP modes) rate per unit length of z where z0 is the resonant coupling point (βCo-SPβwg = 0). The smaller the ν parameter is, the longer the interaction length is for the WG and Co-SP modes. Thus, formula (1) calculates the coupling efficiency based on the overlap of fields as well as the interaction (phase matching) between WG and Co-SP modes for the given surrounding medium. The propagation constants of WG and Co-SP modes are described in ESI S1. Further details for formula (1) can be found in ref. 29.

image file: c6ra09341h-f1.tif
Fig. 1 (a) Enhancement of the SPP coupling efficiency for the plasmonic tip (solid line) and the planar Kretschmann (dotted line) configuration depending on the refractive index of the surrounding medium. The curves are individually normalized to their values in air. The inset illustrates the plasmon excitation process in plasmonic tips where the waveguide (WG) and the conical surface plasmon (Co-SP) modes are illustrated in red and blue colors, respectively (for details see ref. 25). (b) Normalized transversal magnetic field, Re[Hφ(ρ)]/Re[Hφ(b)], of TM0 Co-SP mode in the plasmonic tip. The dashed and solid lines correspond to the refractive indices of the surrounding media with nsurr = 1 and nsurr = 1.3, respectively. The dotted line indicates the 1/e value or the penetration depth of fields in both media. The fields are calculated at a tip radius of b = 700 nm for nsurr = 1 and nsurr = 1.3. (c) Calculated real part of the effective indices (β′′Co-SP/k0) of the waveguide (TM01, black) and Co-SP (TM0) modes. Surrounding media's refractive indices are nsurr = 1 (air, magenta), nsurr = 1.3 (green), and nsurr = 1.71 (orange). Insets 1 and 2 show the close-ups of the phase matching regions where the horizontal and vertical dimensions of rectangles are 0.1 μm and 0.1, respectively. (d) Enhancement of the power conversion efficiency from the tapered fiber in the coupling region to the apex of the plasmonic tip versus the refractive index of the surrounding medium. To show the enhancement of the conversion efficiency, the curve is normalized to unity in air. The conversion efficiency takes into account both the coupling efficiency and the propagation loss toward the apex. Parameters used for calculation are: the free space wavelength of λ0 = 784 nm; the gold coating thickness of 100 nm; the full cone angle of 20°; and refractive indices of nprism,wg = 1.4474 and ngold2 = −20.95 + 1.68i.38

Fig. 1a shows the calculated plasmon coupling enhancement versus the surrounding medium's refractive index, nsurr. Here, we plot the coupling efficiency curves not only for plasmonic tips (solid line) but also for planar Kretschmann configurations (dotted line). For the ease of comparison, the coupling efficiency curves are individually normalized to one when the surrounding media is air. As the figure shows, the coupling efficiency of plasmonic tips increases 5.55 times in a liquid with nsurr = 1.3 compared to air. Meanwhile, the planar Kretschmann configurations exhibit at most 1.21 times of increase for the same case. As described in ESI S1, plasmonic tips are essentially Kretschmann configurations in conical geometry thus more efficient than the planar counterpart. The increase of coupling efficiency have been experimentally demonstrated in planar Kretschmann configurations.36,37 Details of calculations on planar Kretschmann configurations are in ESI S2. In the calculation, we use the following parameters: a gold coating of 100 nm, a prism and WG refractive index (nprism and nwg) of 1.4474, a laser wavelength (λ0) of 784 nm, and a gold refractive index of ngold2 = −20.95 + 1.68i.38 The coupling efficiency increases with the decreasing coating thickness; for instance, it is about 0.7% for a 100 nm of gold coating as compared with 97% for a 50 nm of gold coating (see Fig. S2a ​in ESI). However, in the latter case, the enhancement of coupling efficiency is low since there isn't much room to increase it further (see Fig. S2b ​in ESI). Thus, to operate with a high dynamic range away from the saturation region, we use tips with 100 nm of gold coating.

Since the coupling efficiency of the plasmonic tip is determined by the field overlap integral (parameter δ) and the phase matching condition (parameter ν), we study each of these characteristics. First, we look at the penetration depth of fields in the metal that defines the field overlap integral. For the fundamental radially polarized Co-SP mode (TM0 mode with Hφ, Eρ, and Ez),39 the transversal magnetic field (Hφ) is given in polar coordinates with ρ and z as

 
image file: c6ra09341h-t3.tif(2)
Here, B0 is the normalization constant, ω is the angular frequency of light, b is the radius of the tip including the metal cladding, and ε0 is the free space permittivity. The propagation constant of βCo-SP and the transversal wavevectors of χ3 and χ2 are described in eqn (S2) in ESI. Meanwhile, the normalization constant can be found by making the total power to unity.

The real part of the magnetic field is calculated at a tip radius of b = 700 nm and normalized by the field amplitude at b that is Re[Hφ(ρ)]/Re[Hφ(b)]. Fig. 1b shows the normalized magnetic field profile along ρ axis when the surrounding media's refractive index is nsurr = 1 (dashed line) and nsurr = 1.3 (solid line). The dotted line in the figure indicates the penetration depth of the magnetic field that is 1/e of the maximum field amplitude. The penetration depth has reduced by about 2.6 nm in the metal and about 84 nm in the surrounding medium when the surrounding media changes from nsurr = 1 to nsurr = 1.3. Thus, the field overlap integral (parameter δ) is reduced only slightly decreasing the overall coupling efficiency. The results also show that the field gets further confined at the metal-surrounding medium interface in liquids.

Next, we study the relation between phase matching condition and refractive index of the surrounding medium to understand its effect on the coupling efficiency. We calculate the effective indices (β/k0) of WG and Co-SP modes for different refractive indices of the surrounding media by using eqn (S1) and (S2) in ESI. The real parts of the effective indices (βCo-SP/k0) are plotted in Fig. 1c since they mostly define the phase matching condition. In the figure, dispersion curves of the Co-SP mode are presented for surrounding medium with refractive indices of nsurr = 1 (magenta curve), nsurr = 1.3 (green curve), and nsurr = 1.71 (orange curve). The real (βCo-SP/k0) and imaginary (β′′Co-SP/k0) parts of the propagation constant increase as the refractive index of the surrounding media increases. This means that the Co-SP mode gets slower and lossier in liquids than in air (see Fig. S3 in ESI). Furthermore, the coupling region, where the phase matching occurs, moves toward the region with a larger tip radius with the increasing refractive index of the surrounding media. Insets in Fig. 1c show close-ups of the coupling regions where the horizontal and the vertical dimensions are 0.1 μm and 0.1, respectively. Insets illustrate that the effective indices of the WG and Co-SP modes change with a slower rate around the coupling region in liquids than in air. Thus, in liquids, the Co-SP and WG modes have a long region where their phase velocity difference (parameter ν) is small. This means that the coupling (phase matched) region is longer in a liquid with nsurr = 1.3 (inset 2) than in air with nsurr = 1 (inset 1). The longer interaction region (small ν parameter) improves the coupling efficiency.

Hence, in liquids, the penetration depth shortens slightly while the interaction length gets longer (than air), and both result in decreasing of parameters δ and ν. Since the second effect (decrease of ν) dominates among the two, the ratio δ2/ν increases. Therefore, the overall coupling efficiency given by formula (1) increases in liquids. Note that the coupling region is not long enough for the back-coupling (from Co-SP to WG mode) to occur. Furthermore, when the refractive index gets too high such as nsurr > 1.37 for nwg = 1.4474, the dispersion curves do not cross as shown in Fig. 1c. This implies that TM01 WG mode can't excite TM0 Co-SP mode in such media. We can observe these two effects (Fig. 1b and c) also in the planar Kretschmann configuration, yet the effects are not as pronounced as in the plasmonic tip. Correspondingly, the coupling efficiency only increases about 1.21 times in the planar Kretschmann configuration compared with 5.55 times in the plasmonic tips (Fig. 1a).

Unlike the planar SPPs that are often used for spectrally tunable sensing or organizing nanoparticles macroscopically,5,7,13 the plasmonic tip is advantageous in sensing and tweezing individually molecules or particles by the field localized at its tip apex. Thus, to know the total power conversion efficiency from the fiber to the tip apex, we include the Co-SP propagation loss (from the coupling point to the apex) in formula (1). With the imaginary part of the propagation constant β′′Co-SP, the power conversion from the tapered fiber to the tip apex can be approximated as

 
image file: c6ra09341h-t4.tif(3)
Here, β′′Co-SP(z, nsurr) is calculated with eqn (S2) in ESI, and z = b/tan(α) is found with the half cone angle of α and the tip radius of b. In the calculations, we used a half cone angle of α = 10°. For a plasmonic tip with a gold coating thickness of 100 nm, the conversion efficiency is 0.525% in air and 1.528% in a liquid with nsurr = 1.3. Fig. 1d shows the normalized conversion efficiency from the tapered fiber in the coupling region to the tip apex. The curve is normalized so that the conversion efficiency is 1 in air. With formula (3) and Fig. 1d, we can conclude that the conversion efficiency can improve 2.91 times in liquids with nsurr = 1.3 as compared with air. The result demonstrates that we still manage to deliver more power to the apex, although both the loss (β′′Co-SP) and the distance from the coupling region to the apex increase in liquids. However, due to these two loss processes, the total propagation loss starts to get stronger when the refractive index of the surrounding media gets higher than 1.32. Thus, the conversion efficiency begins to decrease.

Adiabatic confinement of the radially polarized modes in air

Our theoretical study suggests that the conversion efficiency of plasmonic tips can be improved significantly in liquid environments. Before experimentally demonstrating this effect, it is essential to ensure the radially polarized mode is preserved during the propagation in the tapered vortex fiber. Plasmonic tips are made of an vortex fiber26–28 that has an M-shaped refractive index profile and guides the radially polarized fiber mode securely over a long distance. Fig. 2a shows the facet of the vortex fiber where two concentric ring cores are visible. For the fiber with a cladding diameter of 115 μm, the inner and outer ring cores have outer diameters of 3.5 μm and 9 μm, respectively. The intensity profile images of the fiber mode are presented in Fig. 2b. Since we operate at the wavelength of 784 nm not the fiber's designated wavelength, the vortex fiber can guide both TM01 and TM02 modes. As shown in Fig. 2b, the light guiding through the inner core demonstrates that we have a slight contribution of TM02 mode. We use a thin film polarisation analyzer (hereafter called an analyzer) and a camera to confirm the radially polarized doughnut mode. When the mode is transmitted through the analyzer and imaged on the camera, we shall be able to see two lobes that are oriented along the transmission axis of the analyzer. In Fig. 2b, the polarization resolved images of the fiber mode are presented where the yellow arrows indicate the analyzer's transmission axis. Since the lobes are oriented along the analyzer's transmission axis in all four cases showing, the fiber mode is indeed radially polarized. To safely couple the radially polarized mode into plasmonic tips, we, first, couple a radially polarized beam into a separate piece of intermediate vortex fiber and observe the fiber mode. After ensuring the fiber mode is radially polarized, we splice this fiber with a free fiber end of the plasmonic tip. The fabrication process of plasmonic tips is explained in Methods.
image file: c6ra09341h-f2.tif
Fig. 2 (a) Vortex fiber core where the outer ring core diameter is 9 μm. (b) Radially polarized mode within the vortex fiber at a wavelength of 784 nm. The total and polarization resolved intensity images are shown where the transmission axes of the polarization analyzer are denoted with yellow arrows. (c) Plasmonic tip apex emission to the front. The total and polarization resolved intensity images are presented when a radially polarized mode was coupled into the tip fiber-end. (d) Plasmonic tip emission to the side overlapped with a scanning electron microscope image (SEM) of the tip. The tip apex with a size of about 200 nm emits brightly. (e) SEM image of the cross-sectioned tip with an aperture diameter of 3 μm. In the middle of the aperture that is enlarged in the inset, one can see the well preserved ring core of the vortex fiber that has shrunk from 9 μm to 200 nm. (f) SEM image of the cross-sectioned tip with an aperture diameter of 1.42 μm. The cutoff of the radially polarized WG mode (TM01) occurs below this radius. (g) Polarization resolved mode intensity images of the cross-sectioned tip in (e) where the aperture is denoted with the white dashed circles. (h) Polarization resolved mode intensity images of the cross-sectioned tip in (g) where the aperture is denoted with the white dashed circles. Measurements in c, d, f, and h are done with the same tip.

Now, we characterize the plasmonic tip's emission in air by imaging the tip with an objective from side and from front while placing the tip at the focal plane of the objective in each cases. In Fig. 2c, we present the total and the polarization resolved images of the tip emission to the front, where the yellow arrows denote the analyzer's transmission axis. When the radially polarized Co-SP mode reaches the apex, the mode is partially scattered to the front that we can observe in the far-field. The total intensity image of the front emission has a doughnut shape and is radially polarized that is proven by the orientation of the two lobes along the analyzer's transmission axis. The measurement, thus, indicates that the resonantly excited plasmons are radially polarized as well.

Next, we observe the tip emission to the side. The image of the tip emission to the side is presented in Fig. 2d where the tip's scanning electron microscope (SEM) image is also underlaid. In this figure, we can see an emission from the apex of the tip. This characteristic apex emission to the side is polarized along the tip axis (see S5 section in ESI of ref. 25). It is expected that with the increasing sharpness of the tip, the side emission increases and the front emission decreases.40

After imaging the tip emission to the front (Fig. 2c) and to the side (Fig. 2d), we study the guided mode in the tapered region of the plasmonic tip. With a focused ion beam (FIB), we cross-section two similar tips at a diameter of 3 μm and 1.42 μm. The SEM images of the cross-sectioned tips are shown in Fig. 2e (3 μm) and 2f (1.42 μm). They were taken under an angle of 36° with respect to the fiber axis and are tilt-corrected to preserve the circular shape. Fig. 2g (3 μm) and 2 h (1.42 μm) show the polarization resolved images of the guided mode within the cross-sectioned tips where the yellow arrows indicate the analyzer's transmission axis. Fig. 2g and h demonstrate that two lobes are oriented along the analyzer's transmission axis. Thus, we conclude that the incoupled radially polarized mode is safely delivered from the vortex fiber with a cladding diameter of 115 μm to the tapered region with the diameter of 1.42 μm. In Fig. 2g, there are faint outer ring patterns besides the strong main lobes in the center. These illustrate that the guided light at the diameter of 3 μm is a mixture of both TM01 and TM02 modes. Since the vortex fiber is designed for a wavelength that is twice of our laser wavelength of 784 nm, both modes in the taper are inherited from the fiber. Although the large core diameter of our fiber (9 μm) supports higher order modes, there is an advantage to have a large core. When tapered, the core structure remains effective in guiding the modes at a distance that is closer to the apex than that of a fiber with a small core diameter. Thus, the large core essentially helps to deliver safely the radially polarized mode to the resonant coupling region at the expense of higher order modes. Furthermore, if we observe carefully the core structure of the cross-sectioned tip in Fig. 2e (image contrast enhanced), we could see a faint ring core in the middle. This can be clearly seen in the inset that enlarges the dashed rectangle area in the figure and also in Fig. S4 in ESI. The ring core is fairly conserved and shrank down to a diameter of ≈200 nm. Since the cladding to core ratios are 12.8 in the fiber (115 μm to 9 μm) and 13.4 in the tapered fiber (≈2.68 μm to ≈0.2 μm), this tapering process is shown to be adiabatic and conserves the core structure well. Since TM02 mode experiences cutoff at a diameter of about 2.1 μm (it turns into a leaky mode), we only see TM01 mode that has two lobes without extra ring in Fig. 2h. Meanwhile, TM01 mode cutoff occurs at a diameter of about 1.41 μm. Measurement results in Fig. 2c, d, f and h are obtained from the same tip.

Plasmonic tip's emission in liquids

So far, we have demonstrated that the radially polarized WG mode reaches safely to the coupling region and resonantly excites the Co-SP mode at the metal-surrounding medium outer interface. Now, we would like to study experimentally how the surrounding medium affects the coupling efficiency of the Co-SP mode and the conversion efficiency. Although the conversion efficiency, from the fiber to the tip apex, improves with the increasing refractive index of the surrounding media (see Fig. 1d), there is a limit for this effect. According to our analytical study, the phase matching condition is no longer met when nsurr > 1.37, and the propagation loss starts to dominate when nsurr > 1.32. We study experimentally the far-field emission characteristics of the plasmonic tip in liquids with nsurr = 1.3 and nsurr = 1.71 when a radially polarized mode is coupled to the plasmonic tip. In a medium with nsurr = 1.3, the calculated conversion efficiency increases about 2.91 times (Fig. 1d); thus, we expect that the tip emission to the far-field will also increase. In contrast, when the surrounding media is a liquid with nsurr = 1.71, the calculated dispersion curves in Fig. 1c do not cross. This means that TM01 WG mode (black curve) can't excite TM0 Co-SP (orange curve) mode in this medium. Thus, the emission induced by Co-SP mode should completely vanish when the tip is in this liquid.

Fig. 3a depicts the experimental setup for recording the tip's far-field emission in liquids. Details of the setup is described in Methods. In the first measurement presented in Fig. 3b, we probe the tip emission when the liquid with refractive index of nsurr = 1.3 moves up and covers the tip completely. The horizontal axis shows the relative position of the liquid surface in micrometers where the black arrow indicates the motion direction. The leftmost side (z = 80 μm) corresponds to the position when the tip is fully submersed in the liquid while the rightmost side (z = 0 μm) is when the tip is in air. The insets illustrate the relative position of the tip and the liquid surface at the corresponding regions of the horizontal axes where the red arrows point the direction of liquid's motion.


image file: c6ra09341h-f3.tif
Fig. 3 (a) Experimental setup for measuring the tip emission in liquids. (b) Measured tip emission during the transition from air to a liquid with nsurr = 1.3 where the transition direction is indicated with a black arrow on the bottom. (c) Measured tip emission during the transition from air to a liquid with nsurr = 1.71 where the transition direction is indicated with a black arrow on the bottom. The recorded emission value in (b) and (c) are normalized so that the tip emission in air is 1. The dashed red lines indicate theoretically predicted values from Fig. 1c and d. The Co-SP mode excitation is shown to be enhanced in the liquid with nsurr = 1.3 and suppressed in the liquid with nsurr = 1.71. The insets in (b) and (c) show the relative positions of the tip and the liquid surfaces, and red arrows in the inset indicate the directions of liquid motion.

The measured emission value is normalized so that the tip emission in air is equal to 1. In this measurement, we observe 3.5 times of enhancement when the tip is completely immersed in the liquid with nsurr = 1.3 (z = 80 μm) than in air (z = 0 μm). This enhancement clearly demonstrates that the plasmon coupling efficiency is improved significantly when the plasmonic tip is in the liquid. Meanwhile, we expect only about 2.91 fold increase of SPP excitation (see Fig. 1d) indicated by a red dashed line in Fig. 3b. This difference can be explained by the slight variance of coating thicknesses and tip cone angles in the calculation and experiment. Furthermore, the tip's total emission to the far-field can increase due to the scattering of plasmons that occurs during the propagation to the apex. The plasmon scattering is expected to be much stronger in liquids than in air.

We perform the same measurements for the liquid with nsurr = 1.71 and present the results in Fig. 3c. It is shown that the emission drops abruptly from 1 in air to 0.4 when the tip is fully immersed (z ≈ 51 μm) in the liquid with nsurr = 1.71. This decrease in emission is significantly smaller than the enhancement that is observed with the liquid with nsurr = 1.3. Consequently, we can claim that the plasmon excitation is suppressed in liquid with nsurr = 1.71. However, we expect theoretically 0 emission indicated by a red dashed line in Fig. 3c. The Co-SP mode is not excited anymore because the phase matching condition is violated in this liquid (orange and black curves do not intersect in Fig. 1c). This residue emission (0.4) can originate from a leakage of WG modes due to thinning of the gold layer. There occurs slow etching of the gold layer because of the chemical composition of the liquid and heating of the tip. Due to this etching process, we stopped the scan at position 53 μm. This process can be controlled with the laser beam power and speed of vertical movement of the cuvette. With proper adjustments of these parameters besides the liquid's chemical composition, one might be able to use this etching effect for plasmonic tip sharpening like the electrochemical etching.41

For demonstrating the plasmonic tip's ability as a sensor, it is necessary to measure the sensitivity to the relative change of the surrounding medium's refractive index. The plasmonic tip is expected to perform well in such applications since a fully metal-coated step index fiber tip has already been used for measuring the increasing concentration of Na+ in a liquid over time.32,42

Wetting effect and tapered liquid-layers

During the measurement in liquid with nsurr = 1.3, we observed 2 distinctive peaks (z = 27.8 μm and 41.6 μm in Fig. 3b) in the emission curve. The tip emission can be increased due to several reasons such as: (1) direct tunneling of the WG modes through the metal layer, (2) resonant excitation of other plasmonic modes besides the radially polarized one, or (3) resonant out-coupling of the WG mode into some photonic modes. Since the first case should cause constant increase but not peaks in the emission curve, it is unlikely to be the reason of these high peaks. Furthermore, the second case also can be eliminated because we have already demonstrated that there are only radially polarized WG modes in the tapered fiber as shown in the Fig. 2. These WG modes are only non-orthogonal to the fundamental radially polarized plasmon mode thus cannot excite other higher order plasmonic modes. Consequently, we conclude that the last case is the most probable explanation for these high peaks that appeared in the emission curve. These resonance peaks are well observable in the liquid with nsurr = 1.3 yet negligible in the liquid with nsurr = 1.71. To understand further, we observe the plasmonic tip from side when it is in the cuvette with each liquid. We found out that due to the wetting effect, the tip's gold surface attracts the liquid thus forms a thin tapered layer of liquid over the gold surface. This layer acts as a thin dielectric tapered waveguide on the tip's gold surface. Fig. 4a illustrates the situation when the tip apex is in air yet close enough to the liquid–air interface. When the condition is met, the tapered fiber modes can resonantly couple to the waveguide modes of the tapered liquid-layer resulting such strong emission peaks.42,43 These two peaks could be attributed to the first two radial orders of the radially polarized modes: TM01 and TM02.
image file: c6ra09341h-f4.tif
Fig. 4 (a) Tapered liquid-layer formed over a plasmonic tip. Due to an attraction between the liquid and gold surface, a layer of liquid covers over the plasmonic tip that can act as a tapered dielectric waveguide. Thus, the waveguide mode of the tapered fiber core can resonantly couple to the waveguide modes of tapered liquid-layer and to the Co-SP mode at the metal-liquid interface. (b) Schematic illustration of the contact angle between a gold surface and a liquid droplet. The higher the contact angle is, the greater the attraction is. (c) Contact angle of a liquid with nsurr = 1.3 is about ψ = 5°. (d) Contact angle of a liquid with nsurr = 1.71 is about ψ = 25°.

We measure the contact angle of each liquid droplets on a planar gold surface as shown in Fig. 4b and present the results in Fig. 4c and d. The contact angle is ψ = 5° for the liquid with nsurr = 1.3 and ψ = 25° for the liquid with nsurr = 1.71 (for details, see Method). Since both droplets form concave meniscus with an angle below 90°,44 both liquids are attracted to the gold surface. The smaller the contact angle is, the stronger the attraction of liquid molecules to the gold surface is. Therefore, the liquid with nsurr = 1.3 effectively forms a thin tapered liquid-layer around the plasmonic tip. We assume this tapered liquid-layer over the tip acts as a tapered dielectric waveguide as shown in Fig. 4a. The power from the waveguide mode of the fiber can resonantly transfer to modes of this liquid layer and also the plasmonic mode at the metal–liquid interface. All these modes scatter to the far-field and result in high peaks in the emission curve. The resonant coupling of the waveguide modes occurs only at phase matching that takes place at certain configurations of the tapered liquid-layer. Consequently, the peaks correspond to specific positions of the plasmonic tip at the liquid–air interface (z = 27.8 μm and 41.6 μm in Fig. 3b). Since the contact angle of the liquid with nsurr = 1.71 is 5 times larger than the liquid with nsurr = 1.3, the liquid forms a thick and short tapered liquid-layer. Therefore, the coupling of the waveguide modes is not as efficient as the low index medium. Consequently, the emission curve in Fig. 3c is free of strong peaks and dips. A more detailed study, both analytical and experimental, is required to further explore this phenomenon of resonant coupling of WG modes and formation of a tapered liquid-layer waveguide.

Conclusion

In this study, we demonstrated the adiabatic confinement of the radially polarized modes in the plasmonic tip and studied, both analytically and experimentally, its emission characteristics in liquids. First, we discussed analytically the enhancement of the resonant coupling process between the waveguide and the Co-SP modes in liquids compared with air. We showed that the coupling efficiency can increase or vanish in an optically dense medium (such as liquids) due to the changes that occur in the field distribution and the phase-matching condition. In liquids, the penetration depth decreases slightly reducing the coupling efficiency while the interaction length prolongs increasing the coupling efficiency. Among these two processes, the increase of interaction length dominates hence the overall coupling efficiency increases. Next, we experimentally demonstrated the gradual transformation of the radially polarized mode: from the vortex fiber with a diameter of 115 μm down to the tapered region of the tip with a diameter of 1.42 μm and finally to the apex with a diameter of 200 nm as a plasmonic mode. The polarization resolved mode intensity images showed that the polarization state can be well conserved through the taper. By cross-sectioning a tip at a diameter of 3 μm, we learned that the tapering process adiabatically scales down the cladding-to-core ratio and preserves the ring-shaped structure of the fiber core. By imaging the tip emission, we showed that the field is localized at the tip apex and is radially polarized. These characteristics are unique to the fundamental conical surface plasmon mode also known as the superfocusing mode. Finally, we studied experimentally the plasmonic tip emission characteristics in liquids and at a liquid–air interface. We showed that the tip emission induced by plasmons increases in liquid with nsurr = 1.3 and vanishes in liquid with nsurr = 1.71 with respect to air. These measurements agree well with our analytical prediction. We also observed strong peaks in the tip's front emission while the tip crosses the interface between air and liquid. By studying the wetting condition of the liquids, we concluded that the gold surface of the tip attracts liquids and thus forms a tapered liquid-layer over the tip. Since the liquid with nsurr = 1.3 forms a thin tapered-layer, it enables an efficient resonant out-coupling of the fiber mode thus increasing the tip emission 12 times more than in air.

In conclusion, the plasmonic tip, a SNOM tip based on the radially polarized Co-SP mode, combines advantages both from the SNOM and the SPPs. Besides its high mobility and selectivity, the tip can also provide a highly localized and spectrally tunable hot-spot at its apex. Due to the increased coupling efficiency and field confinement at the metal–liquid interface in an optically dense medium, the field at the apex of the plasmonic tip is further confined and increased in power. This suggests that there can be many interesting applications of the plasmonic tip in a liquid environment: for instance, trapping and manipulating single particles or molecules; sensing environmental changes or vibration; or using a thin polymer or silicon coating layer over the tip to improve the coupling efficiency and field confinement at the tip apex. Thus, we demonstrated the adiabatic confinement process of radially polarized modes in plasmonic tips and showed that the tip emission can be controlled in liquids depending on the wetting condition and the refractive index of the liquid.

Methods

Fabrication of plasmonic tips

For fabricating the plasmonic tip, the vortex fiber is tapered with a heating and pulling technique and then gold coated with a physical vapor deposition method. For 100 nm of gold coating, we produce a plasmonic tip with an apex diameter of about 200 nm.

Plasmonic tip emission in liquids

Fig. 3a depicts the experimental setup for recording the tip's far-field emission in liquids. A cuvette, with a small hole on the bottom, is half filled with a liquid, and the plasmonic tip goes through the hole into the cuvette with the liquid. We used two types of refractive index matching liquids from Cargille Laboratories: with refractive indices of 1.3 (Series AAA) and 1.71 (Series M). To use one tip in both liquids subsequently, we first use the liquid with nsurr = 1.3 since it is the less invasive one. After cleaning the tip with few droplets of isopropanol, we use it in the other liquid with nsurr = 1.71. We use a piezo scanner (Tritor 100SG, Piezosystem Jena GmbH) to move the cuvette with a liquid. The cuvette (liquid surface) moves vertically up (starts at z = 0 μm) toward the tip apex while the tip's position is fixed with respect to the objective that collects the tip's front emission. We use an Olympus 4× objective with a depth of field of 15.5 μm.45 By centering the focal volume of the objective at the tip apex, the emission from the tip is collected and recorded with a photomultiplier tube. At z = 0 μm, the last part (≈50 μm) of the tip is above the liquid surface so that the liquid covers the tip completely at the end of the scan. In such configuration, the liquid layer covering the tip doesn't shift the tip emission out of the focal volume of the objective.

Wetting effect and tapered liquid-layers

To understand the formation of the tapered liquid-layer, we study the wetting condition for each liquid by measuring the contact angle. Fig. 4b illustrates the contact angle between the liquid droplet surface and the gold surface. The gold surface is prepared by depositing 100 nm of gold layer on a quartz substrate with the physical vapor deposition method. We deposit a droplet of each liquid on a gold surface (close to the edge) and image it with a microscope from side. Fig. 4c and d present the side images where a flat surface of gold and a curved surface of the droplets are shown.

Conflict of interest

The authors declare no competing financial interests.

Acknowledgements

The authors acknowledge financial and facility support from Carl Zeiss Foundation, DFG NanoGuide PE 152415-2, and DFG MetaLiquid PE 152417-1.

References

  1. C. Nylander, B. Liedberg and T. Lind, Sens. Actuators, 1982, 3, 79–88 CrossRef CAS.
  2. J. Homola, H. Vaisocherová, J. Dostálek and M. Piliarik, Methods, 2005, 37, 26–36 CrossRef CAS PubMed.
  3. C. Höppener and L. Novotny, Nano Lett., 2008, 8, 642–646 CrossRef PubMed.
  4. H. Xin, R. Xu and B. Li, Sci. Rep., 2012, 2, 818 Search PubMed.
  5. V. Garcés-Chávez, R. Quidant, P. J. Reece, G. Badenes, L. Torner and K. Dholakia, Phys. Rev. B: Condens. Matter Mater. Phys., 2006, 73, 085417 CrossRef.
  6. S. Lal, S. Link and N. J. Halas, Nat. Photonics, 2007, 1, 641–648 CrossRef CAS.
  7. X. D. Hoa, A. G. Kirk and M. Tabrizian, Biosens. Bioelectron., 2007, 23, 151–160 CrossRef CAS PubMed.
  8. G. Baffou and R. Quidant, Chem. Soc. Rev., 2014, 43, 3898–3907 RSC.
  9. J. N. Anker, W. P. Hall, O. Lyandres, N. C. Shah, J. Zhao and R. P. Van Duyne, Nat. Mater., 2008, 7, 442–453 CrossRef CAS PubMed.
  10. M. L. Juan, M. Righini and R. Quidant, Nat. Photonics, 2011, 5, 349–356 CrossRef CAS.
  11. E. M. Yeatman, Biosens. Bioelectron., 1996, 11, 635–649 CrossRef CAS.
  12. E. Kretschmann, Z. Phys., 1971, 241, 313–324 CrossRef CAS.
  13. M. Righini, G. Volpe, C. Girard, D. Petrov and R. Quidant, Phys. Rev. Lett., 2008, 100, 186804 CrossRef PubMed.
  14. A. V Kabashin, P. Evans, S. Pastkovsky, W. Hendren, G. A. Wurtz, R. Atkinson, R. Pollard, V. A. Podolskiy and A. V. Zayats, Nat. Mater., 2009, 8, 867–871 CrossRef PubMed.
  15. J. Fulmes, R. Jäger, A. Bräuer, C. Schäfer, S. Jäger, D. A. Gollmer, A. Horrer, E. Nadler, T. Chassé, D. Zhang, A. J. Meixner, D. P. Kern and M. Fleischer, Nanoscale, 2015, 7, 14691–14696 RSC.
  16. A. Goryu, R. Numano, A. Ikedo, M. Ishida and T. Kawano, Nanotechnology, 2012, 23, 415301 CrossRef PubMed.
  17. C. Schäfer, D. P. Kern and M. Fleischer, Lab Chip, 2015, 15, 1066–1071 RSC.
  18. Z. Fang, C. Lin, R. Ma, S. Huang and X. Zhu, ACS Nano, 2010, 4, 75–82 CrossRef CAS PubMed.
  19. Z. Fang, Q. Peng, W. Song, F. Hao, J. Wang, P. Nordlander and X. Zhu, Nano Lett., 2011, 11, 893–897 CrossRef CAS PubMed.
  20. J. Tae Kim, S. Spindler and V. Sandoghdar, Nat. Commun., 2014, 5, 3380 Search PubMed.
  21. M. De Serio, H. Mohapatra, R. Zenobi and V. Deckert, Chem. Phys. Lett., 2006, 417, 452–456 CrossRef CAS.
  22. M. Mivelle, T. S. van Zanten, L. Neumann, N. F. van Hulst and M. F. Garcia-Parajo, Nano Lett., 2012, 12, 5972–5978 CrossRef CAS PubMed.
  23. J. Berthelot, S. S. Aćimović, M. L. Juan, M. P. Kreuzer, J. Renger and R. Quidant, Nat. Nanotechnol., 2014, 9, 295–299 CrossRef CAS PubMed.
  24. http://www.ntmdt.com/.
  25. B. N. Tugchin, N. Janunts, A. E. Klein, M. Steinert, S. Fasold, S. Diziain, M. Sison, E.-B. Kley, A. Tünnermann and T. Pertsch, ACS Photonics, 2015, 2, 1468–1475 CrossRef CAS.
  26. S. Ramachandran, P. Kristensen and M. F. Yan, Opt. Lett., 2009, 34, 2525 CrossRef PubMed.
  27. N. Bozinovic, Y. Yue, Y. Ren, M. Tur, P. Kristensen, H. Huang, A. E. Willner and S. Ramachandran, Science, 2013, 340, 1545–1548 CrossRef CAS PubMed.
  28. S. Ramachandran and P. Kristensen, Nanophotonics, 2013, 2, 455–474 CrossRef.
  29. N. Janunts, K. Baghdasaryan, K. Nerkararyan and B. Hecht, Opt. Commun., 2005, 253, 118–124 CrossRef CAS.
  30. W. Ding, S. Andrews and S. Maier, Phys. Rev. A, 2007, 75, 063822 CrossRef.
  31. J. Barthes, G. C. des Francs, A. Bouhelier and A. Dereux, New J. Phys., 2012, 14, 83041 CrossRef.
  32. K. Kurihara, H. Ohkawa, Y. Iwasaki, O. Niwa, T. Tobita and K. Suzuki, Anal. Chim. Acta, 2004, 523, 165–170 CrossRef CAS.
  33. K. Nerkararyan, Phys. Lett. A, 1997, 237, 103–105 CrossRef CAS.
  34. D. K. Gramotnev, J. Appl. Phys., 2005, 98, 104302 CrossRef.
  35. M. Stockman, Phys. Rev. Lett., 2004, 93, 137404 CrossRef PubMed.
  36. H. Komatsu, M. Miyachi, E. Fujii, D. Citterio, K. Yamada, Y. Sato, K. Kurihara, H. Kawaguchi and K. Suzuki, Sci. Technol. Adv. Mater., 2006, 7, 150–155 CrossRef CAS.
  37. E. Fujii, T. Koike, K. Nakamura, S. Sasaki, K. Kurihara, D. Citterio, Y. Iwasaki, O. Niwa and K. Suzuki, Anal. Chem., 2002, 74, 6106–6110 CrossRef CAS PubMed.
  38. A. D. Rakic, A. B. Djurišic, J. M. Elazar and M. L. Majewski, Appl. Opt., 1998, 37, 5271 CrossRef CAS PubMed.
  39. D. Sarid and W. Challener, Modern Introduction to Surface Plasmons, Cambridge University Press, 1st edn, 2010 Search PubMed.
  40. C. Ropers, C. C. Neacsu, T. Elsaesser, M. Albrecht, M. B. Raschke and C. Lienau, Nano Lett., 2007, 7, 2784–2788 CrossRef CAS PubMed.
  41. B. Ren, G. Picardi and B. Pettinger, Rev. Sci. Instrum., 2004, 75, 837 CrossRef CAS.
  42. K. S. Kazuyoshi Kurihara, H. Ohkawa, Y. Iwasaki, T. Tobita and O. Niwa, Japan Society for Analytical Chemistry, 2001, 17, i433–i436 Search PubMed.
  43. T. Abrahamyan, E. Janunts and K. Nerkararyan, Appl. Opt., 2006, 45, 8194 CrossRef CAS PubMed.
  44. P. de Gennes, Rev. Mod. Phys., 1985, 57, 827–863 CrossRef CAS.
  45. http://www.olympusmicro.com/primer/anatomy/objectives.html.

Footnotes

Electronic supplementary information (ESI) available. See DOI: 10.1039/c6ra09341h
Present Address: Institute of Applied Physics, Johannes Kepler University Linz, 4040 Linz, Austria.

This journal is © The Royal Society of Chemistry 2016
Click here to see how this site uses Cookies. View our privacy policy here.