In situ photoacoustic imaging of carbon nanotube displacements in a strained polymer matrix†
Wen-Yi Lina,
Chung-Hao Chenb,
Kuan-Ming Chenc,
Chi-Chih Hode and
Wen-Kuang Hsu*a
aDepartment of Materials Science and Engineering, National Tsing Hua University, Hsinchu 30013, Taiwan. E-mail: wkhsu@mx.nthu.edu.tw
bDepartment of Electrical Engineering, National Tsing Hua University, Hsinchu 30013, Taiwan
cInstitute of Physics, Academia Sinica, Taipei 11529, Taiwan
dDepartment of Engineering and System Science, National Tsing Hua University, Hsinchu 30013, Taiwan
eNano Science and Technology Program, Taiwan International Graduate Program, Academia Sinica, Taipei 11529, Taiwan
First published on 29th April 2016
Abstract
A non-destructive method consisting of photo-acoustic imaging and velocimetric measurement is employed to probe single-walled carbon nanotubes–polydimethylsiloxane composites before and after stress application. Tube aggregates are present from region to region and move along the stressing direction by 0.3–0.4 mm. Aggregates also split with stressing and segmentation is supported by in situ photo-acoustic images.
Carbon nanotubes (CNTs) have been predicted as ideal fillers for polymer composites. However, experimental results fall far short of theory since tubes tend to agglomerate in polymers. Characterization of CNTs/polymer composites currently relies on electron microscopy (e.g. TEM/SEM) and Raman spectroscopy: the former provides information regarding to tube dispersion and tube-polymer affinity is determined by contact angle and wetting capability.1 The latter analyzes Raman shift of embedded CNTs and C–C stretching mode due to compressive stresses may move to short wavelength.2 Weak binding at interfaces however implies that tubes may displace with stressing and movements are expected to take place at tube aggregates according to following. First, tube aggregation yields porous structure3 and, second, tubes slip with shear stresses.4 Various imaging-based techniques have been developed to probe displacement field of soft material and biological features embedded in human tissues, including particle image velocimetry (PIV),5–8 digital image/volume correlation (DIC/DVC),9–12 digital camera,9,13 CCD camera,14,15 stereo, confocal and optical microscopy (OM).16 Cited methods however fail to measure CNTs–polymer composites because materials absorb light and transparency is low. Photo-acoustic (PA) microscopy is a powerful tool capable of detecting embedded objects and processes include two steps; (i) incident of a nano-second pulsed laser onto samples and conversion of absorbed light into outgoing ultrasound wave; (ii) detection of acoustic signal by an ultrasound transducer and image reconstruction.17–19 In this work, single-walled CNTs (SWCNTs) are used as PA imaging agent and are incorporated into polydimethylsiloxane (PDMS).18–22 Study reveals that tube aggregates move with stressing and displacement is measured to be 0.3–0.4 mm. Stressing also induces segmentation of large aggregates and splitting is verified by in situ PA imaging and PIV profiles. Technique presented here is found capable of imaging tube aggregates with dimension of 1 × 10⁻³ mm2.
Arc-made SWCNTs (99% purity, 1.4 ± 0.5 nm in diameter, 2–5 μm in length, Taiwan Carbon Nanotube Technology Corporation) and PDMS (hardener-to-monomer ratio = 1![[thin space (1/6-em)]](https://www.rsc.org/images/entities/char_2009.gif) :
:![[thin space (1/6-em)]](https://www.rsc.org/images/entities/char_2009.gif) 20, Dow Corning Sylgard 184 kit, Sil-More Industrial Ltd) are blended in an ultrasonic bath (30 min), followed by three-roller mill mixing (30 min) and evacuation (5 min) to remove air bubbles. It is worth mentioning that selection of PDMS is based on two factors; soft and low reflection of light. The former allows polymer deformation at a small stress and enhancement of PA signal for the latter. SWCNTs/PDMS composites with 0.1 wt% tube loading are cured at 80 °C and then shaped into bone-like plates (50 × 30 × 3 mm) according to ASTM Standards D1708 (Instron-4484, load cell = 1 kN, ESI-1†). OM and SEM are employed to inspect tube dispersion in PDMS and tube aggregates are identified using an ImageJ software (particle size analyses).23 For PA imaging, sample is mounted onto a high-precision uniaxial moving stage (axial and lateral resolution = 36 and 65 μm) which is then immersed into a water bath, along with an ultrasound transducer (50 MHz, 6 dB fractional bandwidth of 57.5%, focal length of 9 mm and 6 mm active element) (ESI-1†).24 A pulse-laser is fixed above water bath and laser pulses are provided at 570 nm wavelength using an optical parametric oscillator (Surlite OPO Plus, Continuum) pumped by a frequency-doubled Nd:YAG Q-switched laser (Surlite II-10, Continuum, pulse width = 6.5 ns and pulse repetition frequency = 10 Hz).23 The PA imaging system is connected to computer-controlled moving stage so that it can scan along tensile direction. Experiments are carried out at focus length of 9 mm and imaging depth is set at 9 ± 1 mm. Two-dimensional PA images of SWCNTs/PDMS composites are recorded before and after 1–10% tensile stress application.
20, Dow Corning Sylgard 184 kit, Sil-More Industrial Ltd) are blended in an ultrasonic bath (30 min), followed by three-roller mill mixing (30 min) and evacuation (5 min) to remove air bubbles. It is worth mentioning that selection of PDMS is based on two factors; soft and low reflection of light. The former allows polymer deformation at a small stress and enhancement of PA signal for the latter. SWCNTs/PDMS composites with 0.1 wt% tube loading are cured at 80 °C and then shaped into bone-like plates (50 × 30 × 3 mm) according to ASTM Standards D1708 (Instron-4484, load cell = 1 kN, ESI-1†). OM and SEM are employed to inspect tube dispersion in PDMS and tube aggregates are identified using an ImageJ software (particle size analyses).23 For PA imaging, sample is mounted onto a high-precision uniaxial moving stage (axial and lateral resolution = 36 and 65 μm) which is then immersed into a water bath, along with an ultrasound transducer (50 MHz, 6 dB fractional bandwidth of 57.5%, focal length of 9 mm and 6 mm active element) (ESI-1†).24 A pulse-laser is fixed above water bath and laser pulses are provided at 570 nm wavelength using an optical parametric oscillator (Surlite OPO Plus, Continuum) pumped by a frequency-doubled Nd:YAG Q-switched laser (Surlite II-10, Continuum, pulse width = 6.5 ns and pulse repetition frequency = 10 Hz).23 The PA imaging system is connected to computer-controlled moving stage so that it can scan along tensile direction. Experiments are carried out at focus length of 9 mm and imaging depth is set at 9 ± 1 mm. Two-dimensional PA images of SWCNTs/PDMS composites are recorded before and after 1–10% tensile stress application.
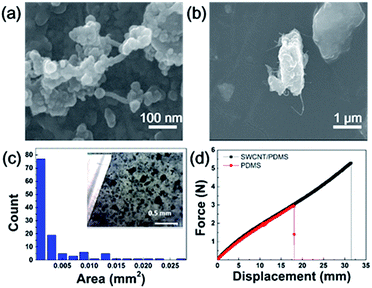
SEM images obtained from fractured surfaces of composite show that clusters due to tube aggregation mostly range at 0.005–0.01 mm2 (Fig. 1a), together with large aggregates occasionally seen from region to region (Fig. 1b). Histogram of particle size distribution (Fig. 1c) and OM image (insert) support SEM inspections and cluster population mainly falls into <0.015 mm2 and >0.015 mm2: the former takes up 70% and 30% for the latter. Tube aggregation is also evident by unimproved modulus, i.e. PDMS (red) and composite (dark) display a similar force–displacement plot (Fig. 1d). However, SWCNT addition promotes the maximum yield strength by 80%, indicative of improved resistance to tension (F–D curve, Fig. 1d). This outcome is rational because tubes consist of conjugated networks and C–C bond strength contributes mainly along tensile direction.25
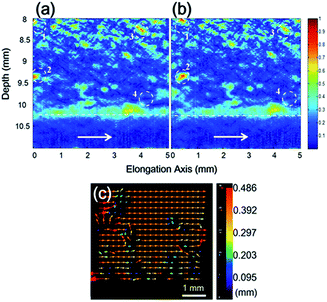
Fig. 2a and b shows PA images before and after stress application; arrows and white dash lines denote stressing direction and sample/water interface at 10.2 mm. Clearly, the tube deficit area (deep blue) dominates at 8–10 mm region and elongated features due to tube aggregation take up only 25%. Comparing Fig. 2a and b, one can distinguish changes in fringe contrast and variations are attributed to stressing induced movements of tube aggregates (i.e. circles marked with numbers). First, aggregates move in consistency with stressing direction and average displacement is measured to be 0.3–0.4 mm. Second, displacement field calculated by PIV verifies strain localization around moving aggregates (arrows and colours represent direction and amount of displacement vector, Fig. 2c).26 We find that stressing also induces segmentations of tube aggregates, particularly for aggregates with dimension exceeding 0.015 mm2.
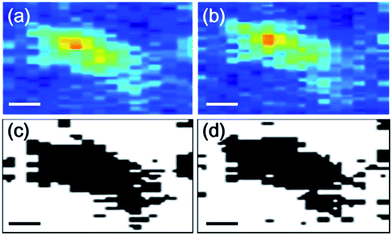
Fig. 3a and b shows PA images of a selected aggregate that has changed in shape and fringe contrast after stressing. We then use ImageJ software to minimize background contribution to PA image (Fig. 3c and d). In this case, deformation can be calculated according to shape parameters, including circularity and solidity (eqn (1) and (2)).27
 | (1) |
 | (2) |
 | ||
| Fig. 3 A selected PA image before (a) and after stressing (b) and, corresponding shape parameter images (c and d); the scale bar is 100 μm. | ||
Both lie between 0 and 1 and are often used to characterize stress induced distortion according to cross-section and projection;27 the greater the value the lesser the particle distortion along circumference and radial directions. Calculation reveals the area, circularity and solidity of isolated feature to be 0.073 mm2, 0.182 and 0.728 for Fig. 3a and 0.073 mm2, 0.185 and 0.677 for Fig. 3b; the increase and decrease in circularity and solidity again verify aggregate segmentation. However, localized strains evolve into crack as stress reaches 6% and cracking path is roughly in perpendicular to tensile direction (ESI-2†). At 10% strain, multiple cracking paths emerge and remain more-or-less vertical to stressing direction (ESI-2†). Additional PA images obtained from different sample further reveal that distinguishable displacements take place at 2% strain and aggregate segmentation at 4% strain, corresponding to 50 μm/0.01 N (ESI-3†). This number however may be modified with ±20% because PA resolution here lies axial = 36 μm and lateral = 65 μm. Re-joint of tube aggregates is also observed and underling mechanism possibly involves different rates of displacement; first, aggregates are dispersed and are different in dimensions; second, individual aggregates undergo various stresses (circle 3 → 3′, ESI-3†). In light of above data, effects due to tube aggregation include (i) strain location, (ii) evolution of localized strains into fractures at >6% strain, (iii) unimproved modulus, (iv) tube cluster migrations, and (v) segmentation of large CNT aggregates along stressing direction.
Conclusions
A nondestructive technique consisting of PA imaging, OM and PIV is employed to monitor SWCNTs embedded in PDMS. Tubes aggregate in polymer and aggregation is verified by PA images. Stressing induces aggregate displacements and segmentation along tensile direction and strains are localized at tube aggregates. Fracture occurs as stresses exceed 6% strain and cracking paths lie in perpendicular to stressing direction.References
- E. Dujardin, T. Ebbesen, H. Hiura and K. Tanigaki, Science, 1994, 265, 1850–1852 CAS.
- P. M. Ajayan, L. S. Schadler, C. Giannaris and A. Rubio, Adv. Mater., 2000, 12, 750–753 CrossRef CAS.
- W. Hsu, V. Kotzeva, P. Watts and G. Chen, Carbon, 2004, 42, 1707–1712 CrossRef CAS.
- S.-H. Syue, C.-T. Hsu, U.-S. Chen, H.-J. Chen, W.-K. Hsu and H.-C. Shih, Carbon, 2009, 47, 1239–1243 CrossRef CAS.
- M. A. Sutton, J. J. Orteu and H. Schreier, Image correlation for shape, motion and deformation measurements: basic concepts, theory and applications, Springer Science & Business Media, 2009 Search PubMed.
- A. J. Michalek, M. R. Buckley, L. J. Bonassar, I. Cohen and J. C. Iatridis, J. Biomech., 2009, 42, 2279–2285 CrossRef PubMed.
- M. R. Buckley, J. P. Gleghorn, L. J. Bonassar and I. Cohen, J. Biomech., 2008, 41, 2430–2437 CrossRef PubMed.
- W. Peters and W. Ranson, Opt. Eng., 1982, 21, 213427 CrossRef.
- R. H. Pritchard, P. Lava, D. Debruyne and E. M. Terentjev, Soft Matter, 2013, 9, 6037–6045 RSC.
- P. Lava, S. Cooreman and D. Debruyne, Optic. Laser Eng., 2010, 48, 457–468 CrossRef.
- C. Franck, S. Hong, S. Maskarinec, D. Tirrell and G. Ravichandran, Exp. Mech., 2007, 47, 427–438 CrossRef.
- L. Chevalier, S. Calloch, F. Hild and Y. Marco, Eur. J. Mech. Solid., 2001, 20, 169–187 CrossRef.
- A. J. McClung, G. Tandon, K. Goecke and J. Baur, Polym. Test., 2011, 30, 140–149 CrossRef CAS.
- S. Lee, F. Barthelat, N. Moldovan, H. D. Espinosa and H. N. G. Wadley, Int. J. Solids Struct., 2006, 43, 53–73 CrossRef.
- H. Bechir, L. Chevalier, M. Chaouche and K. Boufala, Eur. J. Mech. Solid., 2006, 25, 110–124 CrossRef.
- T. Cheng, C. Dai and R. Z. Gan, Ann. Biomed. Eng., 2007, 35, 305–314 CrossRef PubMed.
- P.-J. Chen, S.-H. Hu, C.-T. Fan, M.-L. Li, Y.-Y. Chen, S.-Y. Chen and D.-M. Liu, Chem. Commun., 2013, 49, 892–894 RSC.
- A. De La Zerda, C. Zavaleta, S. Keren, S. Vaithilingam, S. Bodapati, Z. Liu, J. Levi, B. R. Smith, T. J. Ma, O. Oralkan, Z. Cheng, X. Y. Chen, H. J. Dai, B. T. Khuri-Yakub and S. S. Gambhir, Nat. Nanotechnol., 2008, 3, 557–562 CrossRef CAS PubMed.
- D. Chen, C. Wang, X. Nie, S. Li, R. Li, M. Guan, Z. Liu, C. Chen, C. Wang, C. Shu and L. Wan, Adv. Funct. Mater., 2014, 24, 6621–6628 CrossRef CAS.
- P. K. Avti, S. Hu, C. Favazza, A. G. Mikos, J. A. Jansen, K. R. Shroyer, L. V. Wang and B. Sitharaman, PLoS One, 2012, 7, e35064 CAS.
- A. Zerda, Z. Liu, S. Bodapati, R. Teed, S. Vaithilingam, B. T. Khuri-Yakub, X. Chen, H. Dai and S. S. Gambhir, Nano Lett., 2010, 10, 2168–2172 CrossRef PubMed.
- J. W. Kim, E. I. Galanzha, E. V. Shashkov, H. M. Moon and V. P. Zharov, Nat. Nanotechnol., 2009, 4, 688–694 CrossRef CAS PubMed.
- C. A. Schneider, W. S. Rasband and K. W. Eliceiri, Nat. Methods, 2012, 9, 671–675 CrossRef CAS PubMed.
- H.-W. Yang, H.-L. Liu, M.-L. Li, I. W. Hsi, C.-T. Fan, C.-Y. Huang, Y.-J. Lu, M.-Y. Hua, H.-Y. Chou, J.-W. Liaw, C.-C. M. Ma and K.-C. Wei, Biomaterials, 2013, 34, 5651–5660 CrossRef CAS PubMed.
- T. Ozaki, Y. Iwasa and T. Mitani, Phys. Rev. Lett., 2000, 84, 1712 CrossRef CAS PubMed.
- Q. Tseng, E. Duchemin-Pelletier, A. Deshiere, M. Balland, H. Guillou, O. Filhol and M. Théry, Proc. Natl. Acad. Sci. U. S. A., 2012, 109, 1506–1511 CrossRef CAS PubMed.
- M. D. Abràmoff, P. J. Magalhães and S. J. Ram, Biophotonics International, 2004, 11, 36–42 Search PubMed.
Footnote |
| † Electronic supplementary information (ESI) available. See DOI: 10.1039/c6ra07207k |
| This journal is © The Royal Society of Chemistry 2016 |


