 Open Access Article
Photoacoustic induced surface acoustic wave sensor for concurrent opto-mechanical microfluidic sensing of dyes and plasmonic nanoparticles†
Rahul
Kishor‡
abc,
Fei
Gao‡
c,
Sivaramapanicker
Sreejith‡
d,
Xiaohua
Feng
c,
Yen Peng
Seah
e,
Zhenfeng
Wang
e,
Mihaiela Corina
Stuparu
df,
Teik-Thye
Lim
g,
Xiaodong
Chen
f and
Yuanjin
Zheng
*c
aEnvironmental Chemistry and Materials Group, Nanyang Environment and Water Research Institute (NEWRI), Nanyang Technological University, 1 Cleantech Loop, 637141, Singapore
bInterdisciplinary Graduate School (IGS), Nanyang Technological University, 50 Nanyang Avenue, 639798, Singapore
cDivision of Circuits and Systems, School of Electrical and Electronic Engineering, Nanyang Technological University, 50 Nanyang Avenue, 639798, Singapore. E-mail: YJZHENG@ntu.edu.sg; Fax: +65-67933318; Tel: +65-65927764
dDivision of Chemistry and Biological Chemistry, School of Physical and Mathematical Sciences, Nanyang Technological University, 21 Nanyang Link, 637371, Singapore
eSingapore Institute of Manufacturing Technology, 71 Nanyang Drive, 638075, Singapore
fSchool of Materials Science and Engineering, Nanyang Technological University, 50 Nanyang Avenue, 639798, Singapore
gDivision of Environmental and Water Resources Engineering, School of Civil and Environmental Engineering, Nanyang Technological University, 50 Nanyang Avenue, 639798, Singapore
First published on 17th May 2016
Abstract
While there are a large number of reports on acoustic wave based sensors for evaluating mechanical parameters of fluid samples such as density, viscosity etc., devices for the simultaneous optical and mechanical characterization of fluids remain unexplored. In this context, effective utilization of surface acoustic wave (SAW) sensors comprising elliptically polarized evanescent waves for optical characterization of an analyte is intriguing. A combination of SAW and photoacoustic (PA) techniques presents promising capabilities for optical and mechanical characterization of fluids in micro volumes. We present a SAW-PA integrated device combining PA and SAW where the samples are introduced into a microfluidic channel. The PA signal generated from a sample in the microchannel of the SAW-PA device is mode-converted into SAW signals upon reaching the piezoelectric substrate, which is detected using the inter-digital transducer (IDT) deposited on the substrate. We further demonstrate the use of this SAW-PA compact platform for investigating the opto-acoustical properties of standard dye solutions and gold nanoparticles whose absorption is due to plasmonic resonance.
Introduction
Surface acoustic waves (SAW) integrated with microfluidics have been generally used for various acoustofluidic applications such as mixing,1 pumping,2 sorting,3,4 concentration5,6 and sensing.7 SAW sensors have also been used to determine mechanical properties including viscosity and density of fluids flowing through a channel between the electrodes.8,9 SAW techniques are suitable for such applications mainly because of their unique features of being compact, inexpensive, biocompatible with cells, molecules and biological samples, energy-efficient and versatile in handling different fluids regardless of their electrical, magnetic or optical properties.10 Moreover, they allow contact-free manipulation of liquids. SAW coupled to disposable superstrate avoids contamination of the samples under analysis.10–12 On the other hand, optofluidic sensors have been explored to characterize the optical properties of liquid samples13–16 including absorptivity, refractive index and even mechanical properties of the fluids such as viscosity.17,18 However, the measurement of fluid viscosity requires introducing particles in the fluid as a probe and involves complex calculations. In order to achieve development of a comprehensive and concurrent (optical and mechanical properties) characterization pathway for diversified analytic samples, a sensor incorporating smart integration of light and sound is highly desirable.Recently, the development of new optical imaging techniques based on photoacoustic (PA) effect such as PA imaging and its combination techniques have been used extensively for sensing and imaging applications,19–23 especially in biomedicine.24–26 Although PA sensing and imaging have demonstrated promising results in both anatomical and functional imaging of small animals in vivo, its applications in a compact microfluidic environment is rarely explored.27 This could be attributed to the inherent limitation of integrating the bulky ultrasound transducer on a small analytical microchip.
In this paper, we proposed and demonstrated the fabrication of a SAW-PA device, which integrated PA sensing with a Rayleigh SAW device. A microfluidic channel was embedded in the system to allow samples to be loaded for investigation. The nano-second pulsed laser focused on the fluid sample in the microchannel triggers PA waves, which couples into a Rayleigh SAW on the piezoelectric substrate for detection. This platform enables characterization of liquid samples by measuring both its optical and mechanical properties simultaneously. Furthermore, the usage of SAW as the receiver of the PA signal in this new design enables a couplant-free (water-free) PA signal sensing in a low cost and compact pathway.
In the current work, we have demonstrated the usage of the SAW-PA sensor to detect the opto-mechanical properties of organic dyes and plasmonic nanoparticles (NP), which represents an optically homogenous and optically heterogeneous medium respectively for generating PA. The multitude of applications possible due to nanoparticles in scientific fields like medicine, pharmacy, nano and bio technology, electronics, photonics and environmental science28 highlights the importance of detecting NP and determining its morphology using a lab-on-chip device.
Materials and methods
SAW device fabrication
SAW device was designed and fabricated on a 128° YX lithium niobate (LiNbO3) substrate with split-finger inter-digital transducer (IDT).29,30 Fig. S1 in the ESI† shows the fabrication process of the device. Table S1 and Fig. S2 in the ESI† provide the detailed dimensions of the SAW IDT and the frequency response (S11) of the SAW device (measured using E5061B ENA Series Network Analyzer) respectively.Fabrication and bonding of microfluidic channel to the substrate
A polydimethylsiloxane (PDMS) microfluidic channel of width 1.15 mm, depth 150 μm and length 15 mm was fabricated by soft lithography with through-holes punched for both inlet and outlet. The PDMS was trimmed along the width (side wall thickness-Ts of 3 mm as shown in Fig. S3†) to reduce the PDMS attenuation of the acoustic wave. The PDMS was bonded to the substrate via oxygen plasma treatment (Inspiraz Technology). The PDMS and the LiNbO3 substrate were cleaned and exposed to oxygen plasma for 2 min. The PDMS microchannel was then aligned and bonded to the SAW substrate. The device was kept in an oven maintained at a temperature of 80 °C for 8 h to strengthen the bond.Reagents and solutions
In this work, we have selected aqueous solutions of two commonly used food coloring dyes and gold nanoparticles as plasmonic materials for analysis. The dyes, erythrosine (red) and brilliant blue were purchased from Sigma-Aldrich Singapore. Spherical gold nanoparticles (GNPs) and gold nanorods (GNRs) were obtained from Nanopartz Inc., USA. All the solutions were prepared with millipore deionized (DI) water. UV/Vis absorption spectra of the dyes and NPs were obtained using a Shimadzu UV-3600 UV-Vis-NIR spectrometer.Experimental setup of SAW-PA device
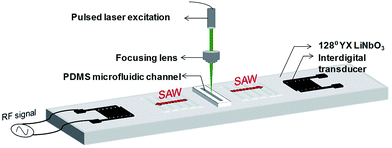
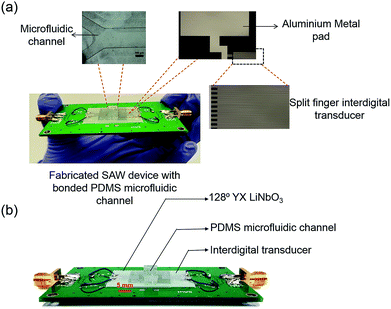
A nano-second pulsed laser light of 10 mJ pulse energy was focused on the microchannel within the aperture of the SAW device, to induce PA signal. The laser-induced PA signal within the fluid in the microchannel was converted to surface acoustic waves in the piezoelectric (128° YX LiNbO3) substrate. The surface acoustic wave propagating on the substrate was detected by the IDT. Fig. 1 shows the schematic representation of the device. Fig. S4† illustrates the experimental configuration consisting of the optical interrogation units, surface acoustic wave device and the electrical measurement units in SAW-PA device. An optical parametric oscillator (OPO) pulsed laser with tunable wavelength (410–2100 nm), 7 ns pulse-width, and 1 mJ pulse energy, was employed as the light source. After attenuation by the neutral density (ND) filter and focusing by the condenser lens, the light was illuminated on the microfluidic channel filled with liquid sample. A pre-amplifier (Panametrics 5077PR) with 59 dB gain was used to amplify the surface wave from the IDT, followed by data acquisition from an oscilloscope (WaveSurfer from LeCroy). Fig. 2(a) shows individual components including split-finger aluminium metal IDT of thickness 150 nm, which was deposited on the 128° YX LiNbO3. Metal pad of thickness 500 nm was used to connect the IDT to the external electrical circuits. Fig. 2(b) shows the vertical alignment of fluidic compartment made of PDMS bonded to the piezoelectric substrate. Prior to sample analysis, an analytical study was conducted to determine the mode conversion efficiency from PA longitudinal wave to the surface acoustic wave in the current device (refer to Fig. S5† for details).Device optimization and data processing
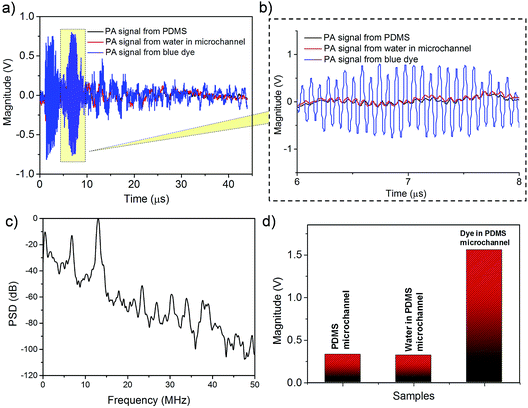
The electrical signal received from the SAW device was post-processed to extract the sample generated PA signal from the background. Fig. 3(a) shows the signal obtained at the IDT due to the laser absorption in the dye for a wavelength of 530 nm. Erythrosine (red) dye was used as the fluidic sample. Laser excitation generates background acoustic signals from the PDMS microfluidic channel. Two control experiments were performed. The first experiment involved detecting the SAW-PA signals generated by the PDMS microchannel (without containing any fluid in it) and the second experiment was performed with deionized (DI) water as the sample fluid in the microchannel. The transient signal obtained from this control experiment was subtracted from the signal of interest generated by the dye in microchannel. At 530 nm, the background signal remains relatively weak compared to the signal generated by the dye as shown in Fig. 3(d). From experiments we observed that the influence of the PDMS was the maximum at the blue spectral region (refer to Fig. S6† for details). The power spectral density in Fig. 3(c) of the time domain signal (0–45 μs) obtained from the dye has a dominant frequency component at 12.9 MHz corresponding to the SAW resonant frequency (refer to ESI Fig. S7† for the PSD spectra of the transient signal from 2–4 μs and 6–8 μs). The microfluidic channel was approximated as a thin slab (width of 1.15 mm and thickness of 150 μm). The pressure waveform was approximated as a Heaviside step function from −d/2 to +d/2 where d denotes the channel thickness. The pressure at the bottom end of the channel, which is converted to SAW, is obtained by using the following:31 | (1) |
The acoustic pressure at z (=−d/2) is a rectangular pulse of width d/vs, with a thickness (d) ca. 150 μm and acoustic velocity (vs) of 1500 m s−1 in water generates a pulse of width 0.1 μs. The corresponding frequency spectrum is a sinc function with the first minima at 10 MHz.
Deconvolution of the SAW-PA signal from the SAW transfer function results in a low pass signal with a −40 dB response at 10 MHz which represents the main lobe of the expected PA frequency spectrum. Hence, the generated PA spectrum agrees with the theoretical analysis. As shown in Fig. 3(a), the signal arrives at 2 μs, which corresponds to the propagation delay of the acoustic wave to reach the IDT. It must be noted that the signal from 6–8 μs was due to the reflected signal from the other IDT. The repeatability of the signal was confirmed by using Pearsons linear correlation coefficients on multiple sets of transient data (refer to ESI Fig. S8† for details).
Results and discussion
Dye absorption spectroscopy using the SAW-PA device
The UV/Vis absorption spectroscopy measurement was performed on the erythrosine (red) and the brilliant blue dyes prior to performing the SAW-PA device characterization. UV/Vis absorption spectra presented in Fig. 4(a) for the erythrosine (6 × 10⁻⁶ M) and brilliant blue (6 × 10⁻⁶ M) dyes show characteristic absorption maximums at 510 nm and 620 nm respectively. During our first set of experiments with the SAW-PA device, the dyes were introduced into the microchannel and the entire device was kept in a shock-free assembly during the measurement. The pulsed-laser repetition rate was set to a low value of 1 Hz to prevent increase in temperature and subsequent heating of sample in the microchannel. The acoustic signal obtained was further post-processed using MATLAB (Matrix Laboratory Programming Language). A band-pass filter with a center frequency of 12.9 MHz and a 6 dB bandwidth of 4 MHz filters the other signal frequencies. The maximum peak–peak amplitude for each optical wavelength excitation was subtracted from the background signal amplitude obtained for the same wavelength. The signal was further normalized against the laser intensities. In Fig. 4(b) the red symbols shows the signal obtained from erythrosine loaded in the SAW-PA device for laser wavelength excitations varying in the 450 nm to 650 nm spectral range.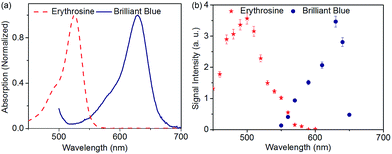 | ||
| Fig. 4 (a) UV/Vis absorption spectrum of erythrosine and brilliant blue (b) measured SAW-PA signal intensity from the erythrosine and brilliant blue dyes at different laser wavelengths. | ||
The measurements were repeated three times to confirm repeatability and the variation was less than 10%. Measured peaks for the erythrosine and the brilliant blue dye were observed at 500 nm and 620 nm respectively, which was in good agreement with the absorption maxima of the dye observed in Fig. 4(a). It must be also noted that a 10 nm blue shift for the mean value of the measured red dye spectra against the expected peak could be attributed to variations in the laser intensity and laser focusing at different wavelengths.
Effect of dye concentration and viscosity on the SAW-PA signal
Further experiments were conducted using the SAW-PA device to evaluate the PA signal generated on the SAW device for different concentrations and viscosities of the dye. Erythrosine dye was used as the sample liquid. The dye was diluted with DI water at room temperature (23 °C) to prepare various volume concentrations ranging from 0 to 100%. The laser light at a fixed wavelength of 530 nm with pulsed excitation was used to illuminate the sample. Fig. 5(a) shows the magnitude of the signal received by the SAW-PA device for different concentrations of the erythrosine dye. The PA signal amplitude depends on the optical absorption coefficient (μa) and the path length (l).32 For μal ≪ 1, the PA signal is directly proportional to the optical absorption coefficient and hence the SAW-PA signal increases with concentrations. However, at higher concentrations the optical penetration depth becomes smaller than the path length, causing saturation of the signal.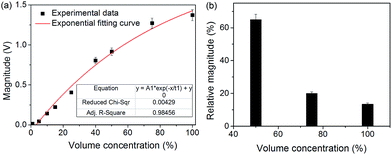 | ||
| Fig. 5 (a) Signal received by the SAW-PA device for different concentration of the dye (expressed in volume percentage). An exponential function of the form mentioned in eqn (3) was used to fit the experimental data. Error bars are presented to confirm the repeatability of the photoacoustic signal received on the SAW-PA device. The model equation fits to the experimental results with an R-square value of 0.985. (b) Percentage increase in the SAW-PA signal intensity of the erythrosine dye–glycerol with respect to the erythrosine dye–water solutions for varying dye concentrations. | ||
A previous research33 has reported the PA amplitude of the form mentioned in eqn (2) for variation in the optical absorption coefficient, which is proportional to the concentration.
PA(z,μa) = μaF0k1![[thin space (1/6-em)]](https://www.rsc.org/images/entities/char_2009.gif) exp(−μaz) exp(−μaz) | (2) |
Y = Y0 + A1![[thin space (1/6-em)]](https://www.rsc.org/images/entities/char_2009.gif) exp(−x/t1) exp(−x/t1) | (3) |
![[thin space (1/6-em)]](https://www.rsc.org/images/entities/char_2009.gif) exp(−x/t1)/t1 denotes concentration of the sample, saturation voltage level due to increasing concentration, concentration at saturation point and sensitivity of output signal respectively. After fitting the model to the experimental data, the obtained values for the unknowns are Y0 = 2.04, A1 = −2.123 and t1 = 80.625. The goodness of fit has an R-square value of 0.985. The SAW-PA amplitude reaches close to saturation (e−1) at a concentration of 80.625%. The dye with various concentrations was analyzed five times to confirm the repeatability. Each reading was averaged over 200 sweeps to improve the signal-noise ratio.
exp(−x/t1)/t1 denotes concentration of the sample, saturation voltage level due to increasing concentration, concentration at saturation point and sensitivity of output signal respectively. After fitting the model to the experimental data, the obtained values for the unknowns are Y0 = 2.04, A1 = −2.123 and t1 = 80.625. The goodness of fit has an R-square value of 0.985. The SAW-PA amplitude reaches close to saturation (e−1) at a concentration of 80.625%. The dye with various concentrations was analyzed five times to confirm the repeatability. Each reading was averaged over 200 sweeps to improve the signal-noise ratio.
As shown in Fig. 5(a), a maximum standard deviation ca. 4.8% for 75% volume concentration was obtained, which indicates good repeatability in the current SAW-PA device.
The ability of our platform to detect the mechanical parameters of a liquid sample was confirmed by sensing the viscosity of a liquid. For this study, erythrosine dye–glycerol (EG) solutions of varying concentrations were prepared at room temperature (23 °C) and used as samples for the viscosity tests. The effect of viscosity was analyzed by comparing the received SAW-PA signal from the EG solution with the erythrosine dye–water (EW) solution of analogous dye concentrations. The laser light at a fixed wavelength of 530 nm with pulsed excitation was used to illuminate the sample. Glycerol added to the dye induces optical clearing effects to reduce scattering and therefore enhanced the SAW-PA signal.34Fig. 5(b) shows the percentage increase in the SAW-PA signal amplitude of the EG solution with respect to the EW solution for various dye concentrations. At 50% dye concentration, a 65% increase in the signal intensity was observed for the EG solution. This result demonstrates a clear enhancement in the SAW-PA signal amplitudes due to increasing viscosity of the fluids. At higher dye concentrations, the viscosity of the EG solution decreases and becomes comparable to the EW solution, which decreases the relative magnitude of the SAW-PA signal intensity.
SAW-PA response from gold nanoparticle solution
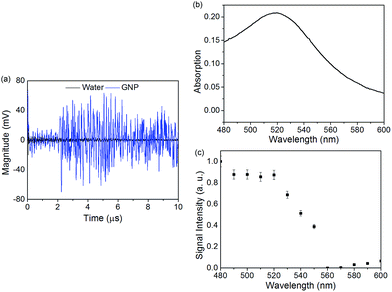
Metal nanoparticles (NPs) with strong plasmon absorption in the visible and the near-infrared wavelengths provide enhanced capabilities in the specific detection of analytes for biosensing applications. The capability of the SAW-PA device to detect plasmonic absorption of gold nanoparticles (GNPs) and gold nanorods (GNRs) was investigated by introducing GNPs and GNRs (stabilized with CTAB surfactant) dispersed in water into the microchannel. The plasmonic absorption and subsequent non-radiative relaxation dominated PA generation for optically heterogeneous nanostructures differ fundamentally from the PA signals generated by the optically homogenous dye solutions. Pulsed laser with wavelengths 480–600 nm was used for spectroscopic characterization of the nanoparticles. The signal received from the SAW-PA device was averaged over 300 sweeps. Water in the PDMS microchannel was used as the reference solution to which the GNP induced SAW-PA signal was calibrated. Fig. 6(a) shows the transient SAW-PA signal from 12 nm GNP solution (2 mg mL−1) compared to water as a reference at an excitation wavelength of 520 nm. As shown in Fig. 6(a), a clear enhancement in the SAW-PA signal was observed for the GNPs in the microchannel. We further measured the spectroscopic response of the GNPs. Fig. 6(b) shows the UV/Vis absorption spectrum of GNPs (2 mg mL−1, ca. 6 × 10¹² particles per mL−1) in aqueous solution, with an absorption maximum at 520 nm. The SAW-PA signal (normalized to laser intensity) shown in Fig. 6(c) follows the absorption profile from 500 nm and higher wavelengths, with an absorption peak at 520 nm. The deviations at lower wavelengths (less than 500 nm) was also reported in a previous work, which was attributed to scattering effects.35SAW-PA response of spherical gold nanoparticles and gold nanorods
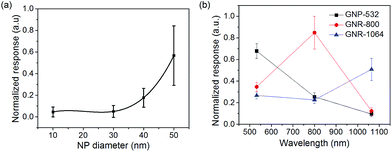
Spherical GNPs of various sizes (10–50 nm in diameter) were diluted in water to obtain identical extinction values (0.7 cm−1) at an excitation wavelength of 532 nm.Fig. 7(a) shows that the SAW-PA signal for different sizes of the GNPs at an excitation wavelength of 532 nm increases as a third-order polynomial function of the NP diameter. The standard deviation was calculated over five repeated measurements. The NPs generate nonlinear PA signals at a threshold fluence of ∼300 mJ cm−2.36 Beyond the threshold fluence, the temperature of the NPs quickly increases to the boiling point of the surrounding water and generates nanobubbles. Previous researchers have proposed analytical models for the bubble generation and dependence of the NP diameter on PA signal amplitude. Accordingly, the PA signal amplitude increases with NP sizes.37 The threshold for the nonlinearity in the dye is higher than the nanoparticle. For the erythrosine dye with an optical absorption coefficient of 100 cm−1, the temperature rise is ca. 0.5 °C. Hence, the nonlinear behaviour in dye is less profound than in the NPs.
The efficacy of the SAW-PA for biosensing applications can be further emphasized by sensing the plasmon resonance modes of the gold nanorods (GNRs) at visible and near-infrared regions. The longitudinal plasmon bands are extremely sensitive to changes in the dielectric properties of the surrounding medium, improving the detection signal-noise ratio.38 GNR of dimension 10 nm × 85 nm, with the transverse and longitudinal plasmon resonance modes at 512 nm and 1064 nm respectively were used for the study. Fig. S9† illustrates the normalized SAW-PA response from various concentrations of GNR solutions at optical excitation wavelengths of 532 nm and 1064 nm. At each concentration, mean and standard deviations were obtained with five repeated measurements. The significant increase in the SAW-PA signal at 1064 nm compared to the amplitude at 532 nm conforms to the longitudinal resonance of the GNRs. The SAW-PA response of the GNP and GNR was compared by selecting three different nanoparticle solutions at a concentration of 2 mg mL−1. The samples included 40 nm (diameter) gold nanosphere, GNRs of dimension 10 nm × 85 nm (GNR1) and 10 nm × 40 nm (GNR2) (diameter × length). Fig. S10† shows the TEM images of the nanoparticles with corresponding UV-Vis absorption spectra. Fig. S11† shows the schematic diagram of the sensing mechanism of the nanostructures. The GNP has a peak plasmon-resonance wavelength at 527 nm. The two GNR's selected has a transverse plasmon absorption peak at 512 nm and 528 nm and corresponding longitudinal peaks at 1064 nm and 758 nm. Fig. 7(b) shows the experimental results for the SAW-PA response for the three nanoparticle solutions. From the graphs, at 800 nm and 1064 nm optical wavelengths, the GNR2 and GNR1 have the maximum signal amplitudes respectively. GNR2 with an effective radius of 21.5 and aspect ratio of 3.4 has a per micron optical absorption at 800 nm of ca. 400 μm−1 and the optical absorption of GNP at 532 nm is 75 μm−1 (ca.).39 This explains the reason for larger signal amplitude at 800 nm for GNR2 compared to GNP at 532 nm. GNRs with high aspect ratio and smaller effective radius increase the optical absorption leading to improved SAW-PA response. The lower response for the GNR1, which has an effective radius of 25 nm and an aspect-ratio of 5.48 at 1064 nm, is attributed to the increased contribution of scattering to the absorption, which increases nonlinearly with effective radius. The variation in morphology of the nanoparticle shifts the peak absorption wavelength, which is determined by measuring the optical wavelength at which the SAW-PA response is the maximum as shown in Fig. 7(b).
Conclusion
In summary, we have developed a novel integrated SAW-PA sensor platform for a couplant-free, simultaneous optical and mechanical characterization of fluids flowing through a microchannel. The PA generated longitudinal acoustic wave is mode converted into Rayleigh SAW at the interface of the liquid-LiNbO3 substrate. By exploiting the piezoelectric substrate as the medium for acoustic wave propagation, the requirement of a coupling layer (water) for the ultrasound transducer was eliminated in this platform. A high mode conversion efficiency of 80 percent is possible by optimal designs of this SAW-PA device. The optical characterization capability of the SAW-PA device was demonstrated by performing the optical absorption spectroscopy and measuring the concentration of the fluid sample in the microchannel using two standard dye solutions. We further investigated the effects of viscosity on the SAW-PA signal to exhibit the ability of the platform to detect mechanical parameters of the fluid, which is otherwise difficult to detect using standard optical protocols. The sensor was also successfully applied to study the SAW-PA response of plasmonic nanoparticles by selecting various sizes of GNPs and GNRs as a model system. The SAW-PA signal from the GNPs in the microchannel was detected, with an expected signal dependence on the wavelength from the 500–600 nm range. The nonlinear PA signal generated for GNPs shows an increasing sensitivity with the size of GNPs. Further, detection of the highly sensitive longitudinal plasmon resonance mode of GNRs at 1064 nm demonstrates the capability of the platform for biosensing. In future, the SAW-PA platform can also be applied for bio/chemical sensing by detecting the shift in optical absorption spectra, which is induced by the receptor-analyte binding.Acknowledgements
This work was supported by A*Star SIMTech under its collaborative research project grant (CRP-U12-V-027SU/SIMT/12-410012) and M4061455: iFood Research Grant, NTU.References
- T. D. Luong, V. N. Phan and N. T. Nguyen, Microfluid. Nanofluid., 2011, 10, 619–625 CrossRef CAS.
- A. Renaudin, P. Tabourier, V. Zhang, J. C. Camart and C. Druon, Sens. Actuators, B, 2006, 113, 389–397 CrossRef CAS.
- S. Li, X. Ding, F. Guo, Y. Chen, M. I. Lapsley, S.-C. S. Lin, L. Wang, J. P. McCoy, C. E. Cameron and T. J. Huang, Anal. Chem., 2013, 85, 5468–5474 CrossRef CAS PubMed.
- L. Schmid, D. A. Weitz and T. Franke, Lab Chip, 2014, 14, 3710–3718 RSC.
- Y. Chen, S. Li, Y. Gu, P. Li, X. Ding, L. Wang, J. P. McCoy, S. J. Levine and T. J. Huang, Lab Chip, 2014, 14, 924–930 RSC.
- P. R. Rogers, J. R. Friend and L. Y. Yeo, Lab Chip, 2010, 10, 2979–2985 RSC.
- O. Tigli, L. Bivona, P. Berg and M. E. Zaghloul, IEEE Transactions on Biomedical Circuits and Systems, 2010, 4, 62–73 CrossRef CAS PubMed.
- D. Ciplys and R. Rimeika, IEEE Int. Ultrason. Symp., 2013, 1333–1336 CAS.
- T. Nomura, A. Saitoh and Y. Horikoshi, Sens. Actuators, B, 2001, 76, 69–73 CrossRef CAS.
- X. Ding, P. Li, S. C. S. Lin, Z. S. Stratton, N. Nama, F. Guo, D. Slotcavage, X. Mao, J. Shi, F. Costanzo and T. J. Huang, Lab Chip, 2013, 13, 3626–3649 RSC.
- F. Guo, P. Li, J. B. French, Z. Mao, H. Zhao, S. Li, N. Nama, J. R. Fick, S. J. Benkovic and T. J. Huang, Proc. Natl. Acad. Sci. U. S. A., 2015, 112, 43–48 CrossRef CAS PubMed.
- R. Kishor, Y. P. Seah, Y. J. Zheng, H. M. Xia, Z. F. Wang, H. J. Lu and T. T. Lim, Sens. Actuators, A, 2015, 233, 360–367 CrossRef CAS.
- L. E. Helseth, Opt. Express, 2012, 20, 4653–4662 CrossRef CAS PubMed.
- I. Niskanen, J. Räty and K.-E. Peiponen, Appl. Opt., 2010, 49, 3428–3433 CrossRef PubMed.
- E. Weber and M. J. Vellekoop, Lab Chip, 2012, 12, 3754–3759 RSC.
- H. Yu, G. Zhou, F. S. Chau and F. Lee, Opt. Lett., 2009, 34, 1753–1755 CrossRef PubMed.
- C. Guzmán, H. Flyvbjerg, R. Köszali, C. Ecoffet, L. Forró and S. Jeney, Appl. Phys. Lett., 2008, 93, 184102 CrossRef.
- S. Keen, A. Yao, J. Leach, R. Di Leonardo, C. Saunter, G. Love, J. Cooper and M. Padgett, Lab Chip, 2009, 9, 2059–2062 RSC.
- F. Gao, X. Feng and Y. Zheng, Appl. Phys. Lett., 2014, 104, 213701 CrossRef.
- F. Gao, X. Feng, Y. Zheng and C. D. Ohl, J. Biomed. Opt., 2014, 19, 067006 CrossRef PubMed.
- L. V. Wang and S. Hu, Science, 2012, 335, 1458–1462 CrossRef CAS PubMed.
- M. Xu and L. V. Wang, Rev. Sci. Instrum., 2006, 77, 041101 CrossRef.
- H. F. Zhang, K. Maslov, G. Stoica and L. V. Wang, Nat. Biotechnol., 2006, 24, 848–851 CrossRef CAS PubMed.
- S. K. Maji, S. Sreejith, J. Joseph, M. Lin, T. He, Y. Tong, H. Sun, S. W.-K. Yu and Y. Zhao, Adv. Mater., 2014, 26, 5633–5638 CrossRef CAS PubMed.
- S. Sreejith, J. Joseph, K. T. Nguyen, V. M. Murukeshan, S. W. Lye and Y. Zhao, ChemNanoMat, 2015, 1, 39–45 CrossRef CAS.
- S. Sreejith, J. Joseph, M. Lin, N. V. Menon, P. Borah, H. J. Ng, Y. X. Loong, Y. Kang, S. W.-K. Yu and Y. Zhao, ACS Nano, 2015, 9, 5695–5704 CrossRef CAS PubMed.
- C. M. O'Brien, K. D. Rood, K. Bhattacharyya, T. DeSouza, S. Sengupta, S. K. Gupta, J. D. Mosley, B. S. Goldschmidt, N. Sharma and J. A. Viator, J. Biomed. Opt., 2012, 17, 0612211–0612219 Search PubMed.
- A. Biswas, T. Wang and A. S. Biris, Nanoscale, 2010, 2, 1560–1572 RSC.
- T. W. Bristol, W. Jones, P. B. Snow and W. R. Smith, IEEE Int. Ultrason. Symp., 1972, 343–345 Search PubMed.
- C. Campbell, in Surface Acoustic Wave Devices for Mobile and Wireless Communications, Academic press, San Diego, 1998, p. 631 Search PubMed.
- L. V. Wang, IEEE J. Sel. Top. Quantum Electron., 2008, 14, 171–179 CrossRef CAS.
- T. Schmid, U. Panne, R. Niessner and C. Haisch, Anal. Chem., 2009, 81, 2403–2409 CrossRef CAS PubMed.
- J. Wang, T. Liu, S. Jiao, R. Chen, Q. Zhou, K. K. Shung, L. V. Wang and H. F. Zhang, J. Biomed. Opt., 2010, 15, 021317 CrossRef PubMed.
- Q. Zhao, L. Li, Q. Li, X. Jiang, Q. Ren, X. Chai and C. Zhou, J. Biomed. Opt., 2014, 19, 036019 CrossRef PubMed.
- A. Feis, C. Gellini, P. R. Salvi and M. Becucci, J. Photoacoust., 2014, 2, 47–53 CrossRef PubMed.
- J.-W. Kim, E. I. Galanzha, E. V. Shashkov, H.-M. Moon and V. P. Zharov, Nat. Nanotechnol., 2009, 4, 688–694 CrossRef CAS PubMed.
- M. G. González, X. Liu, R. Niessner and C. Haisch, Appl. Phys. Lett., 2010, 96, 174104 CrossRef.
- C. Yu and J. Irudayaraj, Anal. Chem., 2007, 79, 572–579 CrossRef CAS PubMed.
- P. K. Jain, K. S. Lee, I. H. El-Sayed and M. A. El-Sayed, J. Phys. Chem. B, 2006, 110, 7238–7248 CrossRef CAS PubMed.
Footnotes |
| † Electronic supplementary information (ESI) available. See DOI: 10.1039/c6ra06849a |
| ‡ These authors contributed equally to this work. |
| This journal is © The Royal Society of Chemistry 2016 |

